

We use cookies to ensure our website works properly and to personalise your experience. Cookies policy
1Assistant Professor, Department of Pharmaceutical Analysis, College of Pharmaceutical Sciences, Government Medical College, Thiruvananthapuram, Kerala, India. 695011.
2,3,4,5,6 Department of Pharmaceutical Analysis, College of Pharmaceutical Sciences, Government Medical College, Thiruvananthapuram, Kerala, India. 695011.
The present study aims to develop simple, sensitive, accurate, precise, and rapid UV spectrophotometric method for the estimation of Azelnidipine in tablet dosage form. The ?max of Azelnidipine was found to be 256 nm in isopropyl alcohol. The solvent selected was inexpensive, eco-friendly and less toxic. Beer's law was obeyed over the concentration range of 4-20 µg/mL. The method demonstrated excellent linearity over the studied concentration range, with a R2 value of 0.9999, indicating a strong relationship between concentration and response. The sensitivity of the method was confirmed by a low limit of detection (LOD) of 0.6927 µg/ mL and limit of quantification (LOQ) of 2.0992 µg/ mL, reflecting the capability of the method to detect and quantify the analyte at low concentration levels. Precision studies showed % RSD values of less than 2 %, confirming good repeatability. Accuracy was evaluated by recovery studies at three concentration levels and the results were within acceptable limits. Overall, the validated method exhibited high linearity, sensitivity, accuracy and precision, making it suitable, reliable and effective for routine analytical applications.
The prevalence of hypertension continues to rise worldwide, posing a significant challenge to cardiovascular health. It is usually asymptomatic but can lead to serious complications if untreated, highlighting the need for early detection and proper management.[1] Azelnidipine is a long acting, third-generation dihydropyridine calcium channel antagonist. Drugs belonging to the dihydropyridine class are commonly used to decrease systemic vascular resistance and arterial pressure. In addition to its antihypertensive effect, Azelnidipine has been reported to provide cardiovascular protection, exhibit neuroprotective properties, reduce atherosclerotic progression as well as improve insulin resistance.[2]
Drug analysis is an essential component of pharmaceutical science that ensures the safety, quality, and efficacy of medicines. It involves the identification and quantitative estimation of drugs in bulk materials and dosage forms throughout various stages of development and quality control. Analytical methods play a crucial role in detecting impurities, degradation products, and variations in drug content. These methods include classical techniques such as titrimetry and modern instrumental approaches like spectroscopic and chromatographic methods, which provide accurate, precise, and reliable results.[3] A number of studies have focused on the development and validation of analytical methods for the estimation of Azelnidipine in pharmaceutical dosage forms, employing techniques such as UV spectrophotometry[4-12], reverse-phase high-performance liquid chromatography (RP-HPLC)[13-14], and stability-indicating methods[15-16], which have shown satisfactory validation characteristics as per ICH guidelines.
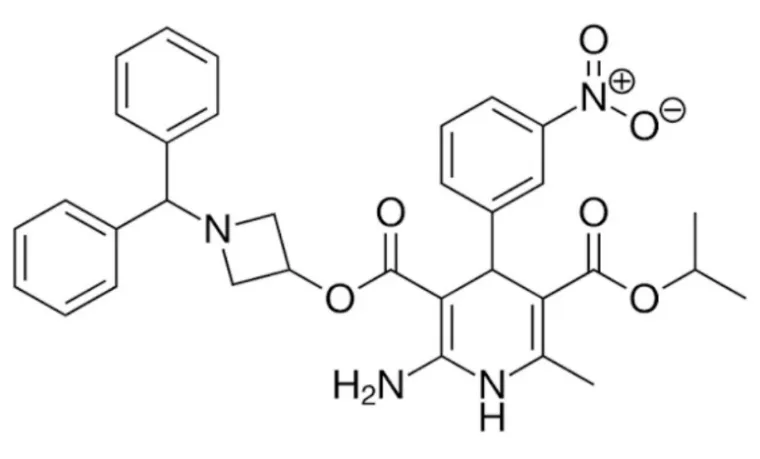
Figure 1. Chemical structure of Azelnidipine [19]
Table 1. Physicochemical properties of Azelnidipine [17-21]
|
Sl. No. |
Parameters |
Azelnidipine |
|
1 |
IUPAC Name |
3-(1-Benzhydrylazetidin-3yl)-5-isopropyl-2-amino-1,4-dihydro-6-methyl-4-(3-nitrophenyl) pyridine-3,5-dicarboxylate |
|
2 |
Molecular Formula |
C33H34N4O6 |
|
3 |
Molecular Weight |
582.7g/moL |
|
4 |
CAS Number |
123524-52-7 |
|
5 |
Appearance |
A light yellow to yellow crystalline powder |
|
6 |
Solubility |
Freely soluble in acetone, soluble in ethyl acetate, sparingly soluble in water and slightly soluble in methanol. |
|
7 |
Melting Point |
193-195 ֯ C |
|
8 |
pKa |
7.89 |
MATERIALS AND METHODS
Instruments: UV-Visible double beam spectrophotometer (UH 5300, Hitachi High-Technologies Corporation, Tokyo, Japan) was utilized for spectral measurements, employing one-centimetre-matched quartz cells. The Shimadzu electronic balance (ATX 224, Shimadzu corporation, Kyoto, Japan) was used for weighing all samples. Additionally, GT sonic ultra-sonic cleaner was used to sonicate the solution to ensure complete extraction and homogenous mixing.
Chemicals and Reagents: All chemicals and solvents used were of analytical reagent grade. Azelnidipine, a certified reference standard was used for the study. The pharmaceutical dosage form used in study was Azelnidipine tablet (label claim-16 mg) manufactured by Precise Chemipharma Pvt. Ltd (Nashik, Maharashtra, India). This formulation was purchased from a local pharmacy.
METHODOLOGY
Preparation of Standard Stock Solution of Azelnidipine RS in Isopropyl alcohol
Weighed accurately 25mg of Azelnidipine RS and dissolved in 25 ml of isopropyl alcohol, a 1000 µg/ml solution was obtained (Solution A).
From Solution A, 2.5 ml was pipetted out to a 25 ml of standard flask made up the volume with isopropyl alcohol. The solution had a concentration of 100 µg/ml of Azelnidipine (Solution B).
Study of spectral characteristics of Azelnidipine
After stabilizing the instrument for 30 minutes initially, a blank correction was done by using isopropyl alcohol. Then 16 µg/ml solution was scanned in UV region from 200-400 nm. The absorption spectrum was observed with maximum absorption at 256 nm. The spectrum observed is shown in Fig 2.
Preparation of calibration curve of Azelnidipine in Isopropyl alcohol
From the Standard solution of Azelnidipine (Solution B), accurately pipetted out 0.4ml, 0.8 ml, 1.2 ml, 1.6 ml and 2 ml and transferred separately into 10 ml volumetric flask and each 10 ml flask was made up to the mark with isopropyl alcohol to produce resulting solutions of concentration 4 µg/ml, 8 µg/ml, 12 µg/ml, 16 µg/ml and 20 µg/ml respectively. The absorbance of each solution was measured at 256 nm. An overlay spectrum was recorded. The overlay spectrum and calibration plot are shown in Fig 3 and 4.
VALIDATION OF THE PROPOSED METHOD
Accuracy
The accuracy of the proposed method was determined by recovery study. The recovery studies were performed by standard addition method at 80%,100% and 120% level and percentage recoveries were calculated.
A quantity of powder equivalent to 25 mg of Azelnidipine was accurately weighed and transferred to a 25 ml volumetric flask. The tablet was dissolved in 10 ml of isopropyl alcohol and sonicated for 20 minutes. The volume was then made up to the mark with isopropyl alcohol. The solution was filtered using Whatman filter paper. The concentration of the solution was of 1000 µg/ml of Azelnidipine (Solution A). From Solution A, 2.5 ml was pipetted out in a 25 ml volumetric flask and made up to the volume with isopropyl alcohol. The solution had a concentration of 100 µg/ml of Azelnidipine (Solution B). From Solution B accurately pipetted out 0.8 ml in 10 ml Standard flask and 0.64 ml Standard solution of 100 µg/ml Azelnidipine was added and made up the volume up to the mark by isopropyl alcohol. The absorbance of the above solution was measured at 256 nm in triplicates and the amount recovered were calculated. Similarly, the recovery study was carried out for solution of 100 % and 120 %. The absorbance was measured and furnished in the Table 3.
Linearity
The linearity study was conducted to evaluate the linear relationship across the range of analytical procedure.
The linear response of Azelnidipine was determined by analysing 5 different concentrations of the standard solution. The solution was prepared by accurately pipetting out 0.4ml, 0.8ml, 1.2ml, 1.6ml and 2ml from stock solution B into 5 different 10 ml standard flask and made up the volume using isopropyl alcohol. The calibration curve of absorbance v/s concentration was plotted and correlation coefficient and regression line equation were determined.
Range
From the linearity studies, the range for the proposed method was determined
Precision
Precision is the measure of degree of reproducibility or the repeatability of the analytical method under normal operating circumstances.
Repeatability Study
The repeatability of the method was studied by six determinations of 16 µg/ml of test concentration. Study data and results are tabulated in Table 4.
Limit of Detection (LOD) and Limit of Quantification (LOQ)
LOD
The limit of detection was calculated by the following equation;
LOD = 3.3 × σ/S
Where, σ - Standard deviation of the responses
S - Slope of the calibration curve
LOQ
The limit of quantification was calculated by the following equation;
LOQ = 10 × σ/S
Where, σ - Standard deviation of the responses
S - Slope of the calibration curve
LOD and LOQ were determined from the calibration curve and results are tabulated in the Table 5.
Assay of Azelnidipine tablet dosage form
Twenty tablets of Azelnidipine (16 mg) were weighed and average weight was calculated and finely powdered with the help of mortar and pestle. A quantity of powder equivalent to 25 mg of Azelnidipine was accurately weighed and transferred to a 25 ml volumetric flask. The tablet was dissolved in 10 ml of isopropyl alcohol and sonicated for 20 minutes. The volume was then made up to the mark with isopropyl alcohol.
The solution was filtered using Whatman filter paper. The concentration of the solution was of 1000 µg/ml of Azelnidipine (Solution A). From Solution A, 2.5 ml was pipetted out in a 25 ml volumetric flask and made up to the volume with isopropyl alcohol. The solution had a concentration of 100 µg/ml of Azelnidipine (Solution B). From Solution B accurately pipetted out 1.2 ml and transferred into a 10 ml volumetric flask and the volume was made up to the mark with isopropyl alcohol. The absorbance of solution was measured at 256 nm. The assay results obtained are shown in Table 6.
RESULTS AND DISCUSSION
Selection of wavelength and study of spectral characteristics

Figure 2. Absorption spectra of Azelnidipine (16 µg/mL)
The spectrum was scanned from 200-400 nm and the λmax was found to be 256 nm.

Figure 3. Overlay UV Spectrum of Azelnidipine
All spectra exhibited a common absorption maximum λmax at 256 nm, with absorbance increasing proportionally with concentration. The overlay spectrum confirms the absence of wavelength shift across concentration range, indicating the suitability of 256 nm as the analytical wavelength for quantitative estimation.
Linearity
The linear response of Azelnidipine was determined by analysing 5 different concentrations of the standard solution and the result are shown in the Table 2.
Table 2. Absorbance Data of Azelnidipine
|
Sl. No. |
Concentration (µg/mL) |
Absorbance |
|
1 |
4 |
0.236 |
|
2 |
8 |
0.452 |
|
3 |
12 |
0.666 |
|
4 |
16 |
0.887 |
|
5 |
20 |
1.093 |
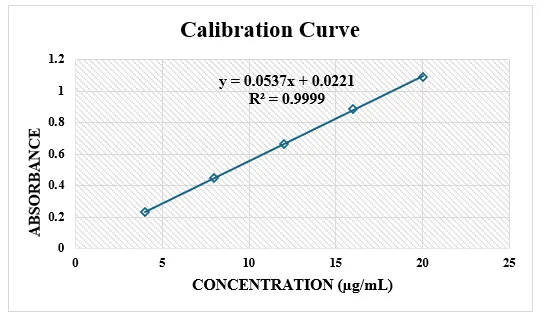
Figure 4. Calibration plot of Azelnidipine (Absorbance v/s Concentration)
Linearity was evaluated using the calibration curve, which exhibited an excellent linear relationship over the concentration range of 4–20 µg/mL. Regression analysis of the calibration data yielded the equation y = 0.0537x + 0.0221, with a regression coefficient of 0.9999. The slope and intercept were found to be 0.0537 and 0.0221 respectively.
Accuracy
Accuracy was evaluated by standard addition method at 3 concentration level – 80%, 100% and 120%. Each level was analysed in triplicates and their absorbance was measured at 256 nm. A fixed concentration of 8 µg/mL of drug was maintained as the base and standard Azelnidipine was then added at concentration 6.4, 8 and 9.6 µg/mL respectively. The results of accuracy are shown in the Table 3. The accuracy was within the specified limit.
Table 3. Accuracy data
|
Sl. No. |
Level of % Recovery |
Absorbance |
Concentration of drug present (µg/mL) |
Concentration of standard added (µg/mL) |
% Recovery ± RSD |
|
1 |
80 |
0.798 |
8 |
6.4 |
100.33±0.38 |
|
0.796 |
8 |
6.4 |
|||
|
0.799 |
8 |
6.4 |
|||
|
2 |
100 |
0.886 |
8 |
8 |
101.17±0.58 |
|
0.889 |
8 |
8 |
|||
|
0.884 |
8 |
8 |
|||
|
3 |
120 |
0.976 |
8 |
9.6 |
101.63±0.29 |
|
0.974 |
8 |
9.6 |
|||
|
0.977 |
8 |
9.6 |
Precision
The precision of the proposed method was evaluated through repeatability, absorbance of solution of 16 µg/ mL concentration was evaluated six times at 256 nm. The obtained values are shown in the Table 4 and the % RSD was found to be < 2.
Table 4. Repeatability data.
|
Sl. No. |
Concentration (µg/mL) |
Absorbance |
Mean % Label claim |
Standard deviation |
% RSD |
|
1 |
16 |
0.878 |
99.83 |
1.8683 |
1.8715 |
|
2 |
0.862 |
||||
|
3 |
0.887 |
||||
|
4 |
0.860 |
||||
|
5 |
0.895 |
||||
|
6 |
0.897 |
Limit of detection (LOD) and Limit of quantification (LOQ)
The LOD and LOQ were calculated using standard deviation and slope and the values are shown in the Table 5.
Table 5. LOD and LOQ results
|
Method parameters |
Azelnidipine |
|
LOD (µg/mL) |
0.6927 |
|
LOQ (µg/mL) |
2.0992 |
Assay
The assay of the tablet formulation was performed using the concentration of 12 µg/mL. The absorbance of the sample solution was found to be 0.662, corresponding to an estimated drug concentration of 11.93 µg/mL as calculated from the calibration curve. The % label claim was found to be 98.76 ± 0.0540.
Table 6. Assay of Azelnidipine tablet
|
Formulation |
Concentration (µg/mL) |
Absorbance |
Concentration estimated (µg/mL) |
Assay Label claim % |
Mean SD |
% RSD |
|
Tablet |
12 |
0.662 |
11.93 |
98.76 |
0.0534 |
0.0540 |
CONCLUSION
A UV spectrophotometric method for the estimation of Azelnidipine in pharmaceutical dosage forms has been developed and validated using isopropyl alcohol as solvent. The λmax was found to be 256nm. The overlay spectrum shows absorbance linearly increases with concentration and confirms the absence of wavelength shift across concentration range. The method shows excellent linearity (R2 = 0.9999) within a range of 4-20 µg/mL. The assay result indicates 98.76% of the label claim. The percentage recovery of tablet was found to be in the range of 100.33 ± 0.37 − 101.63 ± 0.29 and are within the acceptable range. The precision of the method was evaluated by repeatability study. The results showed that the relative standard deviation (RSD) values for repeated measurements were below 2% The Limit of Detection (LOD) of 0.6927 µg/ mL and a Limit of Quantitation (LOQ) of 2.0992 µg/ mL were obtained. The proposed method is simple, precise, accurate, cost-effective, and eco-friendly. The developed spectrophotometric method was validated as per ICH guidelines and was found to be within the prescribed limits. From the results, it may be concluded that the proposed method is suitable for routine analysis of Azelnidipine tablets in quality control.
ACKNOWLEDGEMENT
Authors express sincere gratitude to College of Pharmaceutical Sciences, Government Medical College, Thiruvananthapuram, for providing the necessary facilities and support to carry out the work.
REFERENCES

Geetha P. Nair *, Ahmad Safwath C .M ., Aparna Ajithkumar, Aswathi M., Mugdha Pradeep ,Safana U., Development And Validation Of A Uv Spectrophotometric Method For The Estimation Of Azelnidipine In Pharmaceutical Dosage Form, Int. J. of Pharm. Sci., 2026, Vol 4, Issue 7, 4071-4080. https://doi.org/ 10.5281/zenodo.21470072
 10.5281/zenodo.21470072