
We use cookies to ensure our website works properly and to personalise your experience. Cookies policy
College of Pharmaceutical Sciences, Govt. Medical college, Thiruvananthapuram.
Analytical method development and validation are essential in the discovery, synthesis, and formulation of pharmaceuticals. The present study aims to develop and validate a simple, sensitive and rapid UV spectrophotometric method for the estimation of Mefenamic acid in bulk and tablet dosage form. Unlike many reported methods which require sophisticated instruments, organic solvents, and skilled personnels, the proposed method offers a simpler alternative. Mefenamic acid has a pKa of 4.2 and exhibits poor aqueous solubility at neutral pH. Therefore, buffer solutions of pH 7.0, 7.5, 8.0, and 9.7 were evaluated to identify a suitable solvent system. Carbonate buffer of pH 9.7 was selected as the solvent since the drug showed appreciable solubility. The developed UV spectrophotometric method showed excellent linearity over the concentration range of 5–30 µg/mL, with a correlation coefficient (R²) of 0.9994. The method was validated according to ICH Q2(R2) guidelines. The LOD and LOQ were found to be 0.871 and 2.641 respectively. Statistical analysis showed a relative standard deviation of less than 2% in the interday and intraday repeatability studies. The percentage recovery was found to be more than 100% with a %RSD less than 2 in standard addition method. A comparative study of the assay of commercially available tablet dosage form with that specified in the IP monograph further demonstrated the sensitivity and accuracy of the developed method. Since no organic solvents was involved in the assay, the method is cost-effective and eco-friendly. This method can be effectively applied for the routine analysis of Mefenamic acid in both bulk drug and tablet dosage forms
Non-steroidal anti-inflammatory drugs (NSAIDs) form an essential class of therapeutic agents used for the management of pain, inflammation, and fever. Among them, Mefenamic acid is most widely prescribed for the management of fever and dysmenorrhoea. Due to its extensive clinical use, reliable quantification of mefenamic acid in bulk drug and tablet dosage forms is essential for quality control and regulatory compliance. Even though advanced analytical techniques like HPLC and LCMS offer high sensitivity and selectivity, they require expensive instrumentation, high maintenance cost and the use of toxic organic solvents such as methanol, acetonitrile, and ethanol. In contrast, UV–Visible spectrophotometry provides a simple, cost-effective, rapid, and widely accessible alternative for the routine estimation of drug molecules that exhibit characteristic absorbance in the UV region.[1,2] However, literature review revealed that all the existing UV spectrophotometric methods for the quantification of mefenamic acid require the use of organic solvents like methanol which is associated with health hazards, environmental toxicity, and waste management challenges. In recent years, the global push toward sustainability has promoted the development of eco-friendly analytical techniques by adopting safer solvents, minimizing chemical waste, and improving environmental compatibility. This transformation aligns with the principles of Green Analytical Chemistry (GAC), which emphasize the reduction of hazardous materials without compromising analytical quality. Hence an attempt is carried out to quantify mefenamic acid in bulk and tablet dosage form using aqueous solvents precluding the use of hazardous and toxic organic solvents. Mefenamic acid is anthranilic acid derivative. Its IUPAC name is 2-[(2,3-Dimethylphenyl) amino] benzoic acid. [3,4,5]
Mefenamic acid is weakly acidic in nature having pKa value 4.2 and is practically insoluble in water. But the aqueous solubility is higher when the medium becomes slightly alkaline. This prompted us to use an aqueous alkaline buffer medium as solvent for UV estimation. Buffers are safer, non-toxic, inexpensive, and environmentally benign solvents compared to organic solvents. Moreover, they provide pH stability, enhance aqueous solubility of weakly acidic drugs and improve the reproducibility of spectrophotometric measurements. Carbonate buffer of pH 9.7 was selected as solvent by trial-and-error method based on the solubility of the drug in various buffers of pH 7, 7.5, 8, 9 and 9.7. In this study buffer was used only for initial solubilization of the drug and further dilutions were carried out using distilled water. [6,7]
MATERIALS AND METHODS
Mefenamic acid standard drug was procured from Yarrow chemicals Mumbai. Commercially available tablet dosage form Meftal Tablet (Blue cross laboratories Pvt Ltd) was used for the assay. Sodium carbonate A.R, Sodium bicarbonate A.R, Sodium hydroxide A.R (Merk India) and Distilled water were used for the preparation of buffer solution.
Hitachi UV Spectrophotometer UH 3500, Shimadzu Analytical Balance (Model: ATX224), GT sonic Ultra -sonic cleaner (Model: GT-1990QTS), Digital pH meter (model: 68X247786) Vacuum pump was used for the study.
Selection of solvent
Preparation of carbonate Buffer pH 9.7
Dissolved 8.4 g of sodium bicarbonate and 10.6 g of sodium carbonate in sufficient water to produce 500 ml. pH was adjusted using 0.1 M sodium hydroxide solution.[8]
Preparation of standard stock solution of mefenamic acid in carbonate buffer pH 9.7
Weighed accurately 50mg of Mefenamic acid and dissolved in 50 ml of carbonate buffer of pH 9.7. The volume was made up to 100 ml by using carbonate buffer pH 9.7, to prepare 500 µg/ml solution.
Study of spectral characteristics of Mefenamic acid:
From the stock solution (500 µg/ml), appropriate dilutions were made using distilled water to prepare 20µg/ml solution. This solution was scanned in UV region ranging from 200nm to 400nm. The UV spectrum showed maximum absorption at 286 nm.
Preparation of working standard of mefenamic acid in carbonate buffer pH 9.7
From the stock solution ( 500 µg/ml) accurately pipetted out 0.1,0.2,0.3,0.4,0.5 and 0.6 ml in six 10 ml standard flasks and volume was made up to the mark with distilled water. The strength of above solutions was 5,10,15,20,25,30 µg/ml respectively.
Preparation of calibration curve of mefenamic acid in carbonate buffer pH 9.7.
The absorbance of 5,10,15,20,25,30 µg/ml solutions was measured at 286nm. A calibration curve of absorbance versus concentration was plotted.
VALIDATION OF PROPOSED METHOD
The method was validated as per ICH guidelines Q2(R2)
Accuracy
Accuracy of the proposed method was determined by recovery study. The recovery studies were performed by standard addition method at 80%, 100%, 120% level.
The sample solution was prepared by dissolving a tablet powder weight equivalent to 10 mg of mefenamic acid in 100 ml of carbonate buffer pH 9.7, resulting in a stock concentration of 100 µg/ml. From this stock, a 0.5 ml aliquot was diluted to 10 ml using distilled water, which yielded a working concentration of 5 µg/ml. The absorbance of this solution was measured at 286nm.
For the 80% level, 8 mg of the standard mefenamic acid was mixed with sample powder equivalent to 10 mg of Mefenamic acid, and dissolved in 100 ml buffer. From this stock solution, a 0.5 ml aliquot was pipetted and diluted to 10 ml with distilled water for absorbance measurement.
For the 100% level, 10 mg of the standard drug was mixed with sample powder equivalent to 10 mg of mefenamic acid, and dissolved in 100 ml buffer. From this stock solution, a 0.5 ml aliquot was pipetted and diluted to 10 ml with distilled water for absorbance measurement.
For the 120% level,12 mg of the standard drug was mixed with sample powder equivalent to 10 mg of mefenamic acid, and dissolved in 100 ml buffer. From this stock solution, a 0.5 ml aliquot was pipetted and diluted to 10 ml with distilled water for absorbance measurement.
The absorbance of above solutions was measured at 286nm and the drug content was calculated in each case. The percentage recovery was calculated using the formula.
The result was analysed statistically by Standard Deviation (SD), Percentage Relative Standard Deviation (%RSD) & Coefficient of Variance (CV).
Precision
Precision is the measure of degree of reproducibility or the repeatability of the analytical method under normal operating circumstances. Precision was determined at two levels- repeatability and intermediate precision. For repeatability study six determinations of concentrations 5μg/ml, 15μg/ml, 25μg/ml was selected and quantitatively analysed at regular time intervals of the same day and for intermediate precision the estimation was performed on three consecutive days at regular time intervals.
Linearity
The linearity study was conducted to evaluate the linear relationship across the selected range of concentrations.
The linear response of mefenamic acid was determined by analysing six different concentrations of standard solution, 5µg/ml, 10µg/ml, 15µg/ml, 20µg/ml, 25µg/ml and 30µg/ml. The absorbance of each solution was measured at 286nm with buffer-water mixture (1:19) as blank.
Range
From the linearity studies, the range for the proposed analytical method was determined.
Limit Of Detection (Lod) And Limit Of Quantification (Loq)
LOD and LOQ were determined from calibration curve using the equation:
LOD=3.3 x σ/S
LOQ=10 x σ/S
where, σ - Standard deviation of y-intercepts of regression lines and S - Slope of calibration curve
Robustness
The robustness of an analytical method is a measure of its capacity to remain unaffected by small, but deliberate variations in the method parameters such as small variations in detection wavelength. The absorbance of solutions of concentration10µg/ml and 20µg/ml was measured at wavelengths 281nm, 282nm, 285nm, 286nm and 291nm. The results were analysed and SD, %RSD &CV were calculated.
Stability
The stability study in buffer is performed mainly to confirm the reliability of analytical results. Many drugs are sensitive to pH. Stability in buffer shows whether the drug remains stable at the selected pH during analysis. Stability of mefenamic acid in carbonate buffer pH 9.7 was studied by measuring absorbance of 5μg/ml, 10μg/ml, 15μg/ml, 20μg/ml and 25μg/ml solutions at 286nm for three consecutive days at regular intervals.
Assay Of Commercially Available Tablet Dosage Form:
Twenty tablets of MEFTAL (500mg) were weighed. Average weight of one tablet was calculated and finely powdered them in a mortar using pestle. 92.52mg quantity of powder was weighed (equivalent to 50mg Mefenamic acid) and transferred to a 100 ml volumetric flask. The powder was dissolved in 50ml buffer solution and sonicated for 20 minutes. The solution was made up to 100 ml using carbonate buffer pH 9.7 and mixed well. The solution was filtered through Whatman No.1 filter paper. The resulting solution had a concentration of 500µg/ml mefenamic acid. From the above solution, accurately pipetted out 0.3 ml and transferred to a 10ml standard flask and made up to the mark using distilled water to obtain a concentration of 15µg/ml of Mefenamic acid.
Absorbance of final solution was measured at 286nm and the drug content was calculated from calibration curve and regression equation.
Comparison Of Proposed Method With Official Method In Indian Pharmacopoeia
A comparative study was conducted to determine the sensitivity of the proposed method.
Assay Of Mefenamic Acid Tablet- IP Method [9]
The tablet was assayed by official method in IP monograph
Test solution: Weighed and powdered 20 tablets. Dispersed 0.09251g of powder equivalent to 50mg mefenamic acid in 70 ml of methanol by ultrasonication and diluted to 100.0 ml with methanol. Diluted 2.0 ml of this solution to 50.0 ml with methanol.
Reference solution: A 0.002% w/v solution of mefenamic acid standard in methanol. Measured the absorbance o f the reference solution and the test solution at 254nm and estimated the contents.
RESULTS AND DISCUSSION
Selection of wavelength and study of spectral characteristics

Figure 1. UV Spectrum of mefenamic acid standard solution of concentration 20μg/ml
Preparation Of Calibration Curve
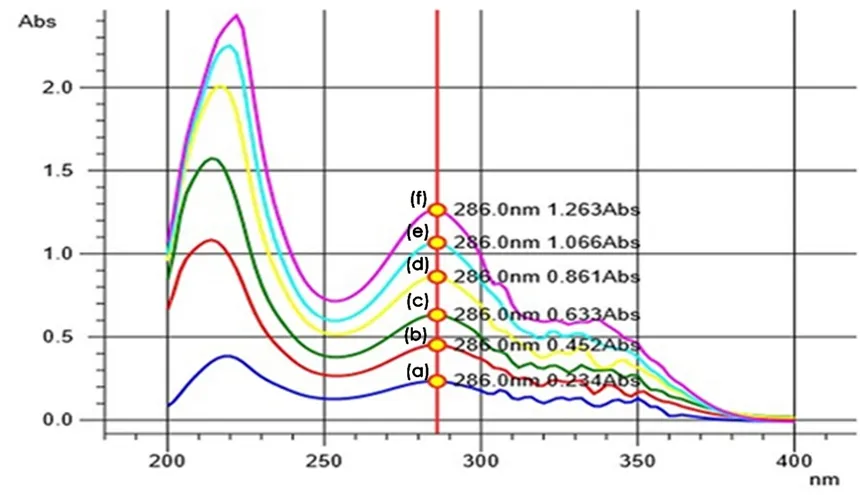
Figure 2. Overlay UV Spectrum of mefenamic acid standard solution of concentration a)5 μg/ml, b)10 μg/ml, c)15 μg/ml, d)20 μg/ml, e)25 μg/ml, f)30 μg/ml
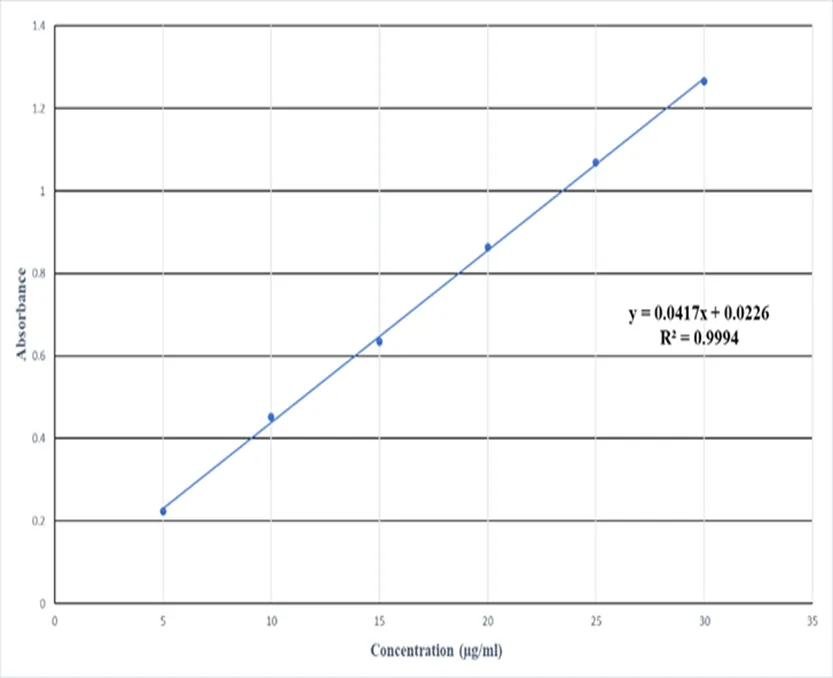
Figure 3. Calibration plot of mefenamic acid (Absorbance v/s Concentration
The absorption spectrum shows the λ max of mefenamic acid solution of concentration 20µg/ml . Maximum absorbance was observed at 286nm. The calibration plot shows that the absorbance and concentration are linear in the range 5- 30μg/ml with a correlation coefficient R² = 0.9994.
Accuracy
Recovery study of Mefenamic acid
Table 1.Accuracy - % Recovery
|
Level of % recovery |
Concentration of drug present (µg/ml) |
Concentration of standard added (µg/ml) |
Drug recovery % |
|
|
(µg/ml) |
Percentage (%) |
|||
|
|
5 |
4 |
4.028 |
100.7 |
|
80 |
5 |
4 |
4.020 |
100.5 |
|
|
5 |
4 |
4.028 |
100.7 |
|
|
5 |
5 |
5.034 |
100.6 |
|
100 |
5 |
5 |
5.010 |
100.2 |
|
|
5 |
5 |
5.034 |
100.6 |
|
|
5 |
6 |
6.031 |
100.5 |
|
120 |
5 |
6 |
6.031 |
100.5 |
|
|
5 |
6 |
6.041 |
100.6 |
The table shows the amount of drug recovered by the addition of known amount of standard Mefenamic acid.
Table 2: Recovery study- Statistical validation data
|
Level of %recovery |
Mean %recovery |
Standard deviation (SD) |
Relative standard deviation (%RSD) |
Coefficient of variation (CV) |
|
80 |
100.63 |
0.1154 |
0.1147 |
0.0011 |
|
100 |
100.46 |
0.2309 |
0.2298 |
0.0022 |
|
120 |
100.53 |
0.0577 |
0.0574 |
0.0005 |
This table shows the mean percentage recovery, Standard deviation, Relative standard deviation and Coefficient of variation from the amount of drug recovered. The study shows that the Standard deviation and Relative standard deviation of % mean recovery is less than 2 and therefore the proposed method is accurate.
Precision
Table 3. Result of Repeatability study
|
|
|
Amount obtained (μg/ml) |
|||
|
Sl. No |
Days |
5μg/ml |
15μg/ml |
25μg/ml |
|
|
1 |
|
|
7.5547 |
18.0398 |
27.565 |
|
2 |
|
10.00am |
8.8023 |
16.1443 |
27.1338 |
|
3 |
Day 1 |
|
7.4587 |
16.2403 |
28.405 |
|
4 |
|
|
7.8023 |
16.5650 |
28.664 |
|
5 |
|
3.00pm |
7.6432 |
16.7324 |
27.450 |
|
6 |
|
|
7.6210 |
16.5670 |
28.317 |
|
1 |
|
|
3.523 |
15.616 |
25.933 |
|
2 |
|
10.00am |
4.939 |
15.016 |
24.973 |
|
3 |
|
|
3.619 |
14.920 |
25.837 |
|
4 |
Day 2 |
|
5.107 |
14.368 |
25.621 |
|
5 |
|
3.00pm |
4.435 |
15.328 |
23.966 |
|
6 |
|
|
3.64 |
15.208 |
24.854 |
|
1 |
|
|
3.187 |
14.968 |
25.621 |
|
2 |
|
10.00am |
4.459 |
14.128 |
25.309 |
|
3 |
Day 3 |
|
4.651 |
13.769 |
25.405 |
|
4 |
|
|
3.459 |
14.505 |
25.406 |
|
5 |
|
3.00pm |
3.845 |
13.511 |
25.510 |
|
6 |
|
|
4.105 |
13.3011 |
25.674 |
This table shows the amount of drug obtained from Repeatability study.
Table 4: Repeatability study – Statistical validation data
|
Concentration (μg/ml) |
Mean amount obtained(%) |
Standard deviation (SD) |
Relative Standard Deviation(%RSD)
|
Coefficient of variation (CV) |
|
5 |
102.2928 |
1.8301 |
1.7891 |
0.0017 |
|
15 |
102.0808 |
1.1334 |
1.1103 |
0.0011 |
|
25 |
103.5409 |
1.2437 |
1.2012 |
0.0012 |
This table shows the mean percentage amount obtained, Standard deviation, Relative standard deviation, Coefficient of variation from Repeatability study. The table shows that the Standard deviation and Relative standard deviation of % mean recovery is less than 2 and therefore the proposed method is precise and repeatable.
Linearity and Range
Linearity study shows the absorbance and concentration are linear over the range of 5-30 μg/ml of Mefenamic acid.
Limit of Detection & Limit of Quantitation
Table 5: LOD & LOQ Result
|
Method parameters |
Mefenamic acid (at 286 nm) |
|
LOD(μg/ml) |
0.8718 |
|
LOQ(μg/ml) |
2.6419 |
The table shows LOD & LOQ value of Mefenamic acid at 286nm. The result shows the sensitivity of the method and the drug can be detected and quantified from low concentrations.
Table 6.Result of Robustness study – Statistical validation data
|
Concentration |
Mean amount obtained(%) |
Standard deviation (SD) |
Relative Standard Deviation(%RSD)
|
Coefficient of variation (CV) |
|
10μg/ml |
87.5438 |
0.1639 |
0.1872 |
0.0018 |
|
20μg/ml |
87.4100 |
0.3462 |
0.3961 |
0.0039 |
The table shows the mean percentage amount obtained, standard deviation, Relative standard deviation, coefficient of variation from Robustness study. The table shows that the standard deviation and relative standard deviation of % mean recovery is less than 2. Therefore, the proposed method is robust and reliable even when small, deliberate changes in experimental parameters (wavelength) are made
Table 7.Result of Stability study – Statistical validation data
|
Concentration |
Mean amount obtained (%) |
Standard deviation (SD) |
Relative Standard Deviation(%RSD) |
Coefficient of variation (CV) |
|
5μg/ml |
86.0705 |
0.0634 |
0.0737 |
0.0007 |
|
10μg/ml |
105.3585 |
0.1534 |
0.1456 |
0.0014 |
|
15μg/ml |
101.8303 |
0.4976 |
0.4887 |
0.0048 |
|
20μg/ml |
102.8105 |
0.3067 |
0.2983 |
0.0029 |
|
25μg/ml |
100.4956 |
0.0631 |
0.0628 |
0.0006 |
The table shows the mean percentage amount obtained, standard deviation, Relative standard deviation, coefficient of variation from Stability study. The table shows that the standard deviation and relative standard deviation of % mean recovery is less than 2 and therefore the proposed method is stable and reliable.
Comparison Of Proposed Assay Method with Official Assay Method in Indian Pharmacopoeia
Table 8: Assay of Mefenamic acid as per IP method
|
Drug |
Label claim (mg/tablet) |
Amount obtained (mg/tablet) |
Percentage label claim (%) |
|
Mefenamic acid |
500 |
497.15 |
99.43 |
The table shows the percentage label claim of Mefenamic acid tablet
Table 9: Assay of Mefenamic acid as per Proposed method
|
Drug |
Label claim (mg/tablet) |
Amount obtained (mg/tablet) |
Percentage label claim (%) |
|
Mefenamic acid |
500 |
496.3 |
99.26 |
Percentage label claim of Mefenamic acid is 99.26 %w/w and % label claim of mefenamic acid obtained as per developed method was 99.43% w/w. According to the IP, the percentage label claim for Mefenamic acid tablets is not less than 95.0 per cent and not more than 105.0 per cent of the stated amount of Mefenamic acid. The result shows that the developed method is as accurate as official procedure using more ecofriendly and cost-effective solvents.
SUMMARY AND CONCLUSION
A UV spectrophotometric method for the estimation of Mefenamic acid in bulk and tablet dosage forms has been developed and validated. The proposed method is simple, precise, accurate, cost-effective, and eco-friendly since it uses buffer for the preparation of stock solution only and all further dilutions to prepare working standards were done using distilled water precluding the use of any organic solvents. The developed spectrophotometric method was validated as per ICH guidelines Q2(R2) . The common excipients and other additives usually present in the tablet dosage form did not show interference in the analysis of the drug by the method. Hence the proposed method can be conveniently applied for routine quality control analysis of Mefenamic acid in bulk and tablet dosage forms.
ACKNOWLEDGEMENT
Authors express heartfelt gratitude to College of Pharmaceutical Sciences , Govt. Medical College, Thiruvananthapuram for providing all facilities to carryout the work
REFERENCES

Anitha Thomas, Akshaya C.T, Amal R, Aparna N.T, K.S. Aiswarya, Vipin Joseph, Development And Validation of Novel Eco-Friendly UV Spectrophotometric Method for The Estimation of Mefenamic Acid in Bulk and Tablet Dosage Form, Int. J. of Pharm. Sci., 2026, Vol 4, Issue 7, 270-279, https://doi.org/10.5281/zenodo.21131767
 10.5281/zenodo.21131767