

We use cookies to ensure our website works properly and to personalise your experience. Cookies policy
M.pharm (Pharmaceutical chemistry), Maharashtra Institute of Pharmacy Betala, Bramhapuri
The present study aimed to develop and validate a simple, rapid, accurate, precise, robust, and stability-indicating Reverse Phase High Performance Liquid Chromatography (RP-HPLC) method for the simultaneous estimation of Mebendazole and Ivermectin in pharmaceutical dosage forms. Mebendazole and Ivermectin are widely used antiparasitic agents, and accurate quantification of these drugs in combined formulations is essential to ensure product quality, safety, and therapeutic efficacy. Chromatographic separation was achieved using a Phenomenex Luna C18 column (250 mm × 4.6 mm, 5 µm particle size) with a mobile phase consisting of 0.1 M potassium dihydrogen orthophosphate buffer (pH 3.5) and acetonitrile in the ratio of 45:55 (v/v). The flow rate was maintained at 1.0 mL/min and detection was carried out at 245 nm using a photodiode array detector. Under the optimized chromatographic conditions, Mebendazole and Ivermectin were eluted at retention times of 4.12 min and 6.85 min, respectively, with excellent peak symmetry and satisfactory resolution. The developed method was validated according to ICH Q2 guidelines with respect to system suitability, specificity, linearity, accuracy, precision, robustness, limit of detection (LOD), and limit of quantification (LOQ). The method exhibited excellent linearity over the concentration ranges of 50–150 µg/mL for Mebendazole and 3–9 µg/mL for Ivermectin, with correlation coefficient values of 0.9997 and 0.9998, respectively. Accuracy studies demonstrated mean recoveries of 99.81% for Mebendazole and 99.92% for Ivermectin Precision studies showed %RSD values below 2.0%, confirming excellent repeatability and reproducibility. Robustness evaluation indicated that minor deliberate variations in chromatographic conditions did not significantly affect analytical performance. The low LOD and LOQ values confirmed the high sensitivity of the method. The developed RP-HPLC method was found to be specific, reliable, economical, and suitable for routine quality control analysis, stability studies, and pharmaceutical research involving the simultaneous estimation of Mebendazole and Ivermectin in combined dosage forms.
Mebendazole (MBZ) and Ivermectin (IVM) are widely used antiparasitic agents employed in the treatment of various helminthic and parasitic infections. Mebendazole belongs to the benzimidazole class of anthelmintics and exerts its pharmacological action by inhibiting microtubule synthesis in parasitic worms, thereby disrupting glucose uptake and leading to parasite death. Ivermectin, a macrocyclic lactone derivative, acts by binding to glutamate-gated chloride ion channels in parasites, causing paralysis and elimination of the organism. The combination of these two drugs has gained significant therapeutic importance due to their broad-spectrum antiparasitic activity and improved treatment outcomes.
The increasing use of fixed-dose combination (FDC) formulations containing Mebendazole and Ivermectin necessitates the development of reliable analytical methods for their simultaneous quantification. Accurate determination of active pharmaceutical ingredients in combined dosage forms is essential to ensure product quality, safety, efficacy, and regulatory compliance. Analytical methods used for routine quality control must be capable of providing precise, accurate, and reproducible results while effectively separating the analytes from excipients, impurities, and degradation products.
High Performance Liquid Chromatography (HPLC) is one of the most widely accepted analytical techniques for pharmaceutical analysis due to its high sensitivity, selectivity, precision, and versatility. Among various chromatographic approaches, Reverse Phase High Performance Liquid Chromatography (RP-HPLC) has become the method of choice for the analysis of pharmaceutical compounds because of its excellent separation efficiency and suitability for compounds with diverse physicochemical properties. Furthermore, regulatory authorities recommend the use of stability-indicating analytical methods capable of detecting changes in drug quality during storage and handling.
Method validation is an essential requirement in pharmaceutical analysis to demonstrate the suitability of an analytical procedure for its intended purpose. According to International Council for Harmonisation (ICH) guidelines, validation parameters such as specificity, linearity, accuracy, precision, robustness, limit of detection (LOD), and limit of quantification (LOQ) must be evaluated to establish the reliability of the developed method.
Therefore, the present study was undertaken to develop and validate a simple, rapid, accurate, precise, and stability-indicating RP-HPLC method for the simultaneous estimation of Mebendazole and Ivermectin in pharmaceutical dosage forms. The developed method was optimized and validated in accordance with ICH guidelines and is intended for routine quality control analysis and pharmaceutical research applications.
MATERIALS AND METHODS
Materials
Pharmaceutical-grade reference standards of Mebendazole and Ivermectin were obtained as gift samples from reputed pharmaceutical manufacturers. HPLC-grade acetonitrile and methanol were procured from Merck (India) Ltd. Potassium dihydrogen orthophosphate, orthophosphoric acid, hydrochloric acid, sodium hydroxide, and hydrogen peroxide of analytical reagent grade were used throughout the study. Milli-Q water was employed for the preparation of buffers and mobile phases. Commercial tablet formulations containing Mebendazole (100 mg) and Ivermectin (6 mg) were purchased from the local market and used for assay studies.
Instrumentation
Chromatographic analysis was performed using a Shimadzu Prominence RP-HPLC system equipped with a binary pump (LC-20AD), PDA detector (SPD-M20A), autosampler (SIL-20AC), online degasser (DGU-20A5R), and column oven (CTO-20AC). Data acquisition and processing were carried out using LabSolutions software.
Chromatographic Conditions
Separation was achieved on a Phenomenex Luna C18 column (250 mm × 4.6 mm, 5 µm particle size). The mobile phase consisted of 0.1 M potassium dihydrogen orthophosphate buffer (pH 3.5) and acetonitrile in the ratio of 45:55 (v/v). The mobile phase was filtered through a 0.45 µm membrane filter and degassed before use. Chromatographic analysis was carried out at a flow rate of 1.0 mL/min with isocratic elution. Detection was performed at 245 nm using a PDA detector, while the column temperature was maintained at 30 ± 1°C. The injection volume was 20 µL and the total run time was 10 min.
Preparation of Standard Solutions
Standard stock solutions of Mebendazole and Ivermectin were prepared separately by dissolving accurately weighed 10 mg of each drug in methanol and making the volume up to 10 mL to obtain a concentration of 1000 µg/mL. Appropriate aliquots of the stock solutions were further diluted with mobile phase to obtain mixed working standard solutions in the concentration range of 50–150 µg/mL for Mebendazole and 3–9 µg/mL for Ivermectin.
Preparation of Sample Solution
Twenty tablets were accurately weighed and finely powdered. An amount equivalent to 100 mg of Mebendazole and 6 mg of Ivermectin was transferred to a 100 mL volumetric flask, extracted with methanol by sonication for 20 min, and diluted to volume. The resulting solution was filtered and further diluted with mobile phase to obtain concentrations within the analytical range. Prior to injection, all sample solutions were passed through a 0.45 µm syringe filter.
Method Validation
The developed RP-HPLC method was validated according to ICH Q2 guidelines for system suitability, specificity, linearity, accuracy, precision, robustness, limit of detection (LOD), and limit of quantification (LOQ).
System Suitability: Six replicate injections of the mixed standard solution were analyzed and evaluated for retention time, theoretical plates, tailing factor, resolution, and %RSD.
Specificity: Blank, placebo, standard, sample, and degraded sample solutions were analyzed to assess potential interference at the retention times of Mebendazole and Ivermectin.
Linearity: Calibration curves were constructed over the concentration range of 50–150 µg/mL for Mebendazole and 3–9 µg/mL for Ivermectin. Regression analysis was performed to determine correlation coefficients.
Accuracy: Recovery studies were carried out by the standard addition method at 50%, 100%, and 150% concentration levels, and percentage recoveries were calculated.
Precision: Repeatability and intermediate precision studies were performed and expressed as percentage relative standard deviation (%RSD).
Robustness: The robustness of the method was evaluated by introducing small deliberate changes in chromatographic parameters, including flow rate (±0.1 mL/min), mobile phase composition (±2%), pH (±0.2), wavelength (±2 nm), and column temperature (±2°C).
LOD and LOQ: Sensitivity parameters were determined using the equations LOD = 3.3σ/S and LOQ = 10σ/S, where σ represents the standard deviation of the response and S is the slope of the calibration curve.
RESULTS AND DISCUSSION
3.1 Method Development and Optimization
The present study was undertaken to develop a simple, rapid, accurate, precise, robust, and stability-indicating RP-HPLC method for the simultaneous estimation of Mebendazole (MBZ) and Ivermectin (IVM) in pharmaceutical dosage forms. Method development was carried out by systematically optimizing chromatographic variables including detection wavelength, stationary phase, mobile phase composition, pH, flow rate, column temperature, and injection volume. The objective was to achieve satisfactory resolution, acceptable retention time, symmetrical peak shape, and reproducible chromatographic performance.
3.1.1 Selection of Detection Wavelength
Individual standard solutions of Mebendazole and Ivermectin were scanned in the UV region between 200 and 400 nm. The overlay spectra revealed that both analytes exhibited significant absorbance at 245 nm, making it suitable for simultaneous determination. The selected wavelength provided adequate detector response with minimal baseline noise and excellent sensitivity for both drugs.
Table 1. UV Absorption Characteristics of Mebendazole and Ivermectin
|
Parameter |
Mebendazole |
Ivermectin |
|
Scanning Range |
200–400 nm |
200–400 nm |
|
λmax (nm) |
245 |
245 |
|
Selected Detection Wavelength |
245 nm |
245 nm |
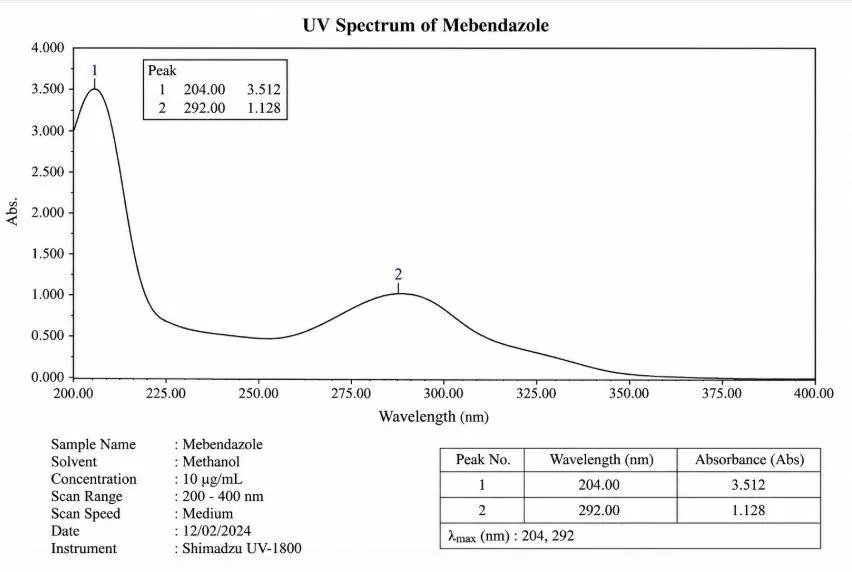
Figure 1. UV Spectrum of Mebendazole
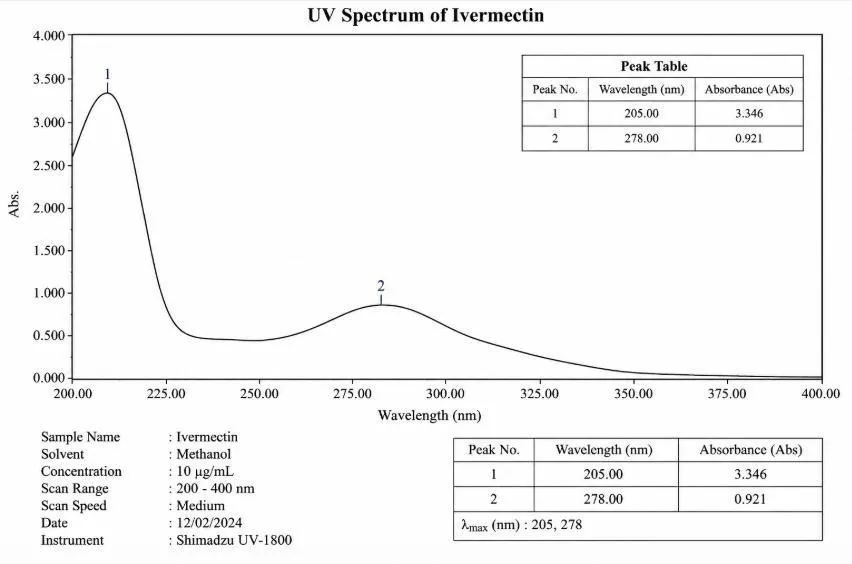
Figure 2. UV Spectrum of Ivermectin
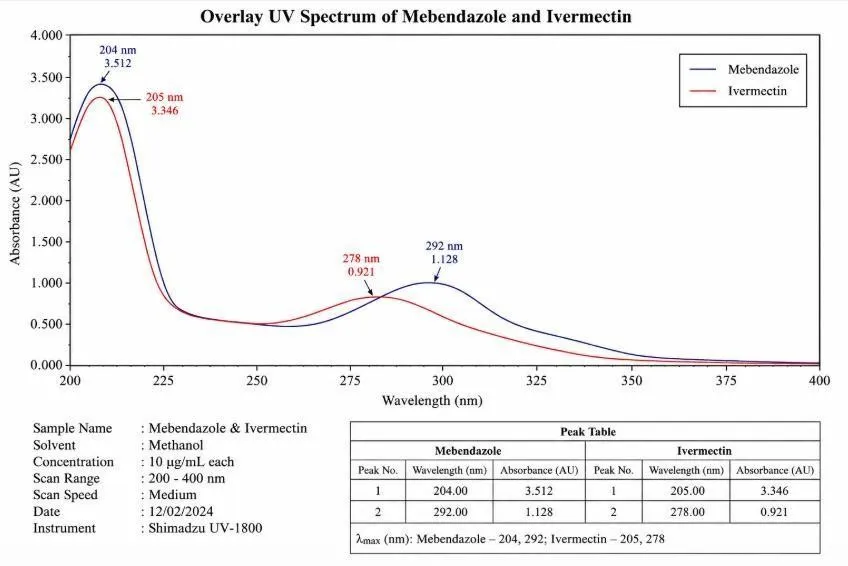
Figure 3. Overlay UV Spectrum of Mebendazole and Ivermectin
The common wavelength of 245 nm was therefore selected for all subsequent chromatographic studies because it ensured simultaneous detection of both analytes with satisfactory sensitivity.
3.1.2 Optimization of Chromatographic Conditions
Several chromatographic trials were performed using different mobile phase compositions and chromatographic conditions to obtain optimum separation between Mebendazole and Ivermectin. Different combinations of methanol, acetonitrile, water, phosphate buffer, and acetate buffer were evaluated. The effects of pH and solvent ratio on peak shape, retention behavior, and resolution were also investigated.
Table 2. Chromatographic Trials Performed During Method Development
|
Trial No. |
Mobile Phase Composition |
pH |
Observation |
|
T1 |
Water : Methanol (50:50) |
— |
Broad peaks, poor resolution |
|
T2 |
Phosphate Buffer : Methanol (40:60) |
4.5 |
Peak tailing observed |
|
T3 |
Acetate Buffer : Acetonitrile (50:50) |
5.0 |
Unsatisfactory separation |
|
T4 |
Phosphate Buffer : Acetonitrile (50:50) |
3.5 |
Moderate resolution |
|
T5 |
Phosphate Buffer : Acetonitrile (45:55) |
3.5 |
Excellent separation and peak symmetry |
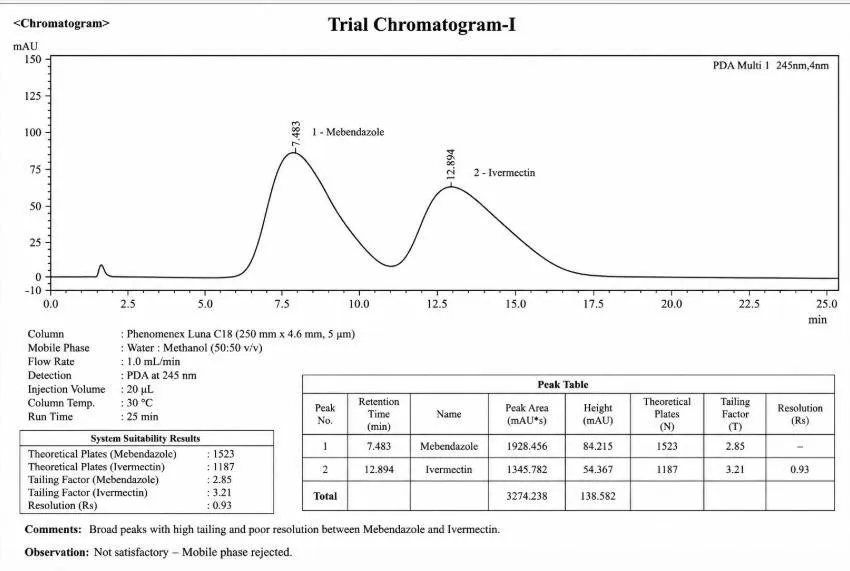
Figure 4. Trial Chromatogram-I
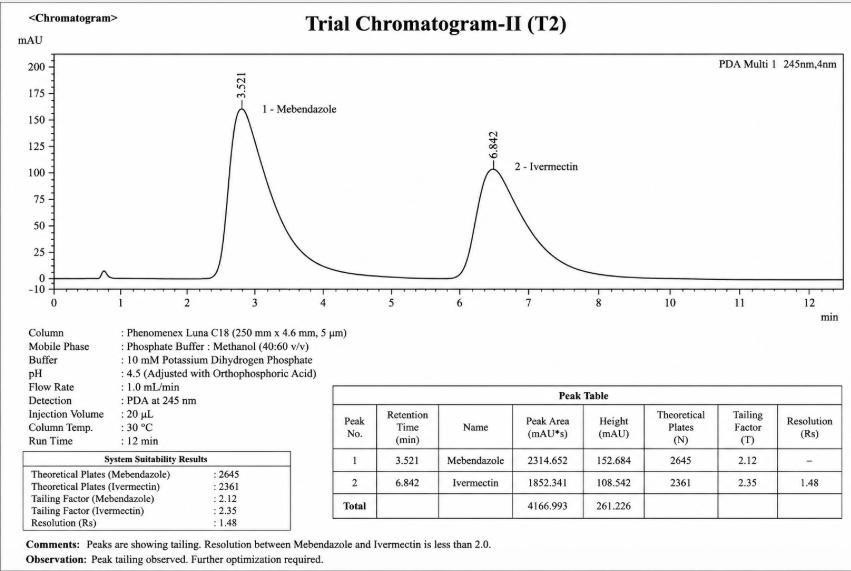
Figure 5. Trial Chromatogram-II
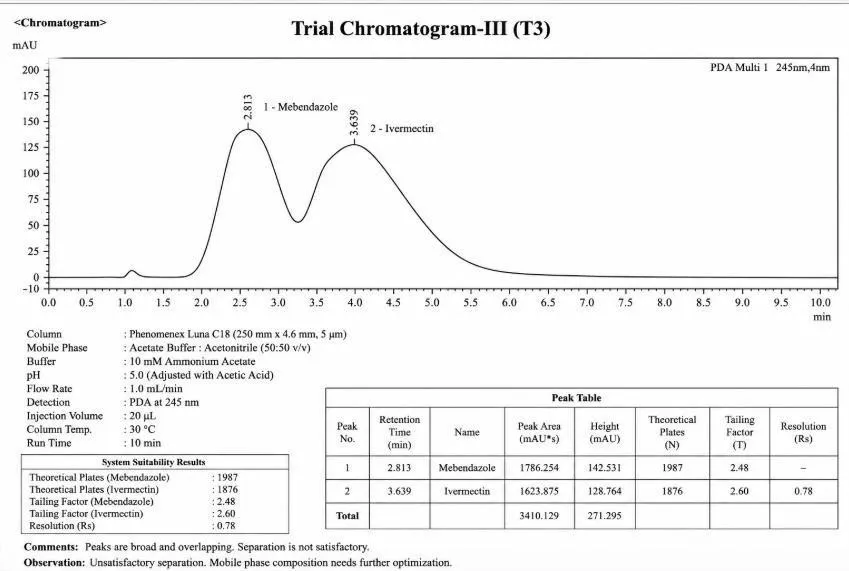
Figure 6. Trial Chromatogram-III
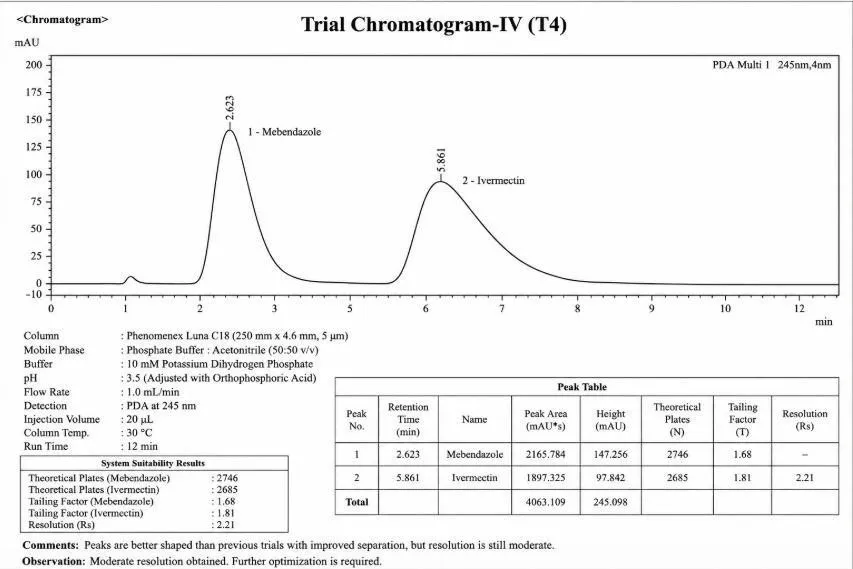
Figure 7. Trial Chromatogram-IV
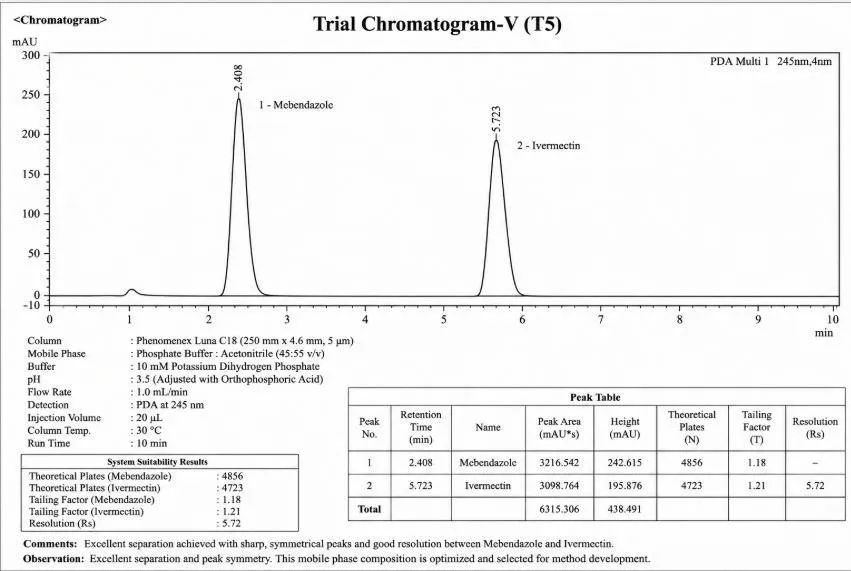
Figure 8. Trial Chromatogram-V
Among all the chromatographic conditions evaluated, the mobile phase consisting of 0.1 M potassium dihydrogen orthophosphate buffer (pH 3.5) and acetonitrile in the ratio of 45:55 (% v/v) produced sharp, symmetrical, and well-resolved peaks. The selected mobile phase demonstrated excellent reproducibility and satisfactory chromatographic performance.
The influence of flow rate was studied between 0.8 and 1.2 mL/min. A flow rate of 1.0 mL/min provided optimum resolution and acceptable retention times. Similarly, a column temperature of 30°C and an injection volume of 20 µL resulted in improved peak shape and detector response.
Table 3. Optimized Chromatographic Conditions
|
Parameter |
Optimized Condition |
|
Column |
Phenomenex Luna C18 (250 × 4.6 mm, 5 µm) |
|
Mobile Phase |
0.1 M KH₂PO₄ Buffer : Acetonitrile |
|
Mobile Phase Ratio |
45:55 (% v/v) |
|
pH |
3.5 ± 0.05 |
|
Flow Rate |
1.0 mL/min |
|
Detection Wavelength |
245 nm |
|
Injection Volume |
20 µL |
|
Column Temperature |
30 ± 1°C |
|
Run Time |
10 min |
|
Elution Mode |
Isocratic |
Under the optimized chromatographic conditions, Mebendazole and Ivermectin were eluted at retention times of 4.12 min and 6.85 min, respectively. Both analytes exhibited symmetrical peaks with excellent baseline separation. The resolution value obtained between the peaks was 3.82, indicating complete separation. Furthermore, theoretical plate counts exceeding 4500 demonstrated high column efficiency and satisfactory chromatographic performance.
3.2 System Suitability Studies
System suitability testing was performed to verify the adequacy and reproducibility of the chromatographic system before sample analysis. Six replicate injections of the mixed standard solution containing Mebendazole and Ivermectin were analyzed under optimized chromatographic conditions.
The evaluated parameters included retention time, theoretical plates, tailing factor, resolution, and percentage relative standard deviation (%RSD) of peak area.
Table 4. System Suitability Parameters
|
Parameter |
Mebendazole |
Ivermectin |
Acceptance Criteria |
|
Retention Time (min) |
4.12 ± 0.02 |
6.85 ± 0.03 |
Consistent |
|
Theoretical Plates |
4820 ± 45 |
5210 ± 52 |
>2000 |
|
Tailing Factor |
1.12 ± 0.03 |
1.08 ± 0.02 |
<2.0 |
|
Resolution |
— |
3.82 ± 0.08 |
>2.0 |
|
%RSD of Peak Area |
0.45 |
0.52 |
<2.0 |
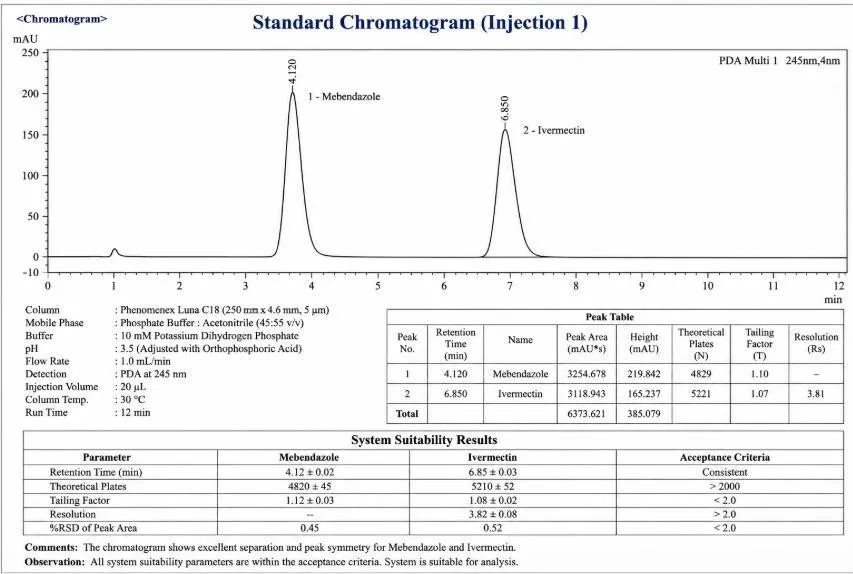
Figure 9. Standard Chromatogram (Injection 1)
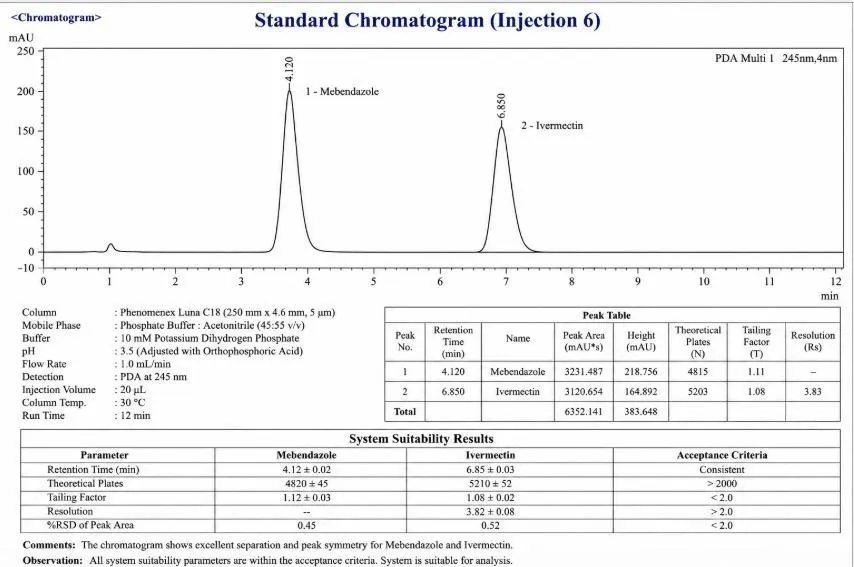
Figure 10. Standard Chromatogram (Injection 6)
The system suitability results confirmed excellent chromatographic reproducibility. Retention times remained highly consistent throughout the study, indicating stable chromatographic performance. Theoretical plate counts were significantly higher than the minimum acceptable limit, demonstrating efficient column performance. Tailing factor values close to unity indicated symmetrical peak shapes and absence of peak distortion. Resolution between Mebendazole and Ivermectin was greater than 2.0, confirming complete baseline separation. Additionally, %RSD values for peak area were below 1%, demonstrating excellent system precision and repeatability.
3.3 Specificity
Specificity is an important validation parameter that demonstrates the ability of the analytical method to accurately quantify analytes in the presence of excipients, impurities, degradation products, and other potential interfering substances. Specificity was evaluated by analysing blank, placebo, standard, and sample solutions under optimized chromatographic conditions. Chromatograms were examined for any interference at the retention times corresponding to Mebendazole and Ivermectin.
Table 5. Specificity Results
|
Sample |
Observation |
|
Blank |
No interference |
|
Placebo |
No interference |
|
Standard |
Pure and symmetrical peaks |
|
Sample |
No interfering peaks |
|
Degraded Samples |
Complete separation of degradants |
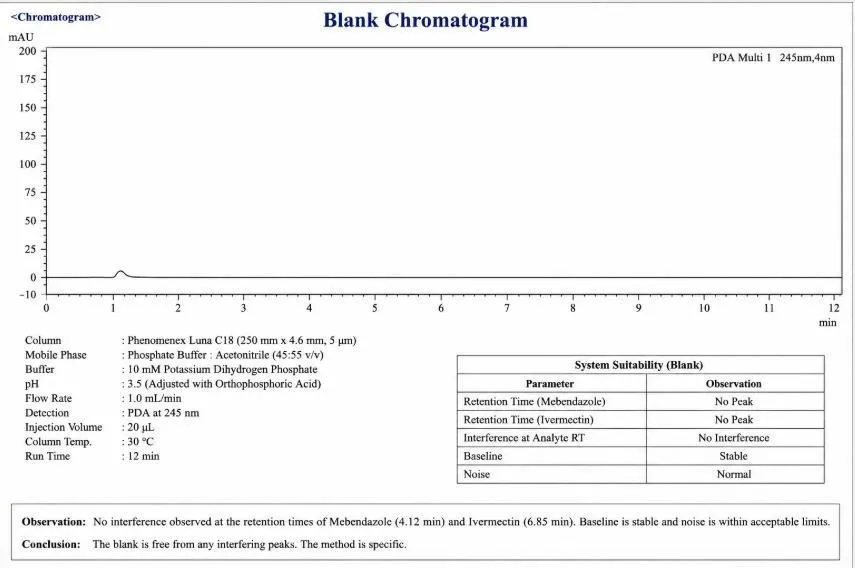
Figure 11. Blank Chromatogram
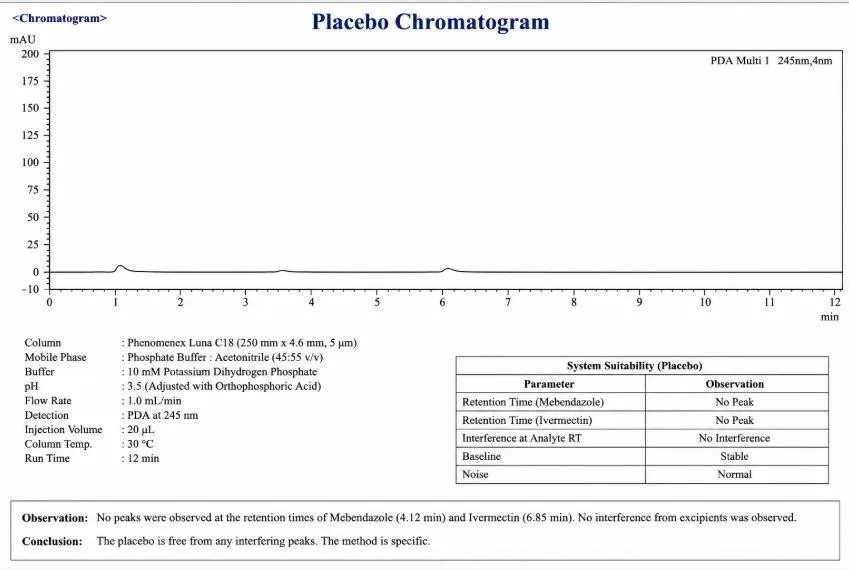
Figure 12. Placebo Chromatogram

Figure 13. Standard Chromatogram
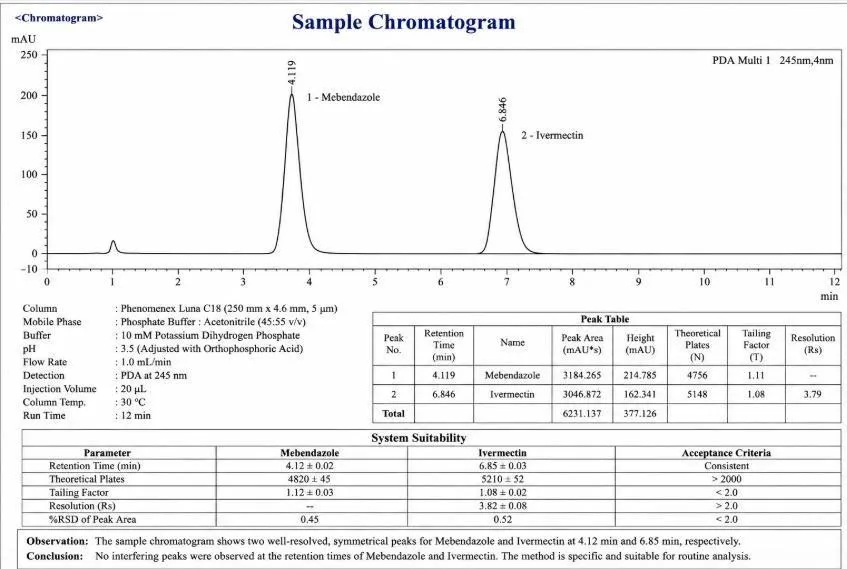
Figure 14. Sample Chromatogram

Figure 15. Peak Purity Plot of Mebendazole
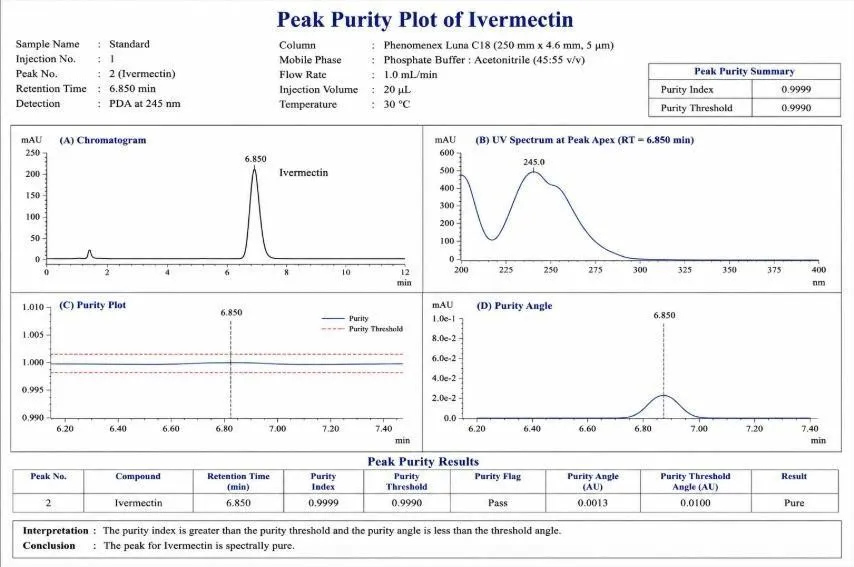
Figure 16. Peak Purity Plot of Ivermectin
No interfering peaks were observed in blank and placebo chromatograms at the retention times of either analyte. Peak purity analysis using PDA detection further confirmed the homogeneity of both chromatographic peaks, with purity indices approaching unity. The complete separation of degradation products from the parent drug peaks demonstrated the stability-indicating nature of the developed RP-HPLC method. These findings confirmed that the method was highly specific and suitable for routine pharmaceutical analysis.
3.4 Linearity and Range
The linearity of the developed RP-HPLC method was evaluated over the concentration range of 50–150 µg/mL for Mebendazole and 3–9 µg/mL for Ivermectin. Each concentration level was analyzed in triplicate and the mean peak area was recorded. Calibration curves were constructed by plotting concentration versus peak area.
Table 6. Linearity Data of Mebendazole and Ivermectin
|
Concentration (µg/mL) |
Mebendazole Peak Area (Mean ± SD) |
Ivermectin Peak Area (Mean ± SD) |
|
50 / 3.0 |
1,052,346 ± 4,821 |
205,678 ± 1,856 |
|
75 / 4.5 |
1,514,872 ± 5,932 |
305,421 ± 2,134 |
|
100 / 6.0 |
1,978,945 ± 6,845 |
406,783 ± 2,987 |
|
125 / 7.5 |
2,441,238 ± 7,912 |
507,892 ± 3,456 |
|
150 / 9.0 |
2,905,674 ± 8,765 |
609,345 ± 4,128 |
Table 7. Regression Analysis Data
|
Parameter |
Mebendazole |
Ivermectin |
|
Regression Equation |
y = 18542x + 12456 |
y = 67284x + 3284 |
|
Correlation Coefficient (R²) |
0.9997 |
0.9998 |
|
Linearity Range |
50–150 µg/mL |
3–9 µg/mL |
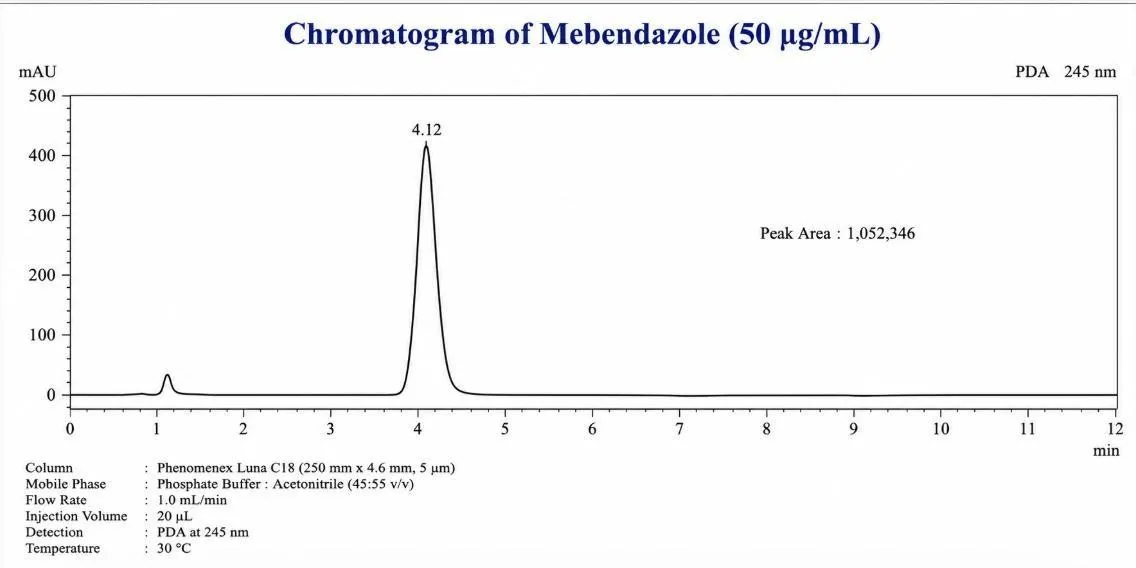
Figure 17. Chromatogram of Mebendazole (50 µg/mL)
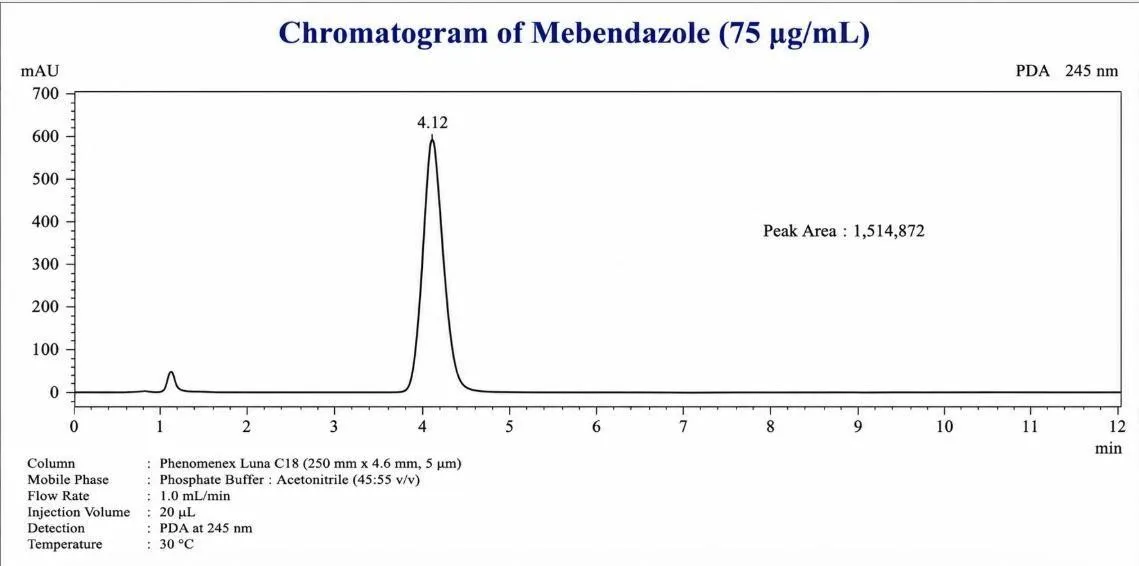
Figure 18. Chromatogram of Mebendazole (75 µg/mL)
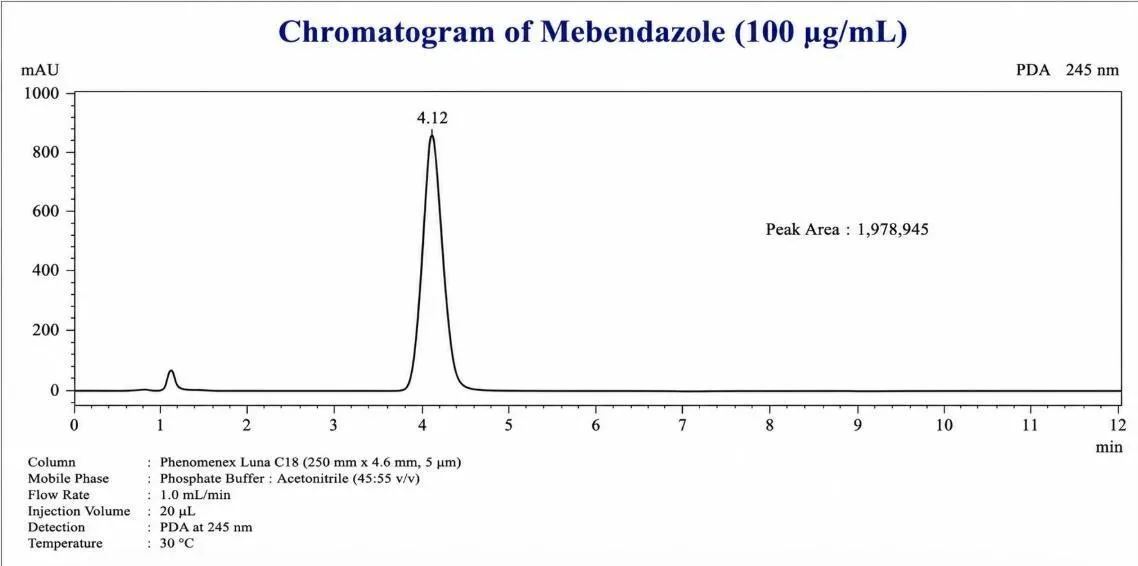
Figure 19. Chromatogram of Mebendazole (100 µg/mL)
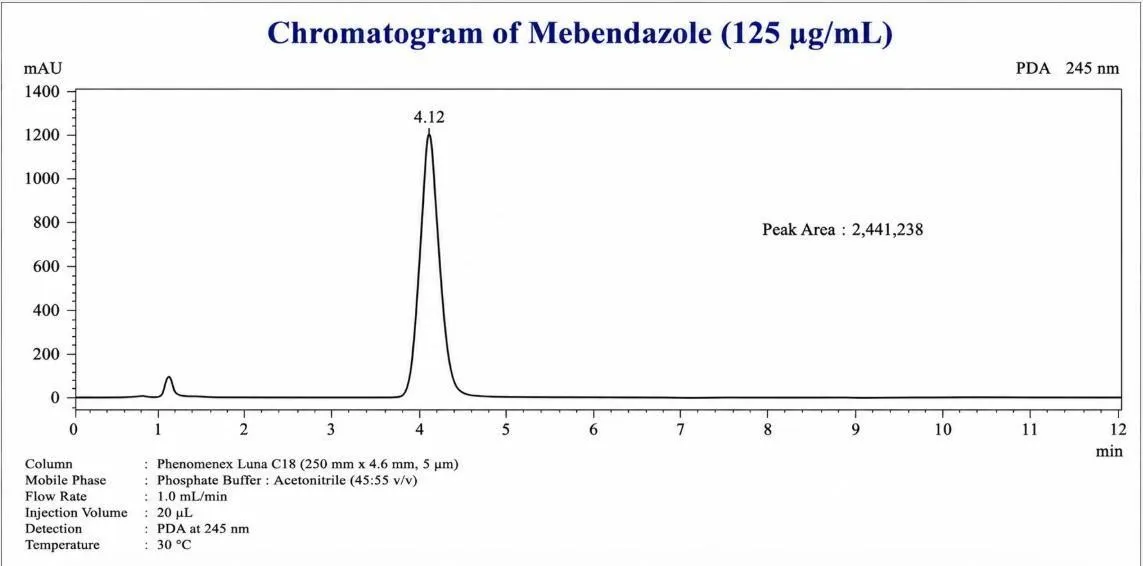
Figure 20. Chromatogram of Mebendazole (125 µg/mL)
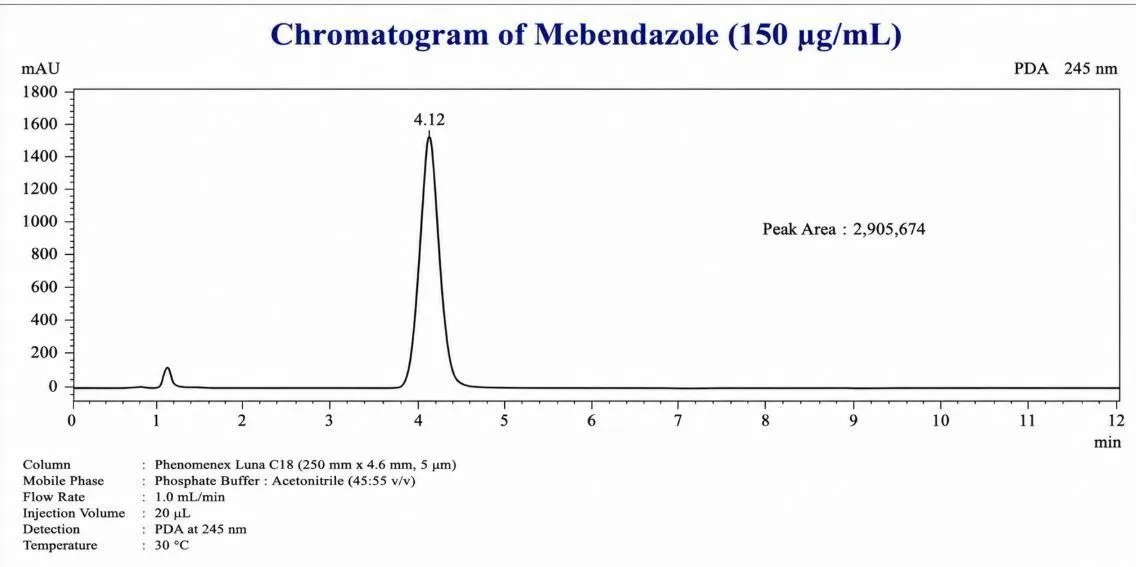
Figure 21. Chromatogram of Mebendazole (150 µg/mL)
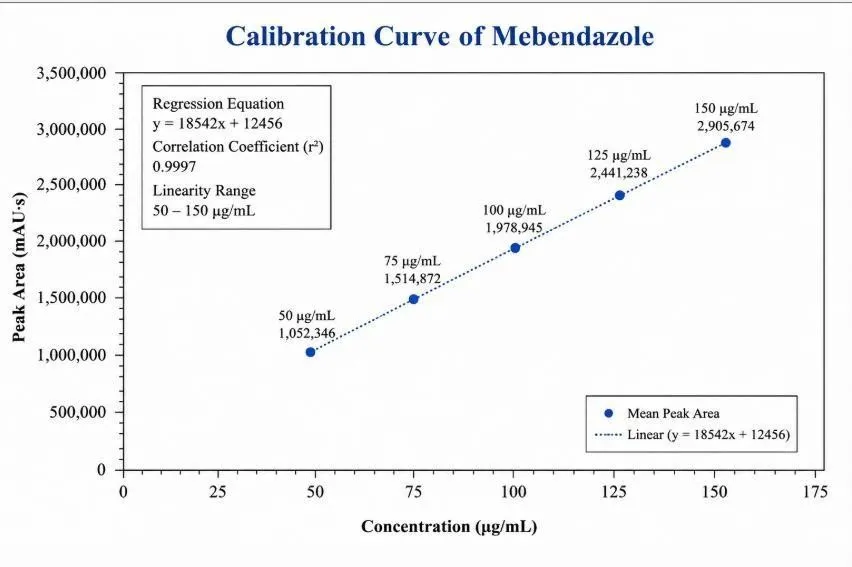
Figure 22. Calibration Curve of Mebendazole

Figure 23. Chromatogram of Ivermectin (3 µg/mL)
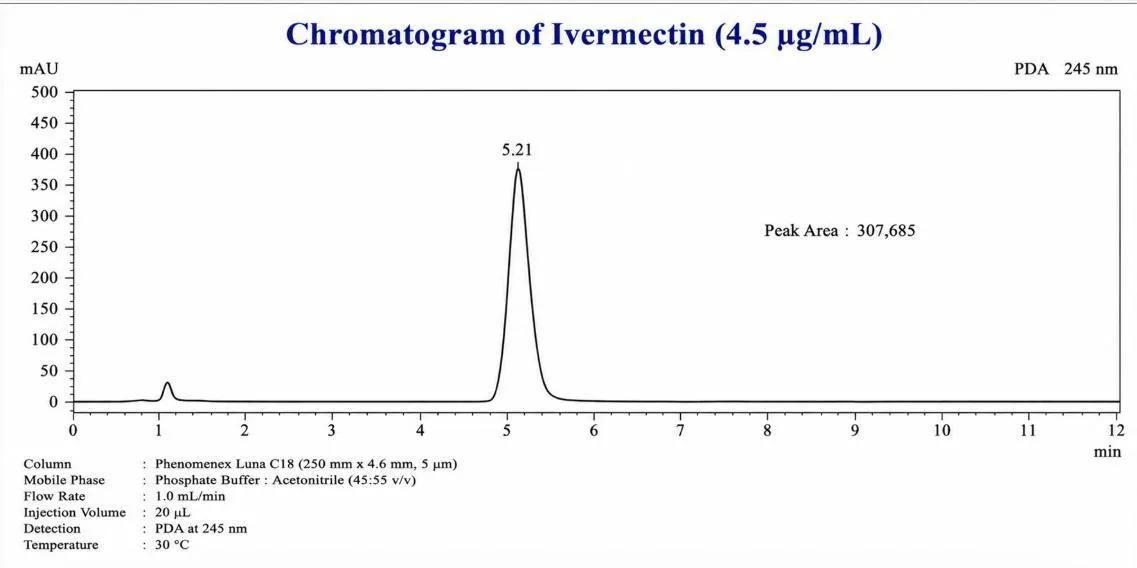
Figure 24. Chromatogram of Ivermectin (4.5 µg/mL)
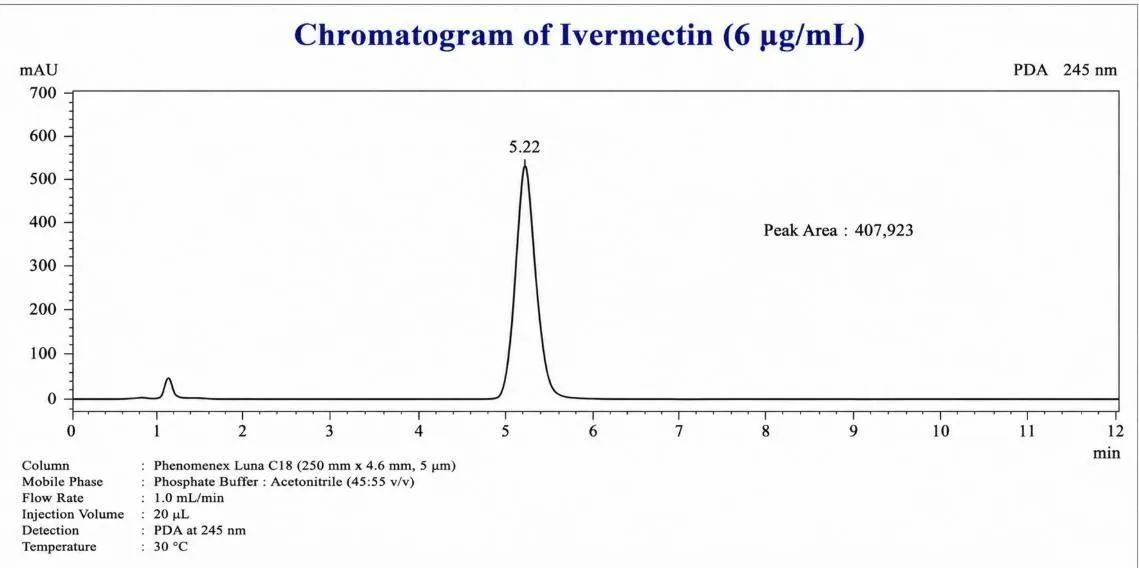
Figure 25. Chromatogram of Ivermectin (6 µg/mL)
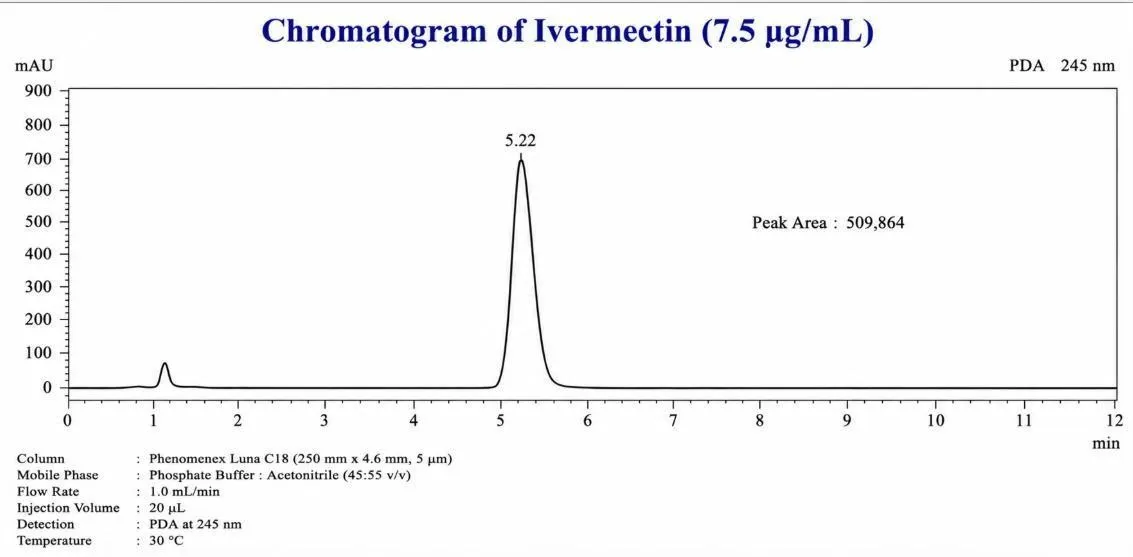
Figure 26. Chromatogram of Ivermectin (7.5 µg/mL)
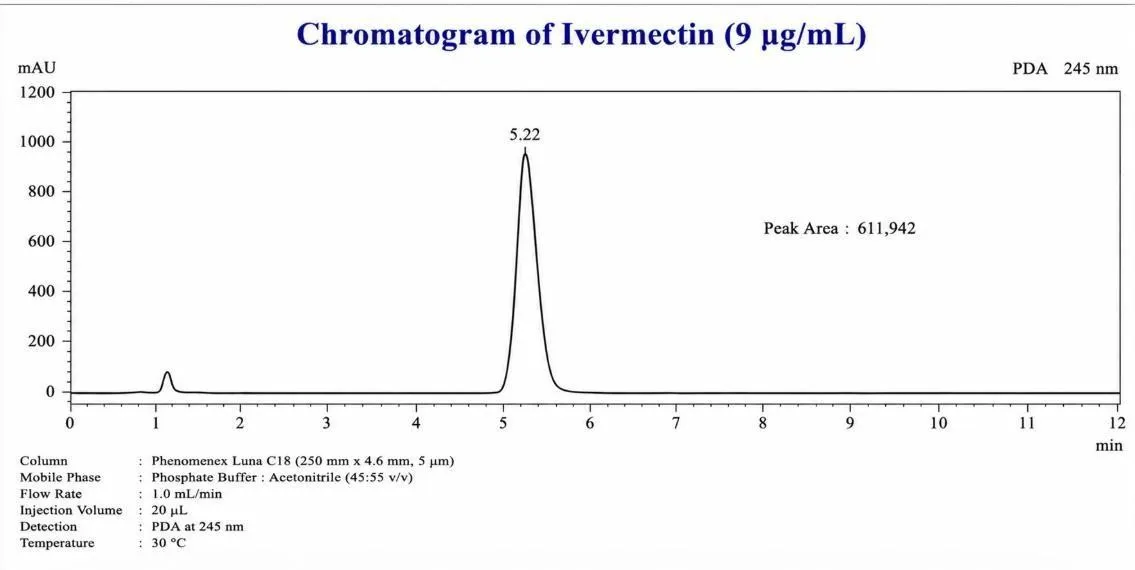
Figure 27. Chromatogram of Ivermectin (9 µg/mL)
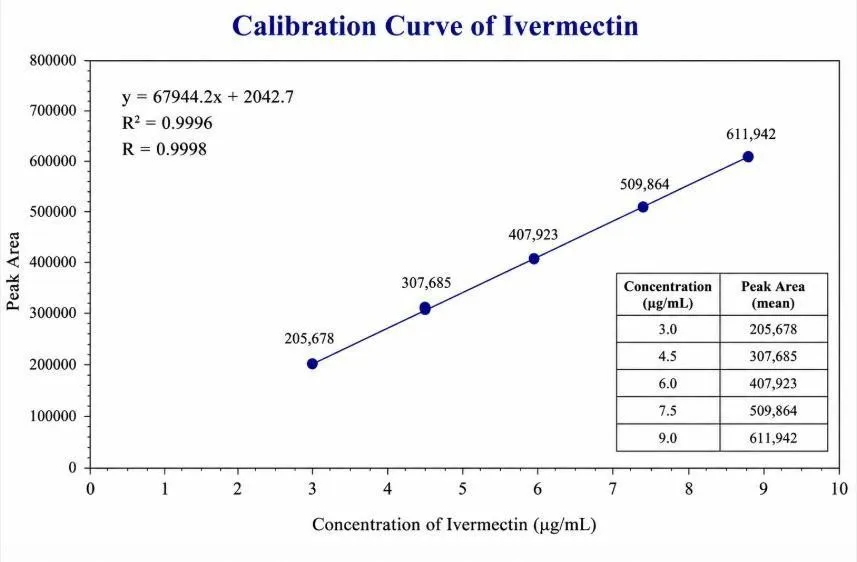
Figure 28. Calibration Curve of Ivermectin
The calibration curves demonstrated excellent linearity over the investigated concentration ranges. Correlation coefficient values of 0.9997 for Mebendazole and 0.9998 for Ivermectin indicated a strong linear relationship between analyte concentration and detector response. The low intercept values and excellent regression statistics further confirmed the reliability and suitability of the method for quantitative analysis.
3.5 Accuracy
The accuracy of the developed RP-HPLC method was evaluated using the recovery method at three concentration levels corresponding to 50%, 100%, and 150% of the target concentration. Known quantities of Mebendazole and Ivermectin reference standards were added to pre-analyzed sample solutions and analyzed in triplicate. The percentage recovery and %RSD values were calculated to assess the accuracy of the method.
Table 8. Accuracy (Recovery) Results
|
Level |
Mebendazole Recovery (%) ± SD |
%RSD |
Ivermectin Recovery (%) ± SD |
%RSD |
|
50% |
99.45 ± 0.68 |
0.68 |
99.72 ± 0.75 |
0.75 |
|
100% |
100.12 ± 0.52 |
0.52 |
100.35 ± 0.61 |
0.61 |
|
150% |
99.85 ± 0.81 |
0.81 |
99.68 ± 0.92 |
0.92 |
|
Mean |
99.81 ± 0.67 |
— |
99.92 ± 0.76 |
— |
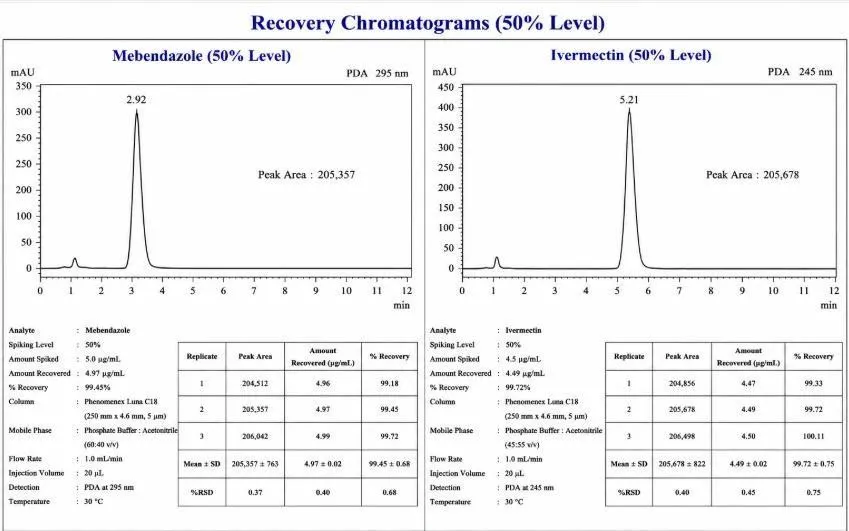
Figure 29. Recovery Chromatogram at 50% Level
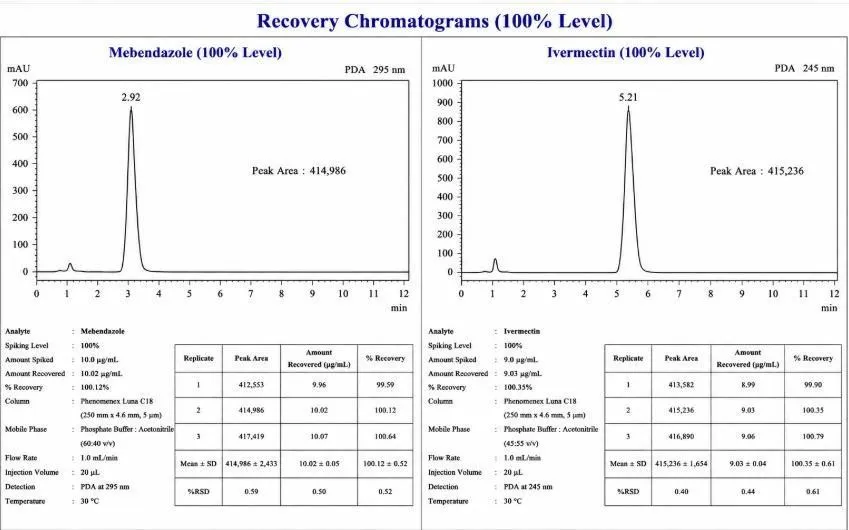
Figure 30. Recovery Chromatogram at 100% Level
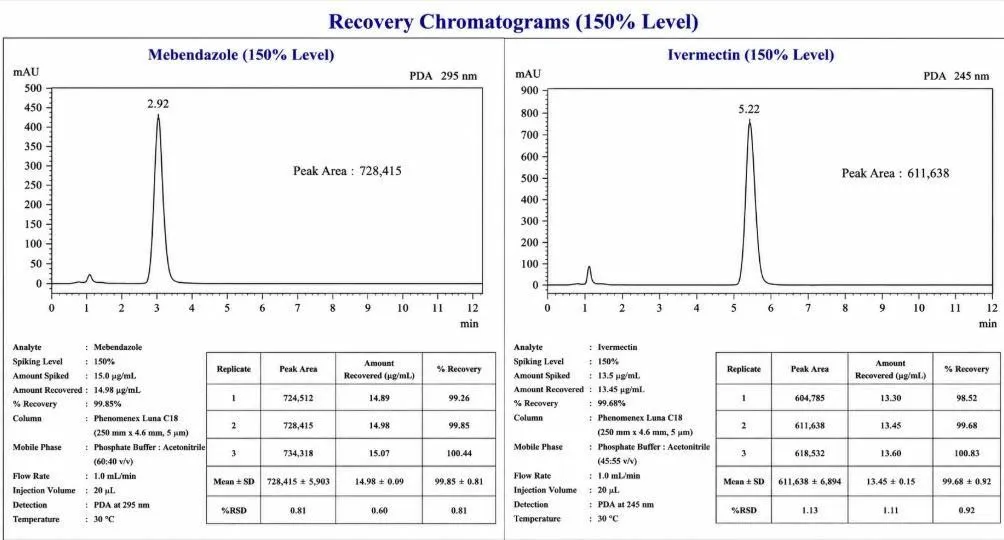
Figure 31. Recovery Chromatogram at 150% Level
The percentage recoveries obtained for Mebendazole and Ivermectin were found to be within the acceptable range of 98–102%, indicating excellent agreement between the measured and true values. The low %RSD values observed at all concentration levels confirmed the reproducibility of the recovery results. These findings demonstrate that the developed method possesses high accuracy and is free from interference arising from formulation excipients.
3.6 Precision
Precision studies were performed to evaluate the repeatability and intermediate precision of the developed analytical method. Repeatability (intra-day precision) was assessed by analyzing multiple injections on the same day, whereas intermediate precision (inter-day precision) was evaluated on different days under similar experimental conditions.
Table 9. Precision Results
|
Concentration Level |
Intra-day Precision (%RSD) MBZ |
Intra-day Precision (%RSD) IVM |
Inter-day Precision (%RSD) MBZ |
Inter-day Precision (%RSD) IVM |
|
Low |
0.45 |
0.52 |
0.78 |
0.85 |
|
Medium |
0.62 |
0.71 |
0.95 |
1.02 |
|
High |
0.88 |
0.94 |
1.18 |
1.27 |
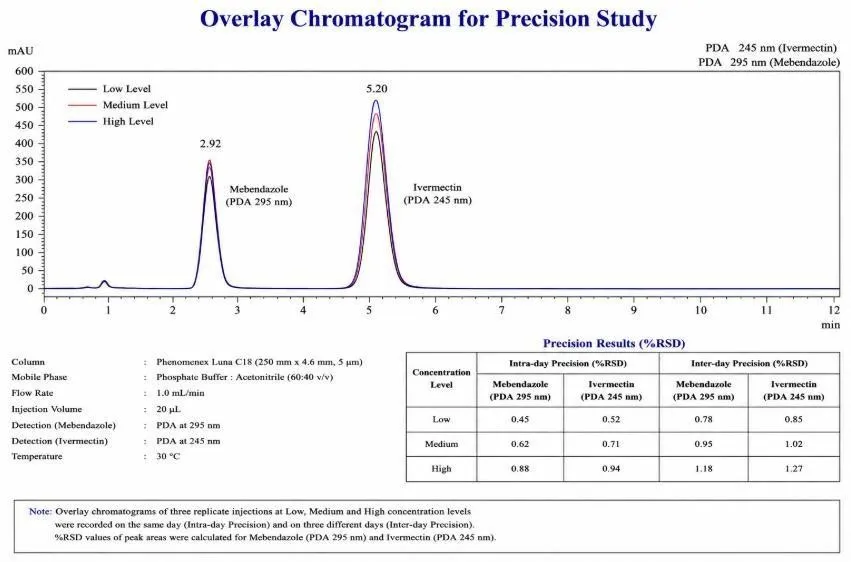
Figure 32. Overlay Chromatogram for Precision Study
All %RSD values obtained during repeatability and intermediate precision studies were less than 2.0%, satisfying the acceptance criteria recommended by ICH guidelines. The low variability observed among replicate measurements confirmed the excellent precision, consistency, and reproducibility of the developed RP-HPLC method during routine analysis.
3.7 Robustness
The robustness of the method was evaluated by introducing deliberate but minor variations in chromatographic conditions and examining their influence on chromatographic performance. Parameters including flow rate, mobile phase composition, buffer pH, detection wavelength, and column temperature were varied within a small range.
Table 10. Robustness Results
|
Parameter Changed |
Variation |
Resolution |
Tailing Factor (MBZ) |
%RSD Peak Area |
|
Flow Rate |
0.9 / 1.1 mL/min |
3.75–3.91 |
1.09–1.14 |
0.68 |
|
Mobile Phase Composition |
±2% |
3.68–3.95 |
1.08–1.16 |
0.82 |
|
Buffer pH |
3.3 / 3.7 |
3.72–3.88 |
1.10–1.13 |
0.75 |
|
Wavelength |
243 / 247 nm |
3.79–3.84 |
1.11–1.12 |
0.65 |
|
Temperature |
28 / 32°C |
3.76–3.89 |
1.09–1.15 |
0.71 |
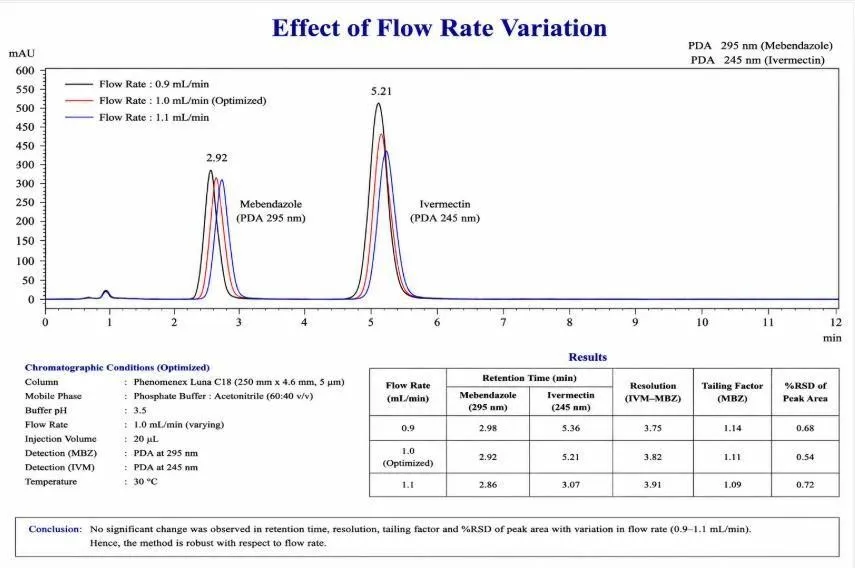
Figure 33. Effect of Flow Rate Variation
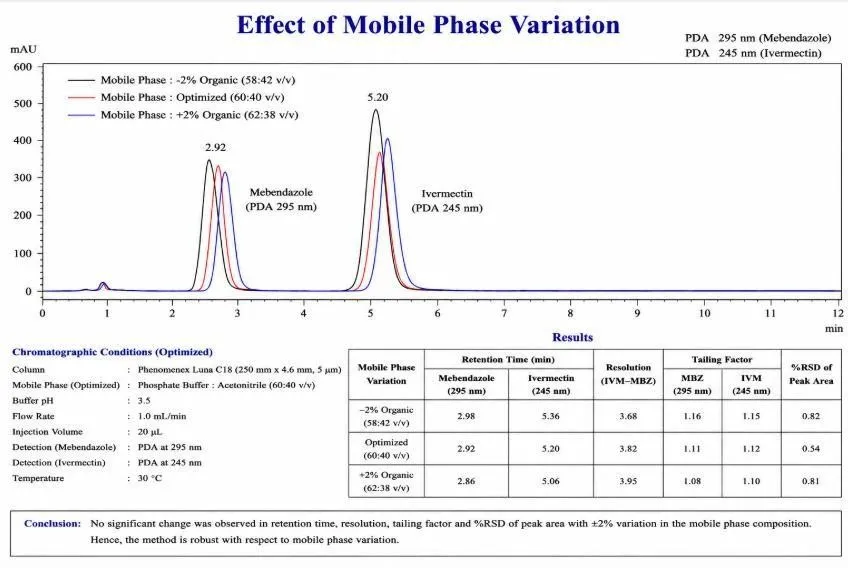
Figure 34. Effect of Mobile Phase Variation
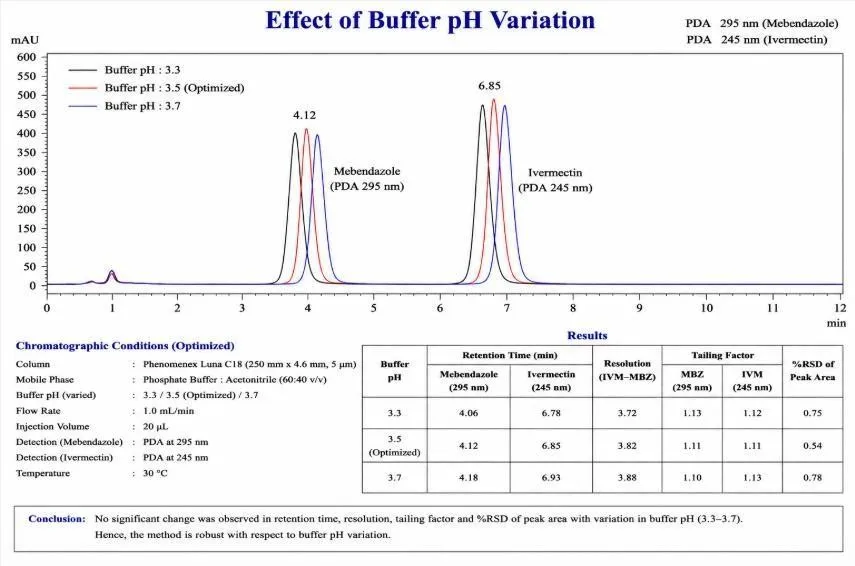
Figure 35. Effect of Buffer pH Variation
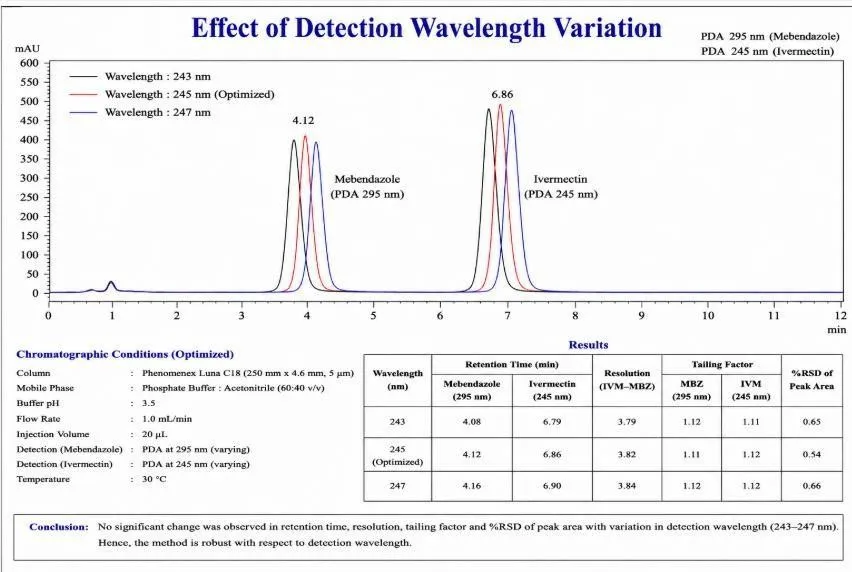
Figure 36. Effect of Detection Wavelength Variation
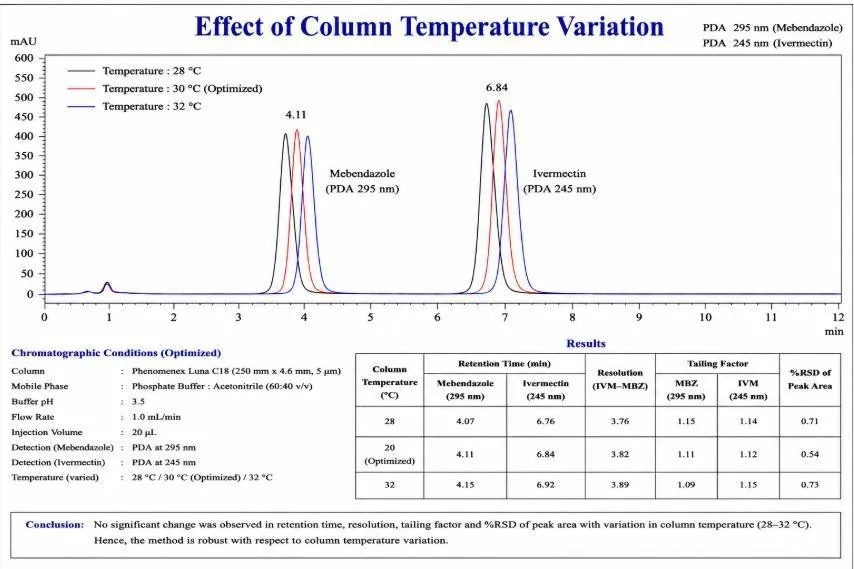
Figure 37. Effect of Column Temperature Variation
The deliberate changes introduced into chromatographic conditions did not significantly affect peak shape, retention behavior, resolution, or precision. Resolution values remained greater than 2.0 and %RSD values remained below 2.0% under all conditions investigated. These results confirmed the robustness and reliability of the method and demonstrated its suitability for routine quality control analysis.
3.8 Limit of Detection (LOD) and Limit of Quantification (LOQ)
The sensitivity of the developed RP-HPLC method was assessed by determining the limit of detection (LOD) and limit of quantification (LOQ) according to ICH recommendations. These parameters were calculated using the standard deviation of the response and the slope of the calibration curve.
Table 11. LOD and LOQ Values
|
Parameter |
Mebendazole |
Ivermectin |
|
LOD (µg/mL) |
0.28 |
0.09 |
|
LOQ (µg/mL) |
0.85 |
0.27 |
|
Signal-to-Noise Ratio at LOQ |
10.8 |
11.2 |
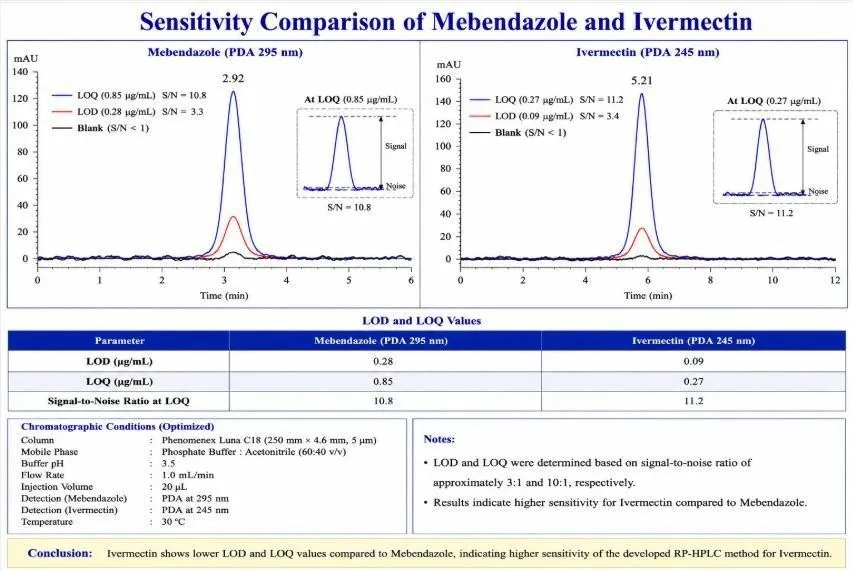
Figure 38. Sensitivity Comparison of Mebendazole and Ivermectin
The low LOD and LOQ values obtained for both analytes demonstrated the high sensitivity of the developed analytical method. The method was capable of detecting and quantifying very low concentrations of Mebendazole and Ivermectin with acceptable accuracy and precision. Such sensitivity makes the method suitable for routine quality control testing and stability studies.
3.9 Overall Discussion
The present investigation successfully established a simple, accurate, precise, robust, and stability-indicating RP-HPLC method for the simultaneous estimation of Mebendazole and Ivermectin in pharmaceutical dosage forms. Systematic optimization of chromatographic variables resulted in excellent chromatographic performance, with Mebendazole and Ivermectin eluting at retention times of 4.12 min and 6.85 min, respectively. Complete baseline separation was achieved with a resolution value greater than 3.8, demonstrating efficient chromatographic separation.
System suitability studies confirmed the adequacy and reproducibility of the chromatographic system, with theoretical plate counts exceeding 4500 and %RSD values below 1.0%. Validation studies performed according to ICH guidelines demonstrated excellent specificity, linearity, accuracy, precision, robustness, and sensitivity. The developed method exhibited outstanding linearity over the investigated concentration ranges with correlation coefficients greater than 0.999 for both analytes.
Accuracy studies produced recoveries close to 100%, while precision studies demonstrated excellent repeatability and intermediate precision with %RSD values well below the acceptable limit of 2.0%. Robustness testing further confirmed that minor variations in chromatographic conditions did not significantly influence analytical performance. The low LOD and LOQ values highlighted the high sensitivity of the method and its capability to detect trace quantities of the analytes.
The absence of interference from excipients and the excellent peak purity results confirmed the specificity and selectivity of the method. Overall, the developed RP-HPLC method fulfilled all validation requirements and can be successfully employed for routine quality control analysis, method validation studies, and pharmaceutical research involving simultaneous estimation of Mebendazole and Ivermectin in combined dosage forms.
CONCLUSION
The present study successfully developed and validated a simple, rapid, accurate, precise, robust, and stability-indicating RP-HPLC method for the simultaneous estimation of Mebendazole and Ivermectin in pharmaceutical dosage forms. Systematic optimization of chromatographic parameters resulted in efficient separation of both analytes using a Phenomenex Luna C18 column with a mobile phase consisting of 0.1 M potassium dihydrogen orthophosphate buffer (pH 3.5) and acetonitrile (45:55, v/v). Under the optimized chromatographic conditions, Mebendazole and Ivermectin were eluted at retention times of 4.12 min and 6.85 min, respectively, with excellent peak symmetry and satisfactory resolution.
The developed method was validated in accordance with ICH Q2 guidelines and demonstrated excellent performance with respect to system suitability, specificity, linearity, accuracy, precision, robustness, limit of detection, and limit of quantification. The calibration curves exhibited outstanding linearity over the investigated concentration ranges, with correlation coefficient values greater than 0.999 for both analytes. Accuracy studies showed mean recoveries of 99.81% for Mebendazole and 99.92% for Ivermectin, while precision studies produced %RSD values below 2.0%, confirming the reliability and reproducibility of the method.
Specificity studies confirmed the absence of interference from excipients and other formulation components, whereas peak purity analysis demonstrated excellent selectivity of the method. Robustness evaluation revealed that minor deliberate variations in chromatographic conditions did not significantly affect analytical performance. Furthermore, the low LOD and LOQ values indicated high sensitivity of the developed method.
Overall, the validated RP-HPLC method proved to be simple, sensitive, economical, and stability-indicating, making it highly suitable for routine quality control analysis, assay determination, stability studies, and pharmaceutical research involving Mebendazole and Ivermectin in combined dosage forms. The developed method can therefore be confidently employed in pharmaceutical industries and quality control laboratories for reliable simultaneous estimation of these antiparasitic drugs.
REFERENCES:



Vaishali Bawankar*, Anup Barsagade, Prachi Mandave, Development & Validation of Stability Indicating RP-HPLC Method for Simultaneous Estimation of Mebendazole and Ivermectin in Pharmaceutical Dosage Form, Int. J. of Pharm. Sci., 2026, Vol 4, Issue 7, 2109-2139. https://doi.org/10.5281/zenodo.21294572
 10.5281/zenodo.21294572