

We use cookies to ensure our website works properly and to personalise your experience. Cookies policy
Shantha College of Pharmacy, Peresandra, Chickballapur (Dist.), Karnataka.
A gastro retentive floating drug delivery system containing Gliclazide was prepared in the form of tablet and evaluated for its processing parameters and in vitro release behaviour. Gliclazide is a selective second-generation sulphonyl urea used in treatment of hyperglycemia and it absorbs rapidly and completely. However, its absorption is erratic in diabetic patient due to its impaired gastric motility or gastric emptying. To overcome these drawbacks, the present investigation was to develop a gastro retentive floating tablets of Gliclazide. Nine formulations consist of retardant materials such as hydroxy propyl methylcellulose K4M, K15M, and K100M. Sodium bicarbonate was used as a gas generating agent to reduce floating lag time and other release promoters. Tablets remained buoyant over 12 hours in the release medium, and the amount of sodium bicarbonate found to be significant for not only to remaining buoyant without causing disintegration of the tablet, but also to release of the drug in the acidic medium. Final F9 optimized formulation released approximately 94% drug in 12 hours in vitro, while the floating lag time was 31 sec and tablet remained floatable throughout all studies. In vitro gastro retentive study of tablets gave successful results by floating in gastric content over a period of 12 hours. The results of the current study clearly indicate, a promising potential of the Gliclazide floating system as an alternative to the conventional dosage form
Oral route is the most convenient and extensively used route for drug administration. This route has high patient acceptability, primarily due to ease of administration. Over the years, oral dosage forms have become increasingly sophisticated with major role being played by controlled release drug delivery systems (CRDDS) release drug at predetermined rate.
Controlled Drug Delivery Systems1,2,3
Controlled drug delivery systems have been developed which are capable of controlling the rate of drug delivery, sustaining the duration of therapeutic activity or targeting the delivery of drug to a tissue.
Controlled drug delivery or modified drug delivery systems are conveniently divided into four categories.
Gastro retentive Drug Delivery Systems
The development of oral CRDDS has been hindered by the inability to localize the system in the selected regions of the GIT. There has been considerable research over the last decade on the possibility of controlled and site-specific delivery to the GIT by controlling the gastro intestinal transit of orally administered dosage forms using Gastro Retentive Drug Delivery Systems (GRDDS). Such GRDDS possess the ability of retaining the drug in GIT particularly in the stomach for long periods.4,5
The idea of gastro retentive systems is to localize the drugs at specific region of GIT such as stomach in the body. Often the extent of drug absorption is limited by the residence time of the drug at absorption site. The transit time in GIT i.e., from the mouth to anus, varies from one person to another. It also depends upon the physical properties of the object ingested and the physiological conditions of the alimentary canal. In addition, the relatively brief G.I. transit time (8-12 hr) for most of the drugs impedes the formulation of once daily dosage form. Many drugs show poor bioavailability (BA) in the presence of intestinal metabolic enzymes like cytochrome P450 (CYP3A), abundantly present in the intestinal epithelium. Their activity decreases longitudinally along the small intestine, with levels rising slightly from the duodenum to the jejunum and declining in the ileum and colon. This non uniform distribution of CYP3A causes regional variability in the absorption of drugs that are the substrates of those enzymes.
The therapeutic window of many drugs is limited by their short circulating half-life and absorption via a defined segment of the intestine. Such pharmacokinetic limitations lead in many cases to frequent dosing of these medications to achieve the required therapeutic effect. This results in "pill burden" and consequently decreased patient compliance. The phenomenon of absorption via a limited part of the GI tract has been termed the "narrow absorption window” once the dosage form passes the absorption window, the drug will be neither bioavailable nor effective. In extreme cases, drugs that are insufficiently absorbed due to narrow absorption cannot be delivered entirely, and are either given by a parental route or the development of Novel Techniques or by GRDDS.6,7,8
A rational approach to enhance bioavailability and improve pharmacokinetic and pharmacodynamic profiles is to retain the drug reservoir above its absorption area, i.e., in the stomach and to release the drug in a controlled manner, so as to achieve a zero-order kinetics (i.e., "oral infusion") for a prolonged period of time. The need for gastro retentive dosage forms (GRDFs) has led to extensive efforts in both academia and industry towards the development of such drug delivery systems. GRDFs extend significantly the period of time over which the drugs may be released.
Various approaches have been pursued to increase the retention of an oral dosage form in the stomach. These systems include: Floating systems, bio adhesive systems, swelling and expanding systems, high density systems. Floating Drug Delivery System (FDDS) has a bulk density lower than gastric fluids and thus remain buoyant in the stomach for a prolonged period of time, without affecting the gastric emptying rate. While the system is floating on the gastric contents, the drug is released slowly at a desired rate from the system. After the release of the drug, the residual system is emptied from the stomach. This, results in an increase in the GRT and a better control of the fluctuations in the plasma drug concentration.9,10
Formulation considerations for GRDDS11,12,13
1) It must show effective retention in the stomach to suit for the clinical demand.
2) It must be convenient for intake to facilitate the patient compliance.
3) It must have sufficient drug loading capacity,
4) It must control the drug release profile,
5) It must have full degradation and evacuation of the system once the drug release is completed.
6) It should not have effect on gastric motility including emptying pattern.
7) It should not have other local adverse effects.
MATERIALS AND METHODS
GLICLAZIDE
Gliclazide is an oral anti-hyperglycaemic agent used for the treatment of non-insulin-dependent diabetes mellitus (NIDDM). It belongs to the sulfonylurea class of insulin secretagogues, which act by stimulating β cells of the pancreas to release insulin. Sulfonylurea increase both basal insulin secretion and meal-stimulated insulin release. Medications in this class differ in their dose, rate of absorption, duration of action, route of elimination and binding site on their target pancreatic β cell receptor.

Fig no. 12: Structure of Glyclazide
Systemic (IUPAC) name:
(N-[[(Hexahydrocyclopenta[c]pyrol-2(1H) yl)amino]carbonyl]-4-methyl benzene sulphonamide)
Formula : C15H21N3O3S
Molecular weight : 323.412g/mol
Table No.1: Pharmacokinetic data
|
Bioavailability |
Rapidly absorbed in man. Bioavailability is low and variable (approximately 5%) due to extensive first pass metabolism |
|
Metabolism |
Metabolized hepatically, primarily by oxidation by cytochrome P450 3A4 producing several hydroxylated derivatives and a pharmacologically active metabolite, 1-pyrimidinylpiperazine (1-PP). |
|
Protein Binding |
94% (approximately 70% bound to albumin, 30 % bound to alpha 1 -acid glycoprotein) |
|
Half- Life |
2-3 hours (although the action of a single dose is longer than the short half-life indicates much). |
|
Elimination route |
Metabolites and conjugates are eliminated primarily by the kidneys (60-70%) and also in the feces (10-20%). |
|
Routes |
Oral |
Table No. 3: List of materials used in the study
|
SNO |
INGREDIENTS |
SUPPLIER |
|
|
Gliclazide |
Yarrow Chem Products, Mumbai |
|
|
Hydroxy Propyl Methyl Cellulose |
Colorcon, Goa
|
|
|
Avicel PH102(MCC) |
FMC Bio Polymers, Mumbai |
|
|
Sodium Bicarbonate |
SD Fine Chemicals, Mumbai
|
|
|
Magnesium Stearate |
Evonik, Mumbai
|
|
|
Talc |
SD Fine Chemicals, Mumbai |
Table No.4: List of equipment used for the study
|
S. No. |
Name of the equipment |
Model |
|
1. |
Electronic weighing balance |
Eagle, Mumbai |
|
2. |
Friabilator |
Roche Friabilator Electro lab, Mumbai |
|
3. |
Laboratory oven |
DTC-00R |
|
4. |
Compression machine |
Cmd (Cadmach) |
|
6. |
Tablet hardness tester |
Pfizer Hardness Tester, Mumbai |
|
7. |
UV |
Lab India UV 3000 |
|
8. |
Dissolution apparatus |
Electro Lab TDT-08L |
|
9. |
Vernier calipers |
Cd-6” Cs |
METHODOLOGY14,15,16
Construction of calibration curve of Gliclazide in 0.1N HCL:
Procedure:
Working standard: 100mg of Gliclazide was weighed and dissolved in 0.1N HCL and then made up to a volume of 100ml with0.1N HCL. Dilution 1: From the working standard solution 1ml was diluted to 10ml with 0.1NHcl.
from dilution 1, take 0.2, 0.4, 0.6, 0.8, 1.0ml of solution and was diluted up to mark in 10ml volumetric flask to obtain 2,4,6,8,10 µg/ml concentrated solutions. This solutions absorbance was noted at λmax242
Formulation of gastro retentive floating tablets by direct compression method
Processing steps involved in direct compression method:
The floating tablets were prepared by following the General Methodology as given below:
Table No. 5: Quantities of ingredients used in formulation of tablets in mg
|
INGREDIENTS |
F1 (mg) |
F2 (mg) |
F3 (mg) |
F4 (mg) |
F5 (mg) |
F6 (mg) |
F7 (mg) |
F8 (mg)
|
F9 (mg) |
|
Gliclazide |
60 |
60 |
60 |
60 |
60 |
60 |
60 |
60 |
60 |
|
HPMC K4 M |
120 |
180 |
- |
- |
240 |
- |
- |
- |
- |
|
HPMC K15M |
- |
- |
120 |
180 |
- |
240 |
- |
- |
- |
|
HPMC K100M |
- |
- |
- |
- |
- |
- |
120 |
180 |
240 |
|
MCC 102 |
136 |
76 |
136 |
76 |
16 |
16 |
136 |
76 |
16 |
|
Magnesium Stearate |
2 |
2 |
2 |
2 |
2 |
2 |
2 |
2 |
2 |
|
Talc |
2 |
2 |
2 |
2 |
2 |
2 |
2 |
2 |
2 |
|
NaHCO3 |
30 |
30 |
30 |
30 |
30 |
30 |
30 |
30 |
30 |
|
Total weight |
350 |
350 |
350 |
350 |
350 |
350 |
350 |
350 |
350 |
EVALUATION TESTS17,18,19
The formulated tablets were evaluated for the following Pre, post compression quality control studies & In vitro Buoyancy studies and dissolution studies
A) Pre Compression studies:
Angle of Repose: It is defined as the maximum angle possible between the surface of a pile of powder and the horizontal plane.
Angle of Repose of granules was determined by the funnel method. Accurately weighed powder blend was taken in the funnel. Height of the funnel was adjusted in such a way the tip of the funnel just touched the apex of the powder blend.
Powder blend was allowed to flow through the funnel freely on to the surface. Diameter of the powder cone was measured and angle of repose was calculated using the following equation.
q = tan-1 (h/r)
Where:
q = angle of repose
h = height in cms
r = radius in cms
The angle of repose has been used to characterize the flow properties of solids. It is a characteristic related to inter particulate friction or resistance to movement between particles.
2. Density:
Bulk density (BD): It is the ratio of total mass of powder to the bulk volume of powder Weigh accurately 25 g of granules, which was previously passed through 22 # sieve and transferred in 100 ml graduated cylinder. Carefully
Bulk density = weight of powder / Bulk volume.
Db =
M = mass of the powder
V0 = bulk volume of the powder.
Tapped density (TD): It is the ratio of total mass of powder to the tapped volume of powder
Weigh accurately 25 g of granules, which was previously passed through 22# sieve and transferred in 100 ml graduated cylinder of tap density tester which was operated for fixed number of taps until the powder bed volume has reached a minimum, thus was calculated by formula.
Tapped density = Weigh of powder / Tapped volume
Dt = (M) / (V f).
M = mass of the powder
V f = tapped volume of the powder.
Carr’s Index:
Compressibility index of the powder blend was determined by Carr’s compressibility index. It is a simple test to evaluate the BD and TD of a powder and the rate at which it packed down. The formula for Carr’s index is as below:
Compressibility index = 100 x
Hausner’s Ratio:
Hausner’s Ratio is a number that is correlated to the flow ability of a powder.
Hausner’s Ratio =
Post compression studies:20,21,22
General appearance: The formulated tablets were assessed for its general appearance and observations were made for shape, color, texture and odor.
Average weight/Weight Variation: 20 tablets were selected and weighed collectively and individually. From the collective weight, average weight was calculated. Each tablet weight was then compared with average weight to assure whether it was within permissible limits or not. Not more than two of the individual weights deviated from the average weight by more than 7.5% for 300 mg tablets and none by more than double that percentage.
Average weight = weight of 20 tablets
20
%weight variation = average weight - weight of each tablet ×100
Average weight
Thickness: Thickness of the tablets (n=3) was determined using a Vernier calipers
Hardness test: Hardness of the tablet was determined by using the Monsanto hardness tester (n=3) the lower plunger was placed in contact with the tablet and a zero reading was taken. The plunger was then forced against a spring by turning a threaded bolt until the tablet fractured. As the spring was compressed a pointer ride along a gauge in the barrel to indicate the force.
Friability test: This test is performed to evaluate the ability of tablets to withstand abrasion in packing, handling and transporting.
Initial weight of 20 tablets is taken and these are placed in the Friabilator, rotating at 25rpm for 4min.The difference in the weight is noted and expressed as percentage. It should be preferably between 0.5 to 1.0%.
%Friability = [(W1-W2)/W1] X 100
Where, W1= weight of tablets before test,
W2 = weight of tablets after test
Assay Procedure: Weigh and finely powder not less than 20 tablets. Transfer an accurately weighed portion of the powder equivalent to about 10mg of model drug a 10 ml volumetric flask. Add approximately 6ml of 0.1N HCl and shake and sonicate for 10 min to complete the extraction. Dilute the methanol to volume and mix. Pipette 1ml aliquot into a 10ml volumetric flask, dilute with mobile phase to volume, mix and filter..
Calculate the quantity in mg of model drug Hydrochloride in the portion taken by the formula
Assay = test absorbance/standard absorbance*standard concentration/sample concentration*purity of drug/100*100
In vitro Buoyancy studies:23,24
The in vitro buoyancy was determined as per the method described by Rosa et al.
In vitro Dissolution Study: 900 ml of 0.1N HCl was placed in the vessel and the USP-II apparatus (Paddle method) was assembled. The medium was allowed to equilibrate to temperature of 370C ± 0.50C. A tablet was placed in the vessel and was covered; the apparatus was operated up to 12 hrs. at 50 rpm. At definite time intervals, 5 ml of dissolution medium was withdrawn; filtered and again replaced with 5 ml of fresh medium to maintain sink conditions. Suitable dilutions were done with dissolution medium and were analyzed spectrophotometrically at lmax =242 nm using a UV-spectrophotometer (Lab India).
Table No.6: Dissolution parameters
|
Parameter |
Details |
|
Dissolution apparatus |
USP -Type II (paddle) |
|
Medium |
0.1N HCl. |
|
Volume |
900 ml |
|
Speed |
50 rpm |
|
Temperature |
37± 0.5 ºC |
|
Sample volume withdrawn |
5ml |
|
Time points(hrs.) |
1,2,4,6,8,10,12 |
|
Analytical method |
Ultraviolet Visible Spectroscopy |
|
λ max |
242 nm |
In vitro Release Kinetics Studies:25,26
The analysis of drug release mechanism from a pharmaceutical dosage form is important but complicated process and is practically evident in the case of matrix systems. The order of drug release from FDDS was described by using zero order kinetics or first order kinetics. The mechanism of drug release from FDDS was studied by using Higuchi equation and the Peppa’s-Korsemeyer equation.
It defines a linear relationship between the fractions of drug released versus time.
Q=k0t.
Where, Q is the fraction of drug released at time t and ko is the zero order release rate constant. A plot of the fraction of drug released against time will be linear if the release obeys zero order release kinetics.
Wagner assuming that the exposed surface area of a tablet decreased exponentially with time during dissolution process suggested that the drug release from most of the slow-release tablets could be described adequately by the first-order kinetics. The equation that describes first order kinetics is
Log C= Log Co-kt/2.303
Where C is the amount of drug dissolved at time t,
Co is the amount of drug dissolved at t=0 and
k is the first order rate constant.
A graph of log cumulative of log % drug remaining vs time yields a straight line will be linear if the release obeys the first order release kinetics.
It defines a linear dependence of the active fraction released per unit of surface (Q) and the square root of time.
Q=K2t1/2
Where K2 is release rate constant. A plot of the fraction of drug released against square root of time will be linear if the release obeys Higuchi equation. This equation describes drug release as a diffusion process based on the Fick’s law, square root time dependent20.
In order to define a model, which would represent a better fit for the formulation, dissolution data was further analyzed by Peppa’s-Korsemeyer equation (Power Law).
Mt/ M∞ =K.tn
Where, Mt is the amount of drug released at time t
Mα is the amount released at time α,
Mt/Mα is the fraction of drug released at time t,
K is the kinetic constant and n is the diffusion exponent.
To characterize the mechanism for both solvent penetration and drug release n can be used as abstracted. A plot between log drug releases up to 60% against log of time will be linear if the release obeys Peppa’s-Korsemeyer equation and the slope of this plot represents “n” value21.the kinetic data of the formulations were included.
Nature of release of the drug from the designed tablets was inferred based on the correlation coefficients obtained from the plots of the kinetic models. The data were processed for regression analysis using MS EXCEL
RESULTS AND DESCUSSIONS
DRUG AND EXCIPIENTS COMPATIBILITY STUDIES
The compatibility of Gliclazide with the excipients used in Gliclazide floating tablets are analyzed by IR studies. Compatibility of the drug with excipients are determined by preparing different ratios of drug and excipients, and then the mixtures are subjected for the IR studies immediately after mixing as well as after 1 month of mixing.
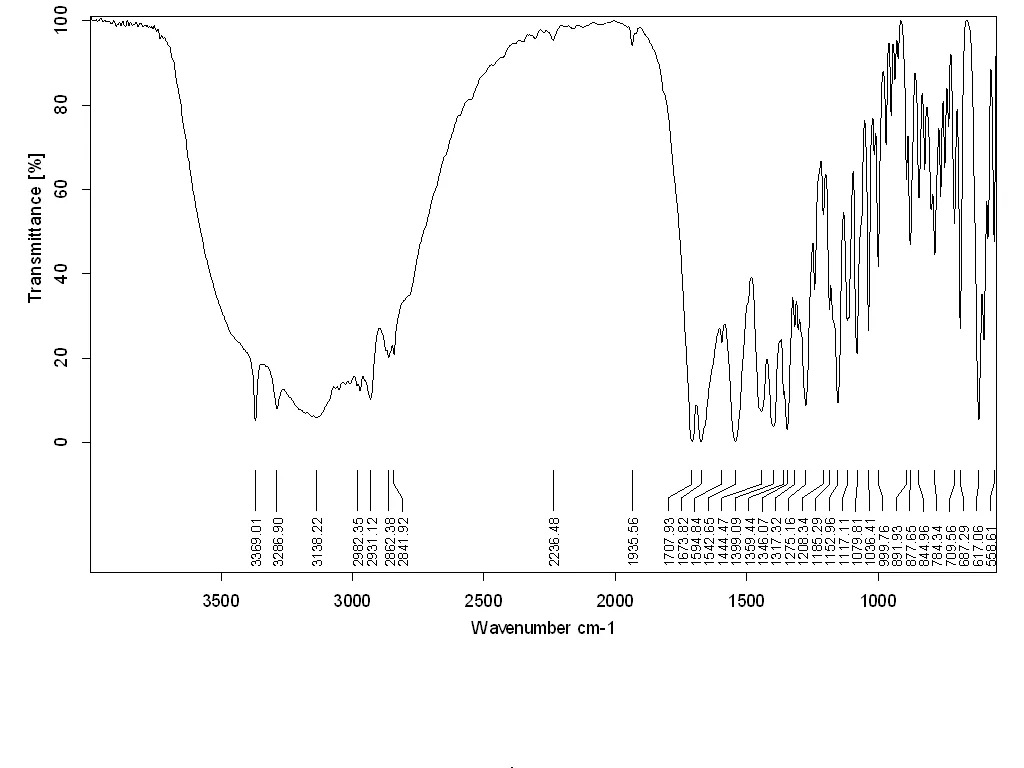
Fig.No.1: FTIR Spectra for Gliclazide
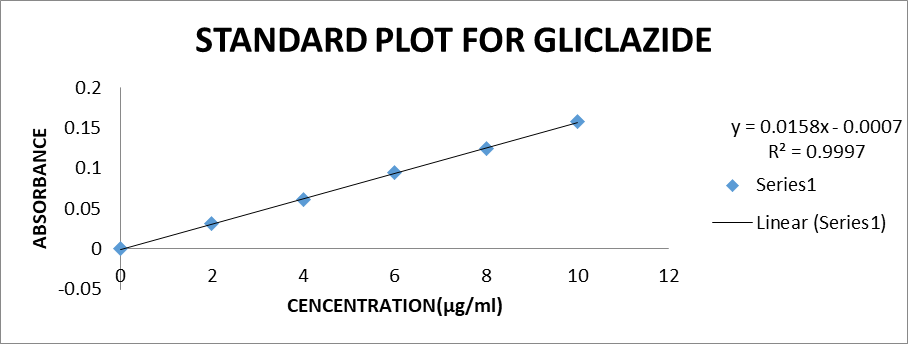
Figure No. 2: Standard calibration curve of Gliclazide in 0.1N HCl
Inference: The standard calibration curve of Gliclazide in 0.1N HCl showed good correlation with regression value of 0.999
Pre Compression studies
Table No. 7: Pre compression studies of Gliclazide Floating tablets
|
Formulations /tests |
Bulk density |
Tapped density |
Angle of repose |
Compressibility index |
Hausner’s ratio |
|
F1 |
0.46±0.012 |
0.55±0.035 |
22.62±0.03 |
16.36±0.039 |
1.19±0.015 |
|
F2 |
0.59±0.02 |
0.68±0.07 |
22.29±0.019 |
13.04±0.023 |
1.15±0.011 |
|
F3 |
0.53±0.018 |
0.63±0.01 |
20.29±0.01 |
15.8±0.059 |
1.18±0.014 |
|
F4 |
0.47±0.012 |
0.59±0.018 |
28.23±0.06 |
20.3±0.01 |
1.25±0.02 |
|
F5 |
0.42±0.010 |
0.53±0.08 |
23.24±0.059 |
26.19±0.03 |
1.26±0.021 |
|
F6 |
0.48±0.013 |
0.57±0.01 |
27.4±0.04 |
14.04±0.042 |
1.14±0.010 |
|
F7 |
0.46±0.012 |
0.57±0.01 |
22.26±0.03 |
23.91±0.062 |
1.23±0.021 |
|
F8 |
0.44±0.011 |
0.53±0.08 |
23.62±0.042 |
20.45±0.061 |
1.2±0.02 |
|
F9 |
0.48±0.013 |
0.56±0.02 |
25.24±0.05 |
16.66±0.05 |
1.16±0.01 |
*n=3
Inference: The blends prepared for dry granulation of tablets were evaluated for their flow properties; the results for the blends of compression tablets were shown in Table No.17
Table No.8: Post compression studies of Gliclazide floating tablets
|
Formulations |
Hardness (Kg/cm2) |
Friability (%) |
Weight variation
|
Content uniformity |
|
F1 |
5.433 |
0.568 |
pass |
99.3 |
|
F2 |
5.283 |
0.531 |
pass |
99.8 |
|
F3 |
5.016 |
0.488 |
pass |
100.3 |
|
F4 |
6.0833 |
0.633 |
pass |
99.6 |
|
F5 |
5.816 |
0.605 |
pass |
100 |
|
F6 |
5.866 |
0.445 |
pass |
100.16 |
|
F7 |
5.2 |
0.52 |
pass |
100.3 |
|
F8 |
5.1 |
0.47 |
pass |
100.6 |
|
F9 |
5.7 |
0.44 |
pass |
100 |
Inference:
Table No. 9: In vitro Buoyancy Studies of Model drug floating tablets
|
Formulation Code |
Floating lag time |
Total floating time |
Matrix Integrity up to 12 hrs. |
|
F1 |
19 sec±0.32 |
Up to 4hrs |
Eroding |
|
F2 |
44 sec±0.35 |
Up to 6hrs |
Eroding |
|
F3 |
31 sec±0.32 |
Up to 12hrs |
Non eroding |
|
F4 |
19 sec±0.72 |
Up to 12hrs |
Non eroding |
|
F5 |
13sec±0.15 |
Up to 4 hrs |
Eroding |
|
F6 |
13sec±0.38 |
Up to 6hs |
Eroding |
|
F7 |
31sec±0.32 |
Up to 12hrs |
Non eroding |
|
F8 |
13 sec±0.38 |
Up to 5hrs |
Eroding |
|
F9 |
31sec±0.45 |
Up to 12hrs |
Non eroding |
n* = 3
Inference:
INVITRO DISSOLUTION STUDIES OF GLICLAZIDE FLOATING TABLETS:
Table No.10: Dissolution parameters
|
Parameter |
Details |
|
Dissolution apparatus |
USP -Type II (paddle) |
|
Medium |
0.1N HCl. |
|
Volume |
900 ml |
|
Speed |
50 rpm |
|
Temperature |
37± 0.5 ºC |
|
Sample volume withdrawn |
5ml |
|
Time points(hrs) |
1,2,4,6,8,10,12 |
|
Analytical method |
Ultraviolet Visible Spectroscopy |
|
λ max |
242 nm |
Note: 5 ml of sample was with draw at each time point & replace the same volume of 0.1N HCl.
Table No.11: In vitro Dissolution results of Formulation trails with HPMC K4M, HPMC K15M, HPMC K100M
|
|
%cumulative drug release |
||||||||
|
Time in hrs. |
HPMC K4M |
HPMC K15M |
HPMC K100M |
||||||
|
F1 |
F2 |
F5 |
F3 |
F4 |
F6 |
F7 |
F8 |
F9 |
|
|
0 |
0 |
0 |
0 |
0 |
0 |
0 |
0 |
0 |
0 |
|
0.5 |
33 |
28 |
25 |
25 |
21 |
18 |
23 |
19 |
15 |
|
1 |
45 |
41 |
39 |
33 |
29 |
25 |
31 |
27 |
21 |
|
2 |
68 |
61 |
54 |
46 |
36 |
32 |
42 |
31 |
28 |
|
3 |
83 |
76 |
67 |
59 |
49 |
41 |
61 |
43 |
36 |
|
4 |
95 |
89 |
79 |
68 |
63 |
58 |
72 |
64 |
49 |
|
6 |
99.4 |
93 |
91 |
81 |
79 |
68 |
85 |
73 |
61 |
|
8 |
_ |
99.8 |
97 |
96 |
84 |
81 |
91 |
89 |
78 |
|
10 |
_ |
_ |
100 |
99.2 |
97 |
96 |
96 |
95 |
83 |
|
12 |
_ |
_ |
_ |
_ |
99.9 |
98.9 |
99.2 |
99.4 |
94 |
Stability studies:
The accelerated stability study for the formulation at 40 ± 2 0C and 75 ± 5% RH., was conducted for 3 months, which includes the testing of parameters like identification of physical characters, identification by HPLC, average weight per tablet, water content, dissolution profile and Assay throughout the study period.
Table No. 12: Stability studies of Gliclazide floating tablets at 40 ± 2 0C and 75 ±5 RH
|
Characteristics tested |
Specifications |
Initial |
1st Month |
2nd Month |
3rd Month |
|
Description |
White colored oval shaped film coated tablet with ‘C’ on one side |
Complies |
Complies |
Complies |
Complies |
|
Identification By HPLC |
The RT of the major peak in the chromatogram of the Assay preparation corresponds to that in the chromatogram of the standard preparation obtained as directed in the Assay. |
Complies |
Complies |
Complies |
Complies |
|
Dissolution (%) |
Not less than 60% of the drug should be released in 6 hrs. |
60.2 |
60.5 |
60.7 |
61.0 |
|
Assay % |
The tablet contains not less than 90.0% and not more than 110.0% of the stated amount of Gliclazide |
98.0 |
98.2 |
98.6 |
98.6 |
The stability studies of optimized formulation of Gliclazide floating tablets were conducted according to the ICH guidelines. The formulations were withdrawn at suitable intervals (1,2 and 3 months) and analyzed visually for physical appearance and evaluated for different tests. The formulation showed no visual differences, complied with description. The formulation complied for identification test. The drug content remaining in the formulation at different intervals of time also complied with the specifications. From the above results, it can be concluded that the formulation of Gliclazide floating tablets is stable.
SUMMARY AND CONCLUSION
From the experimental data, it can be concluded that
REFERENCES
and in vivo evaluations of bilayer tablet formulations, Drug Dev Ind Pharm., 2000; 26: 857-866.
Aceta.Helv, 1985; 60: 110-111.
xanthan gum, RJPBCS, 2011, 2(2), 319-328.
and in vivo evaluations of bilayer tablet formulations, Drug Dev Ind Pharm., 2000; 26: 857-866.
Aceta.Helv, 1985; 60: 110-111.
xanthan gum, RJPBCS, 2011, 2(2), 319-328.


Surendranath Betala, Reshma Banu S, Ajay Kumar S. N., Dr. E. Gopinath. Formulation And Evaluation of Gastro Retentive Floating Drug Delivery System of Gliclazide, Int. J. of Pharm. Sci., 2026, Vol 4, Issue 8, 3574-3588, https://doi.org/10.5281/zenodo.22055378
 10.5281/zenodo.22055378