
We use cookies to ensure our website works properly and to personalise your experience. Cookies policy
JKK Munirajah Institute of Health Sciences College of Pharmacy.
The development of low-dose potent pharmaceutical formulations presents significant manufacturing challenges due to the stringent requirements for content uniformity, dose accuracy, and consistent therapeutic performance. Even minor variations in the distribution of the active pharmaceutical ingredient (API) can lead to substantial differences in product quality and efficacy. The present study aimed to develop and optimize a low-dose potent drug formulation using Rapid Mixing Technology in combination with a Quality by Design (QbD) approach to achieve a robust and reproducible manufacturing process.A systematic QbD framework was employed to establish the Quality Target Product Profile (QTPP) and identify Critical Quality Attributes (CQAs), Critical Material Attributes (CMAs), and Critical Process Parameters (CPPs) that influence the final product quality. Risk assessment tools and Design of Experiments (DoE) were utilized to evaluate the impact of formulation components and process variables on blend homogeneity and tablet performance. Rapid Mixing Technology was incorporated to enhance the uniform distribution of the API within the formulation, thereby reducing the risk of segregation and improving process consistency.The optimized formulation was comprehensively evaluated for critical quality parameters, including content uniformity, dissolution profile, flow properties, tablet hardness, friability, and stability. Experimental results demonstrated that the optimized process produced tablets with excellent content uniformity, satisfactory mechanical strength, and reproducible dissolution characteristics. The formulation consistently met pharmacopeial acceptance criteria and exhibited stable performance throughout the study period.The findings indicate that the integration of Rapid Mixing Technology with a QbD-based development strategy provides an effective approach for overcoming the challenges associated with low-dose potent drug formulations. The systematic understanding of material attributes and process parameters enabled the development of a high-quality product with improved manufacturing reliability and regulatory compliance. This approach not only enhances product quality and process efficiency but also supports lifecycle management and continuous improvement in pharmaceutical manufacturing. The study highlights the potential of combining advanced mixing technologies with science- and risk-based development methodologies for the successful formulation of low-dose potent pharmaceutical products.
2.1 Endometriosis:
Endometriosis is a chronic, estrogen-dependent gynecological disorder characterized by the presence of endometrial-like tissue outside the uterine cavity. It is one of the most prevalent reproductive disorders affecting women of reproductive age and is associated with chronic pelvic pain, dysmenorrhea, dyspareunia, infertility, and reduced quality of life. Globally, endometriosis affects approximately 10% of women of reproductive age and up to 50% of women experiencing infertility. The disease imposes a substantial socioeconomic burden due to healthcare expenditures, loss of productivity, and long-term management requirements. Despite advances in diagnostic and therapeutic approaches, delayed diagnosis and inadequate treatment remain major clinical challenges.
Hormonal therapy is considered the cornerstone of endometriosis management because the disease is highly dependent on estrogen stimulation. Various hormonal agents, including progestins, combined oral contraceptives, gonadotropin-releasing hormone (GnRH) agonists, and aromatase inhibitors, have demonstrated effectiveness in reducing pain symptoms and suppressing the progression of endometriotic lesions. Among these therapies, progestin-based formulations are widely prescribed due to their favorable efficacy and safety profile. Hormonal tablets provide a convenient and non-invasive route of administration, ensuring patient compliance and long-term therapeutic benefits. However, the development of high-quality hormonal tablet formulations remains challenging because of the low-dose nature of hormonal drugs, stringent content uniformity requirements, and the need for robust manufacturing processes.
2.2 Tablet Dosage forms in Hormonal Drug Delevery
Tablets continue to be the most widely used pharmaceutical dosage form because of their stability, convenience, accurate dosing, ease of administration, and cost-effective manufacturing. The successful development of tablet formulations depends on the appropriate selection of excipients and manufacturing processes capable of producing tablets with acceptable physical and performance characteristics. Critical quality attributes such as hardness, friability, content uniformity, dissolution, and stability significantly influence the therapeutic effectiveness of tablet products. Therefore, optimization of formulation variables and process parameters is essential to ensure consistent product quality.
Granulation is a critical step in tablet manufacturing and plays a significant role in determining the flowability, compressibility, and uniformity of powder blends. Among the available manufacturing approaches, wet granulation is extensively employed for pharmaceutical formulations due to its ability to improve powder handling characteristics and enhance content uniformity. Wet granulation involves the aggregation of powder particles using a granulating liquid, resulting in granules with improved mechanical strength and compressibility. The process generally consists of wetting and nucleation, granule growth and consolidation, followed by drying and sizing operations. Compared with direct compression, wet granulation provides better control over blend uniformity and tablet quality, particularly for formulations containing low-dose active pharmaceutical ingredients.
Several process variables influence the quality of granules and final tablets produced by wet granulation. Parameters such as binder concentration, granulation time, impeller speed, drying conditions, and excipient composition can significantly affect granule size distribution, flow properties, tablet hardness, and dissolution behavior. Consequently, systematic optimization of these variables is required to develop a robust manufacturing process capable of consistently producing products that meet predefined quality specifications.
2.3 Quality by Design Approach
In recent years, the pharmaceutical industry has shifted from traditional quality-by-testing approaches toward Quality by Design (QbD), a science- and risk-based framework for pharmaceutical development. The concept of QbD was introduced by regulatory authorities, including the United States Food and Drug Administration (FDA) and the International Council for Harmonisation (ICH), to enhance product quality through systematic process understanding and control. According to ICH Q8(R2), QbD is defined as a systematic approach to pharmaceutical development that begins with predefined objectives and emphasizes product and process understanding based on sound scientific principles and quality risk management.
2.3.1 Quality Target Product Profile (QTPP)
The QbD framework involves the identification of a Quality Target Product Profile (QTPP), determination of Critical Quality Attributes (CQAs), risk assessment of material attributes and process parameters, establishment of a design space, and implementation of an effective control strategy.
2.3.2 Critical Quality Attributes (CQAs)
This approach enables manufacturers to identify sources of variability and establish scientifically justified operating ranges for critical process parameters. By integrating product knowledge with process understanding, QbD facilitates continuous improvement, regulatory flexibility, and enhanced product quality throughout the product lifecycle.
2.3.3 Quality Risk Management
Risk assessment tools such as Failure Mode and Effects Analysis (FMEA) are commonly employed within the QbD framework to identify and prioritize factors that may affect product quality. Through systematic evaluation of severity, occurrence, and detectability of potential failures, critical formulation and process variables can be identified and controlled. The information generated through risk assessment provides the foundation for subsequent experimental studies and optimization efforts.
2.3.4 Design of Experiments (DOE)
Design of Experiments (DOE) is a powerful statistical methodology widely used in QbD-based pharmaceutical development. DOE enables the systematic evaluation of multiple variables simultaneously while identifying their individual and interaction effects on product responses. Compared with conventional one-factor-at-a-time approaches, DOE reduces experimental workload, improves process understanding, and facilitates efficient optimization. Factorial designs, response surface methodologies, and other statistical experimental designs have become essential tools for identifying significant factors affecting pharmaceutical formulations and manufacturing processes.
2.3.5 Factorial Design Methodology
Among DOE techniques, factorial design is particularly useful during the screening and optimization stages of formulation development. It enables the evaluation of critical formulation and process parameters while establishing mathematical relationships between independent variables and response variables. The generated models provide valuable insights into process behavior and support the development of robust formulations with improved performance characteristics.
Considering the increasing demand for affordable and high-quality hormonal therapies, there is a need to develop optimized hormonal tablet formulations using scientifically driven approaches. Application of QbD principles in combination with DOE provides a systematic strategy for understanding formulation variables, identifying critical process parameters, and achieving consistent product quality. Such an approach ensures compliance with regulatory expectations while minimizing development time and manufacturing variability.
2.3.6 Optimization of Formulation and Process Variables
Therefore, the present study focuses on the development and optimization of a hormonal tablet formulation employing wet granulation technology under a Quality by Design framework. Risk assessment and Design of Experiments were utilized to identify and optimize critical formulation and process variables influencing tablet quality attributes. The ultimate objective was to establish a robust and reproducible manufacturing process capable of producing a cost-effective hormonal tablet formulation that meets predefined quality requirements and regulatory standards.
3.0 MATERIALS AND METHOD
3.1Materials
The active pharmaceutical ingredient (API), a low-dose potent hormonal drug (2 mg strength), was obtained from Chemo. The excipients used in the formulation included microcrystalline cellulose (MCC PH 102) and lactose monohydrate as diluents, crospovidone as a disintegrant, povidone K-25 as a binder, talc as a glidant, magnesium stearate as a lubricant, and sodium lauryl sulfate as a surfactant. All chemicals and reagents used in the study were of analytical grade.
3.2 Preformulation Studies
The API was initially characterized for its physical appearance, solubility, moisture content, and UV spectral properties. UV spectral analysis was performed by dissolving the drug in acetonitrile and scanning the solution in the wavelength range of 200–400 nm to determine the absorption maximum (λmax). Moisture content was evaluated by the loss-on-drying method at 105°C. Solubility studies were conducted in different media, and the drug concentration was quantified using a validated HPLC method.
Flow properties of the drug substance were evaluated by determining the angle of repose, bulk density, tapped density, Carr’s compressibility index, and Hausner’s ratio. Drug–excipient compatibility studies were performed by storing binary mixtures of API and excipients under accelerated stability conditions (40 ± 2°C/75 ± 5% RH) for 30 days. Samples were analyzed for physical appearance, assay, and related substances to assess compatibility.
3.3 Quality by Design (QbD) Approach
A Quality by Design (QbD) framework was adopted to systematically develop the formulation. The Quality Target Product Profile (QTPP) was established based on the intended product characteristics, including dosage form, strength, dissolution, content uniformity, and stability requirements. Critical Quality Attributes (CQAs), Critical Material Attributes (CMAs), and Critical Process Parameters (CPPs) were identified through risk assessment studies.
Risk assessment was performed to evaluate the potential impact of material attributes and process variables on product quality. Parameters such as particle size distribution, flow properties, blending time, lubrication time, and compression force were assessed for their influence on content uniformity, assay, dissolution, and related substances.
3.4 Formulation Development
Multiple trial formulations were prepared using wet granulation technology. The composition consisted of API, MCC PH 102, lactose monohydrate, crospovidone, povidone K-25, talc, and magnesium stearate. The final tablet weight was maintained at 140 mg
3.5 Rapid Mixing and Granulation
Rapid Mixing Technology was employed using a Rapid Mixer Granulator (RMG). The API and excipients were accurately weighed and sifted through appropriate sieves before blending. The dry ingredients were mixed in the RMG to achieve uniform distribution of the low-dose API.
A binder solution was prepared by dissolving povidone K-25 in isopropyl alcohol. The binder solution was gradually added to the powder blend during granulation. The wet mass was kneaded to obtain uniform granules and subsequently dried in a fluidized bed dryer until the desired moisture level was achieved.
The dried granules were sized and blended with extragranular crospovidone. Talc and magnesium stearate were added during the lubrication stage and mixed for a specified duration to obtain the final blend.
3.6 Tablet Compression
The lubricated blend was compressed into tablets using a rotary tablet compression machine. Compression parameters were optimized to achieve the desired hardness, thickness, weight uniformity, and mechanical strength.
3.7 Evaluation of Tablets
The prepared tablets were evaluated for critical quality attributes including appearance, weight variation, thickness, hardness, friability, disintegration time, assay, content uniformity, dissolution, and related substances.
Hardness was measured using a tablet hardness tester, while friability was determined using a friabilator operated for 100 revolutions. Weight variation was assessed by individually weighing twenty tablets. Disintegration testing was carried out using a USP disintegration apparatus maintained at 37 ± 2°C.
Drug content and assay were determined using a validated HPLC method employing a C18 column, with UV detection at 308 nm. Dissolution studies were performed in different dissolution media, including 0.1 N hydrochloric acid, acetate buffer (pH 4.5), and phosphate buffer (pH 6.8), using a USP dissolution apparatus.
3.8 Stability Studies
The optimized formulation was subjected to accelerated stability testing under ICH conditions of 40 ± 2°C and 75 ± 5% relative humidity. Samples were evaluated periodically for appearance, assay, dissolution, water content, and related substances. The stability data were compared with initial values to confirm the robustness and stability of the developed formulation.
4.0 RESULT AND DISCUSSION
4.1 Drug Identification and Characterization
Using a UV spectrophotometer to scan the drug's maximum absorbance aids in verifying the reliability of the API. In this process, the wavelength at which the drug exhibits maximum absorbance is identified. Acetonitrile was chosen as the solvent based on its solubility. The spectrum obtained was compared with that of the standard API (308 nm), confirming that the drug exhibits maximum absorbance at 308 nm

UV Spetrum
Table 1. Physicochemical Characteristics of API
|
S.No. |
Parameters |
Mean (±D) |
Flow property |
|
1. |
Angle of Repose |
54.31 |
Poor |
|
2. |
Bulk Density |
0.450 |
|
|
3. |
Tapped Density |
0.625 |
|
|
4. |
Compressibility Index |
28.00 |
|
|
5. |
Hausner’s ratio |
1.38 |
4.2 Analytical Method Validation
The developed HPLC method demonstrated excellent linearity, accuracy, and reproducibility. The correlation coefficient (R²) was greater than 0.999, while recovery values ranged from 99.33% to 100.30%, confirming the reliability of the analytical method.
Table 2. HPLC Method Validation Results
|
Parameter |
Result |
|
Linearity (R²) |
> 0.999 |
|
Recovery (%) |
99.33 – 100.30 |
|
Precision (%RSD) |
< 2% |
|
Retention Time |
11.7 min |
4.3 Preformulation Studies
The API exhibited low moisture content (LOD = 0.65%), indicating good stability under humid conditions. Solubility studies confirmed that the drug belongs to BCS Class I and remained soluble across the physiological pH range.
Table 3. Solubility of Drug Substance
|
S.No. |
Medium |
Drug substance dissolved (mg/mL) |
|
1 |
Water |
0.076 |
|
2 |
0.1N HCl |
0.082 |
|
3 |
pH 4.5 Acetate buffer |
0.072 |
|
4 |
pH 6.8 phosphate buffer |
0.064 |
4.4 Flow Property Evaluation
The API exhibited poor flow properties, necessitating formulation optimization and the use of suitable excipients to improve blend flowability.
Table 4. Flow Properties of API
|
S.No. |
Parameters |
Mean (±D) |
Flow property |
|
1. |
Angle of Repose |
54.31 |
Poor |
|
2. |
Bulk Density |
0.450 |
|
|
3. |
Tapped Density |
0.625 |
|
|
4. |
Compressibility Index |
28.00 |
|
|
5. |
Hausner’s ratio |
1.38 |
4.5 Drug–Excipient Compatibility Studies
No physical changes, color changes, or additional impurity peaks were observed under accelerated storage conditions. The study confirmed the compatibility of the API with all selected excipients.
4.6 QbD-Based Risk Assessment
A Quality by Design (QbD) approach was implemented to identify Critical Quality Attributes (CQAs), Critical Material Attributes (CMAs), and Critical Process Parameters (CPPs). Risk assessment indicated that blending time, lubrication time, compression force, and compression speed significantly influenced product quality attributes.
4.7 Process Optimization
4.7.1 Optimization of Blending Time
A blending time of 10 min produced optimal assay and content uniformity values. Shorter blending times resulted in inadequate uniformity, while longer blending offered no significant improvement.
Table 5. Effect of Blending Time
|
S.No. |
Factors |
Unit |
Levels |
||
|
-5 |
0 |
+5 |
|||
|
1 |
Blending/Mixing Time |
Mins |
5 |
10 |
15 |
|
Results |
Limits |
Observation |
|||
|
|
Top 1 |
- |
93.02 % |
98.12 % |
99.02 % |
|
|
Top 2 |
- |
97.35 % |
99.21 % |
98.9 % |
|
|
Middle 3 |
- |
99.52 % |
99.93 % |
99.89 % |
|
|
Bottom 4 |
- |
95.14 % |
98.91 % |
99.22 % |
|
|
Bottom 5 |
- |
91.31 % |
99.01 % |
98.14 % |
|
Y1 |
Blend Assay |
90-110% |
95.268 % |
99.036 % |
99.034 % |
|
Y2 |
Blend uniformity |
AV NMT 15 |
17 |
5 |
6 |
4.7.2 Optimization of Lubrication Time
Lubrication for 5 min produced the desired dissolution profile and content uniformity comparable to the reference product.
Table 6. Effect of Lubrication Time
|
S.No. |
Factors |
Unit |
Levels |
Control |
||
|
-2 |
0 |
+2 |
- |
|||
|
1 |
Lubrication Time |
Mins |
3 |
5 |
7 |
- |
|
Results |
Limits |
Observation |
|
|||
|
|
Top 1 |
- |
98.14 % |
98.1 % |
98.16 % |
- |
|
|
Top 2 |
- |
99.25 % |
99.21 % |
99.11 % |
- |
|
|
Middle 3 |
- |
99.94 % |
99.92 % |
99.91 % |
- |
|
|
Bottom 4 |
- |
98.9 % |
98.96 % |
98.98 % |
- |
|
|
Bottom 5 |
- |
99.1 % |
98.98 % |
98.94 % |
- |
|
Y1 |
Blend Assay |
90-110% |
99.066 % |
99.034 % |
99.02 % |
- |
|
Y2 |
Blend uniformity |
AV NMT 15 |
8 |
7.9 |
8 |
- |
|
Y3 |
Dissolution at |
NLT 75% (Q) |
96% at |
99% at |
85% at |
99% |
4.8 Evaluation of Optimized Formulation (F2)
The optimized formulation (F2) exhibited satisfactory physical and chemical characteristics and closely matched the reference product.
Table 7. Composition table
|
Ingredients |
F1 |
F2 |
F3 |
F4 |
F5 |
|
mg/tab |
mg/tab |
mg/tab |
mg/tab |
mg/tab |
|
|
Intra-granular |
|||||
|
API |
2 |
2 |
2 |
2 |
2 |
|
MCC PH 102 |
72.8 |
71.9 |
72.8 |
66 |
67.5 |
|
Lactose |
55.4 |
54.3 |
53.4 |
59.2 |
59.7 |
|
Crosspovidone |
2 |
3 |
2 |
4 |
2 |
|
PovidoneK-25 |
4 |
5 |
6 |
5 |
5 |
|
Extra-granular |
|||||
|
Cross-povidone |
0.8 |
0.8 |
0.8 |
0.8 |
0.8 |
|
Talc |
1 |
1 |
1 |
1 |
1 |
|
Lubrication |
|||||
|
Magnesium Stearate |
2 |
2 |
2 |
2 |
2 |
|
Tablet weight |
140 |
140 |
140 |
140 |
140 |
Table 8. Evaluation of Optimized Formulation
|
Formulation code |
Average weight (mg) |
Thickness (mm) |
Hardness (N) |
Friability (%) |
||
|
Min |
max |
min |
Max |
|||
|
F1 |
140 |
3.34 |
3.40 |
68 |
74 |
0.27 |
|
F2 |
140 |
3.38 |
3.42 |
60 |
70 |
0.15 |
|
F3 |
140 |
3.36 |
3.41 |
60 |
68 |
0.09 |
|
F4 |
140 |
3.35 |
3.40 |
61 |
69 |
0.08 |
|
F5 |
140 |
3.36 |
3.42 |
60 |
72 |
0.12 |
4.9 Dissolution: -
Dissolution testing was conducted using 900 ml of a 0.4% sodium lauryl sulfate (SLS) solution in purified water buffer, employing a paddle apparatus (USP Type-II) at a rotation speed of 50 rpm and a temperature of 37.0±0.5°C. Samples were collected at specified intervals of 0, 5, 10, 15, 20, and 30 minutes. These samples were then analyzed using high- performance liquid chromatography (HPLC) to quantify the amount of drug released.
Table 9 Cumulative %Drug Release
|
BATCH CODE |
F1 |
F2 |
F3 |
RP |
|
Time |
Cumulative %Drug Release |
|||
|
0 |
0 |
0 |
0 |
0 |
|
5 |
42 |
37 |
30 |
38 |
|
10 |
79 |
74 |
70 |
76 |
|
15 |
89 |
85 |
80 |
84 |
|
20 |
94 |
90 |
85 |
92 |
|
30 |
99 |
99 |
96 |
99 |
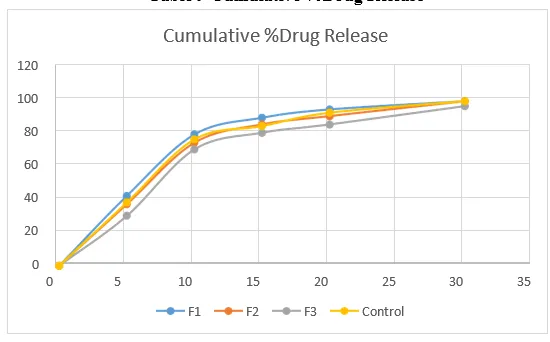
Figure No 1: Effect of various conc. Of Povidone K25 on dissolution
The dissolution study revealed that all formulations successfully met the dissolution requirement of not less than 75% (Q) at 30 minutes. However, excipient variability was closely examined at each interval. It was noted that the optimized formulation (F2) closely matched that of the reference product.
4.10 Related Substances
All impurities remained well below pharmacopeial limits, demonstrating the chemical stability of the formulation.
Table 10. Related Substances of Optimized Formulation
|
Parameter |
Value (%) |
|
Impurity A |
0.101 |
|
Impurity K |
0.068 |
|
Unidentified Impurity |
0.022 |
|
Total Impurities |
0.125 |
4.11 Stability Studies
Accelerated stability studies demonstrated that the optimized formulation remained stable with no significant changes in assay, dissolution, appearance, or impurity profile.
Table 11. Stability Study Results
|
Parameter |
Initial |
1 Month |
|
Assay (%) |
98.4 |
100.3 |
|
Water Content (%) |
6.17 |
6.24 |
|
Dissolution (%) |
94 |
90 |
|
Total Impurities (%) |
0.062 |
0.081 |
4.12 DISCUSSION
The present study successfully demonstrated the application of Rapid Mixing Technology integrated with a Quality by Design approach for the development of a low-dose potent tablet formulation. The optimized formulation (F2) achieved excellent content uniformity, assay, dissolution, and stability characteristics. Risk-based optimization of blending time, lubrication time, compression force, and compression speed significantly improved product quality. The developed formulation showed performance equivalent to the reference product and complied with all predefined quality specifications, confirming the suitability of the proposed manufacturing strategy for low-dose potent drug products.
5.0 ACKNOWLEDGMENT
First and foremost we express our heartfelt sense of gratitude and faithfulness to God’s grace and our family members, which has enabled us to finish our project work successfully.
We express our sincere thanks to our chairman DR. J.K.K. MUNIRAJAH M.Tech (Bolten). Annai JKK Sampoorani Ammal Charitable Trust, for providing all the facilities to carry out this work.
Our sincere gratitude to DR. P. PERUMAL, M.Pharm., Ph.D., FIC., Professor & Principal, JKK Munirajah Institute of Health Sciences College of Pharmacy, T.N.Palayam for his valuable support and encouragement for project work from time to time to complete this work successfully.
With the immense pleasure and pride, we would take opportunity in expressing our deep sense of gratitude to our beloved guide Mr. K.RAJA M.Pharm Professor and Mr. K.GOBINATH, M.Pharm., Associate Professor, Department of Pharmaceutics, JKK Munirajah Institute of Health Sciences College of Pharmacy, T.N.Palayam under whose active guidance, innovate ideas, constant inspiration and constant encouragement and personal concern throughout the course of investigation and successful completion of this work.
Last but not least, great thanks from the heart to our beloved MOTHER and FATHER. They are our living god, as who guided us in the rightful way to achieve all our activities. They gave the incredible effort to become a successful for bright future in this world. Thanks a lot to our parents.
We express our grateful thanks to Organization of Steril gene life science, Formulation and Development Department, Senior and Junior Scientist for their valuable advice and co-operations.
I whole-heartedly thank my loving friends D.Kumudhavalli, R.Ragu, and Vijayaragavan K for the help, support, and affection showered on me through their friendship.
This research project would not have been possible without the support of many people and I am thankful to each and every one who are involved in the completion of my project.
REFFERENCES
Aulton M, Cole G, Hogan J. Pharmaceutical coating technology. Taylor & Francis; 1995 Oc


Dr. P. Perumal, R. Ramar, Formulation And Optimization of Low Dose Potent Drug by Using Rapid Mixing Technology Based on Qbd, Int. J. of Pharm. Sci., 2026, Vol 4, Issue 6, 5358-5369, https://doi.org/10.5281/zenodo.20773049
 10.5281/zenodo.20773049