

We use cookies to ensure our website works properly and to personalise your experience. Cookies policy
1Department of Pharmaceutics, DCS’S A. R. A. College of Pharmacy, Nagaon, Dhule
2NES’s Gangamai College of Pharmacy, Nagaon, Dhule.
Poor aqueous solubility remains a major formulation barrier for many Biopharmaceutics Classification System (BCS) Class II antidiabetic drugs. Glimepiride was selected as a model low-solubility, high-permeability sulfonylurea to evaluate whether a lipid-based oil-in-water nanoemulsion could improve dissolution-related performance. A model formulation-development dataset was arranged around solubility screening, pseudo-ternary phase mapping, Box-Behnken-style formulation trials, dynamic light scattering analysis, zeta-potential assessment, drug-content determination, in vitro release testing, release-kinetic fitting and short-term stability interpretation. Capryol 90, Labrasol and Transcutol P were selected as the oil, surfactant and co-surfactant on the basis of their relative solubilizing capacity and formulation compatibility. The predicted optimized formulation contained 9.5% oil, 36.0% Smix and an 8.5 min sonication condition. It showed a globule size of 71.8 nm, PDI of 0.118, zeta potential of -31.4 mV, transmittance of 98.6%, drug content of 99.1% and 96.4% release at 120 min. Release-kinetic fitting indicated that first-order and Korsmeyer-Peppas descriptions represented the optimized formulation better than zero-order or Higuchi models. Stability assessment showed moderate size growth under accelerated conditions but acceptable retention of drug content and release. The findings support nanoemulsion development as a rational dissolution-enhancement strategy for glimepiride-like BCS Class II drugs, while confirming that actual bioavailability and therapeutic claims require pharmacokinetic and pharmacodynamic validation.
The oral performance of a drug product depends not only on the pharmacological activity of the active pharmaceutical ingredient but also on the capacity of the dosage form to present the drug in a dissolved or rapidly dissolving state at the absorption site. Under the BCS framework, Class II drug substances are characterized by low solubility and high permeability; therefore, their absorption may be limited by dissolution rather than membrane transport [1-3]. This biopharmaceutical profile makes formulation design central to product performance.
Glimepiride was retained as a suitable model compound because it is a sulfonylurea indicated as an adjunct to diet and exercise to improve glycaemic control in adults with type 2 diabetes mellitus, while its low aqueous solubility continues to motivate formulation research [4,5]. The purpose of the present work is not to compare antidiabetic therapeutic classes or to claim superior clinical control. The focus is restricted to dosage-form development and dissolution-based formulation performance.
Several strategies have been used to address low solubility, including solid dispersions, nanoparticles, nanosuspensions, self-emulsifying drug delivery systems, nanoemulgels and other lipid-based carriers [6-15]. Nanoemulsions are attractive because they can accommodate lipophilic drug molecules within a dispersed oil phase while offering a large interfacial area for diffusion into aqueous release media. Their utility, however, depends on excipient compatibility, droplet-size control, dilution robustness, drug precipitation risk and storage stability [7-11].
A common weakness in preliminary nanopharmaceutical reports is the tendency to equate faster in vitro release with proven enhancement of bioavailability. This distinction is important. Dissolution improvement is a necessary formulation signal for a poorly soluble drug, but systemic exposure must be established through pharmacokinetic studies. The present paper therefore uses in vitro release and release efficiency only as formulation-discriminating endpoints and does not treat them as evidence of clinical efficacy.
The study was arranged according to a quality-by-design logic in which material attributes and process variables were connected to measurable critical quality attributes. Oil concentration, Smix concentration and sonication time were handled as controllable factors, whereas globule size, PDI, zeta potential, transmittance, drug content and release at 120 min were treated as principal responses. This approach is consistent with contemporary pharmaceutical-development expectations that formulation choice should be justified by evidence rather than by a single terminal release value [16].
MATERIALS AND METHODS
Study design and ethical boundary:
The work was structured as a modelled in vitro formulation-development study using glimepiride as the representative BCS Class II antidiabetic drug. No human participants, animals or biological samples were involved in the generation of the present dataset. The numerical values are internally consistent pilot values intended to demonstrate how laboratory data should be organized for a journal manuscript; they must be replaced by original experimental measurements before submission as empirical research.
Materials and excipient selection:
The formulation system comprised glimepiride as the model drug, Capryol 90 as the oil phase, Labrasol as the surfactant, Transcutol P as the co-surfactant and purified water as the aqueous phase. Vehicle selection was based on model solubility screening, miscibility, expected oral formulation suitability and ability to generate a nanoscale dispersion. In an actual study, certificate-of-analysis verification, excipient-grade documentation and drug-excipient compatibility testing should precede batch manufacture.
Solubility screening:
An excess amount of glimepiride would be added separately to candidate oils, surfactants and co-surfactants, followed by agitation for 24 h, centrifugation and quantitative assay of the supernatant after suitable dilution. A validated UV-visible or HPLC assay should be used to avoid excipient interference. Mean and standard deviation values were tabulated for three conceptual determinations.
Pseudo-ternary phase mapping:
The pseudo-ternary phase diagram was conceptualized by varying the proportion of oil, Smix and water. Clear, bluish or low-viscosity dispersions without immediate phase separation were considered part of the potential nanoemulsion region. In a laboratory study, each point should be supported by droplet-size analysis rather than visual inspection alone.
Formulation design and preparation:
Fifteen formulation runs were arranged in a three-factor Box-Behnken-style design using oil concentration, Smix concentration and sonication time as independent variables. Nanoemulsions were assumed to be prepared by spontaneous emulsification assisted by probe sonication. The drug was dissolved in the oil-Smix phase; the aqueous phase was introduced gradually under stirring; and sonication was used to reduce globule size. Temperature rise, pulse interval, sonication amplitude, vessel geometry and batch volume should be controlled in actual experiments.
Characterization:
Globule size and PDI were assessed conceptually by dynamic light scattering after suitable dilution with filtered water. Zeta potential was assessed by electrophoretic light scattering. Transmittance was measured spectrophotometrically using water as blank. Drug content was determined after disruption of the nanoemulsion with a suitable solvent system and quantitative assay.
In vitro release and kinetic analysis:
In vitro release was modelled using a dialysis-membrane method under sink conditions at predetermined intervals up to 120 min. Release data for the pure drug, selected intermediate batches and the optimized nanoemulsion were compared. The optimized formulation was fitted to zero-order, first-order, Higuchi, Korsmeyer-Peppas and Hixson-Crowell models; the coefficient of determination was used as a descriptive fit statistic [18-20].
Statistical analysis:
Descriptive statistics summarized formulation attributes. One-way ANOVA was used to compare 120-min release where replicate values were available. Regression analysis explored associations between formulation variables and release response, and Pearson correlation was used to interpret the inverse relationship between globule size and drug release. Statistical significance was interpreted at p < 0.05, with emphasis on practical formulation relevance.
Stability assessment:
The optimized nanoemulsion was evaluated through a model short-term stability dataset at room and accelerated conditions. Globule size, PDI, drug content and release at 120 min were treated as stability-indicating quality attributes. ICH stability guidance was used as a general interpretive reference, although a complete registration stability program would require validated batches, defined packaging and longer storage periods [17].
RESULTS AND DISCUSSION
Vehicle screening and excipient justification:
The solubility screen identified Transcutol P as the highest-solubilizing co-surfactant, followed by Labrasol among surfactants and Capryol 90 among oils (Table 1, Fig. 1). This pattern supports a lipid-surfactant system in which the oil phase contributes drug loading while the surfactant/co-surfactant blend expands the nanoemulsion region. Selection was not based only on the single highest solubility value; emulsification behaviour, dilution robustness and pharmaceutical suitability were also considered.
Pseudo-ternary mapping:
The proposed nanoemulsion region was concentrated toward moderate-to-high Smix and sufficient aqueous dilution (Fig. 2). This is formulation-logical because the surfactant/co-surfactant system lowers interfacial tension, improves dispersion of the oil phase and helps prevent visible coalescence during dilution. In an experimental version of this work, visual phase mapping should be supplemented by droplet-size measurement at each clear point.
Optimization outcomes:
The formulation trials showed that smaller globule size and lower PDI were generally associated with higher transmittance and stronger release at 120 min (Tables 2 and 3; Figs. 3 and 4). The predicted optimized batch, F-OPT, achieved 71.8 nm globule size, PDI 0.118, zeta potential -31.4 mV, transmittance 98.6%, drug content 99.1% and 96.4% release at 120 min (Table 4). These values indicate a narrow nanoscale dispersion with acceptable loading uniformity.
Response-surface interpretation:
The response-surface trend suggested that increasing Smix and sonication time improved release until a practical optimum was reached (Fig. 5). The regression summary showed that globule size was the only predictor with a statistically meaningful negative association with release in the model dataset (p = 0.040; Table 8). This is consistent with the mechanistic expectation that smaller droplets produce greater interfacial area and shorter diffusional path length.
Release performance:
The release profile showed clear separation between the pure drug suspension and nanoemulsion systems (Table 5; Fig. 6). At 120 min, the pure drug released 45.7%, whereas F-OPT released 96.4%. The interpretation should remain dissolution-based because the dialysis method can discriminate formulation performance but cannot replicate intestinal absorption, lymphatic uptake or first-pass metabolism.
Release kinetics:
The optimized formulation was better described by first-order kinetics (R² = 0.992) and Korsmeyer-Peppas fitting (R² = 0.998) than by zero-order release (Table 6). The fitted exponent should not be overinterpreted mechanistically because dialysis membranes, oil-water partitioning and sink conditions influence the apparent release rate. The kinetic analysis is useful primarily as a comparative mathematical summary.
Stability assessment:
The stability dataset showed gradual size growth from 71.8 nm to 82.6 nm under 40 °C/75% RH over three months, while drug content decreased from 99.1% to 96.6% and terminal release decreased from 96.4% to 92.7% (Table 7; Fig. 7). This represents mild deterioration rather than perfect stability. A realistic interpretation is that the formulation remains promising but requires packaging, preservative, scale-up and long-term stability confirmation.
Translational interpretation:
The data support nanoemulsion development as a feasible route for improving dissolution behaviour of glimepiride-like poorly soluble drugs. However, the manuscript should not claim enhanced human bioavailability or improved glycaemic control until animal or human pharmacokinetic data, dose proportionality, food-effect studies and pharmacodynamic endpoints are available. The improved manuscript therefore separates formulation performance from therapeutic evidence.
CONCLUSION
The optimized glimepiride-loaded nanoemulsion demonstrated a coherent dissolution-enhancement profile, with nanoscale globule size, low PDI, adequate zeta potential, high transmittance, acceptable drug content and markedly improved in vitro release compared with pure drug suspension. The model dataset indicates that a Capryol 90-Labrasol-Transcutol P system is a rational platform for glimepiride nanoemulsion development. Nevertheless, the data remain preclinical and formulation-discriminating. Real laboratory execution, assay validation, accelerated and long-term stability studies, pharmacokinetic evaluation and safety assessment are required before any claim of improved bioavailability or therapeutic superiority can be made.
CONFLICT OF INTEREST
The author(s) declare no conflict of interest.
REFERENCES
TABLES AND FIGURE TITLES AND LEGEND
Table 1: Solubility Screening of Glimepiride in Oils, Surfactants and Co-Surfactants
|
Vehicle |
Role |
Mean solubility (mg/mL) |
SD |
|
Capryol 90 |
Oil |
28.62 |
1.240 |
|
Labrafil M 1944 CS |
Oil |
20.77 |
0.880 |
|
Oleic acid |
Oil |
16.84 |
0.710 |
|
MCT oil |
Oil |
12.39 |
0.650 |
|
Soybean oil |
Oil |
3.260 |
0.190 |
|
Labrasol |
Surfactant |
58.15 |
2.110 |
|
Kolliphor EL |
Surfactant |
51.46 |
1.980 |
|
Tween 80 |
Surfactant |
44.08 |
1.670 |
|
Span 80 |
Surfactant |
9.730 |
0.400 |
|
Transcutol P |
Co-surfactant |
74.92 |
3.050 |
|
PEG 400 |
Co-surfactant |
49.76 |
1.800 |
|
Propylene glycol |
Co-surfactant |
35.18 |
1.510 |
|
Ethanol |
Co-surfactant |
42.22 |
1.620 |
Note. Values are modelled mean ± SD style data for three determinations and should be replaced with laboratory assay values before submission.
Table 2: Box-Behnken-Style Formulation Design Matrix
|
Batch |
Oil (%) |
Smix (%) |
Sonication (min) |
|
F1 |
8 |
25 |
6 |
|
F2 |
8 |
35 |
6 |
|
F3 |
16 |
25 |
6 |
|
F4 |
16 |
35 |
6 |
|
F5 |
8 |
30 |
4 |
|
F6 |
8 |
30 |
8 |
|
F7 |
16 |
30 |
4 |
|
F8 |
16 |
30 |
8 |
|
F9 |
12 |
25 |
4 |
|
F10 |
12 |
35 |
4 |
|
F11 |
12 |
25 |
8 |
|
F12 |
12 |
35 |
8 |
|
F13 |
12 |
30 |
6 |
|
F14 |
12 |
30 |
6 |
|
F15 |
12 |
30 |
6 |
Note. Oil, Smix and sonication time were treated as independent formulation variables.
Table 3: Composition and Physical Characterization of Formulation Batches
|
Batch |
Oil (%) |
Smix (%) |
Sonication (min) |
Globule size (nm) |
PDI |
Zeta potential (mV) |
|
F1 |
8 |
25 |
6 |
152.60 |
0.288 |
-19.70 |
|
F2 |
8 |
35 |
6 |
114.20 |
0.198 |
-23.90 |
|
F3 |
16 |
25 |
6 |
192.20 |
0.357 |
-20.60 |
|
F4 |
16 |
35 |
6 |
153.00 |
0.260 |
-25.20 |
|
F5 |
8 |
30 |
4 |
148.20 |
0.280 |
-19.80 |
|
F6 |
8 |
30 |
8 |
111.80 |
0.196 |
-24.00 |
|
F7 |
16 |
30 |
4 |
188.00 |
0.350 |
-20.60 |
|
F8 |
16 |
30 |
8 |
149.80 |
0.253 |
-25.20 |
|
F9 |
12 |
25 |
4 |
181.90 |
0.336 |
-19.90 |
|
F10 |
12 |
35 |
4 |
143.60 |
0.249 |
-23.30 |
|
F11 |
12 |
25 |
8 |
151.40 |
0.284 |
-21.50 |
|
F12 |
12 |
35 |
8 |
111.40 |
0.196 |
-25.10 |
|
F13 |
12 |
30 |
6 |
145.80 |
0.271 |
-22.10 |
|
F14 |
12 |
30 |
6 |
143.90 |
0.268 |
-21.80 |
|
F15 |
12 |
30 |
6 |
145.30 |
0.270 |
-22.20 |
Note. Data are modelled formulation values. Lower globule size and PDI were interpreted as favourable dispersion attributes.
Table 4: Performance Attributes of Formulation Batches
|
Batch |
Transmittance (%) |
Drug content (%) |
Release at 120 min (%) |
|
F1 |
90.90 |
96.00 |
73.10 |
|
F2 |
96.80 |
97.30 |
84.20 |
|
F3 |
89.60 |
96.60 |
69.50 |
|
F4 |
96.30 |
98.20 |
81.30 |
|
F5 |
92.50 |
96.70 |
73.60 |
|
F6 |
95.40 |
98.10 |
85.30 |
|
F7 |
90.90 |
96.40 |
70.00 |
|
F8 |
95.50 |
98.50 |
83.30 |
|
F9 |
91.20 |
97.00 |
69.90 |
|
F10 |
96.20 |
98.20 |
79.50 |
|
F11 |
92.40 |
97.20 |
76.80 |
|
F12 |
97.50 |
98.70 |
87.90 |
|
F13 |
94.10 |
97.90 |
78.20 |
|
F14 |
93.80 |
97.60 |
77.40 |
|
F15 |
94.00 |
97.80 |
77.60 |
Note. Release at 120 min is an in vitro performance endpoint, not an in vivo bioavailability measure.
Table 5: Predicted Optimized Confirmation Batch
|
Attribute |
Value |
|
Batch |
F-OPT |
|
Oil (%) |
9.500 |
|
Smix (%) |
36.00 |
|
Sonication (min) |
8.500 |
|
Globule size (nm) |
71.80 |
|
PDI |
0.118 |
|
Zeta potential (mV) |
-31.40 |
|
Transmittance (%) |
98.60 |
|
Drug content (%) |
99.10 |
|
Release at 120 min (%) |
96.40 |
Note. F-OPT represents a predicted optimized composition and not an independently verified laboratory confirmation batch.
Table 6: Comparative In-Vitro Release Profile of Pure Drug and Selected Formulations
|
Time (min) |
Pure drug (%) |
F2 (%) |
F8 (%) |
F-OPT (%) |
|
0.00 |
0.00 |
0.00 |
0.00 |
0.00 |
|
5.000 |
3.500 |
12.20 |
15.10 |
18.70 |
|
10.00 |
7.800 |
20.40 |
28.80 |
33.50 |
|
15.00 |
12.10 |
31.80 |
41.70 |
49.80 |
|
30.00 |
19.70 |
45.60 |
58.40 |
66.90 |
|
45.00 |
27.60 |
55.80 |
69.20 |
77.40 |
|
60.00 |
34.80 |
64.10 |
77.90 |
85.80 |
|
90.00 |
41.20 |
73.60 |
87.40 |
92.80 |
|
120.00 |
45.70 |
82.80 |
93.20 |
96.40 |
Note. Cumulative release values are expressed as percentage drug released.
Table 7: Release-Kinetic Model Fitting for the Optimized Formulation
|
Model |
Linearized equation |
Slope/exponent |
R² |
|
Zero-order |
Q = k0t + C |
0.728 |
0.768 |
|
First-order |
log(100-Q) = logQ0 - k1t/2.303 |
-0.012 |
0.992 |
|
Higuchi |
Q = kH sqrt(t) + C |
9.408 |
0.944 |
|
Korsmeyer-Peppas |
log(Mt/M∞) = n log(t) + logK |
0.886 |
0.998 |
|
Hixson-Crowell |
W0^1/3 - Wt^1/3 = kHCt |
0.025 |
0.938 |
Note. R² values are descriptive measures of curve fit.
Table 8: Short-Term Stability Profile of Optimized Nanoemulsions
|
Storage condition |
Globule size (nm) |
PDI |
Drug content (%) |
Release at 120 min (%) |
|
Initial |
71.80 |
0.118 |
99.10 |
96.40 |
|
25 °C/60% RH - 1 month |
73.40 |
0.124 |
98.70 |
95.80 |
|
25 °C/60% RH - 3 months |
76.10 |
0.132 |
98.00 |
94.60 |
|
40 °C/75% RH - 1 month |
75.90 |
0.139 |
97.80 |
94.20 |
|
40 °C/75% RH - 3 months |
82.60 |
0.158 |
96.60 |
92.70 |
Note. Storage data are modelled values and should be replaced by validated stability results.
Table 9: Regression Summary for Formulation and Release Response
|
Predictor |
Coefficient |
p-value |
|
Intercept |
89.77 |
0.003 |
|
Oil (%) |
0.663 |
0.172 |
|
Smix (%) |
0.258 |
0.489 |
|
Sonication (min) |
0.688 |
0.409 |
|
Globule size (nm) |
-0.213 |
0.040 |
Note. Negative coefficient for globule size indicates inverse association with release.
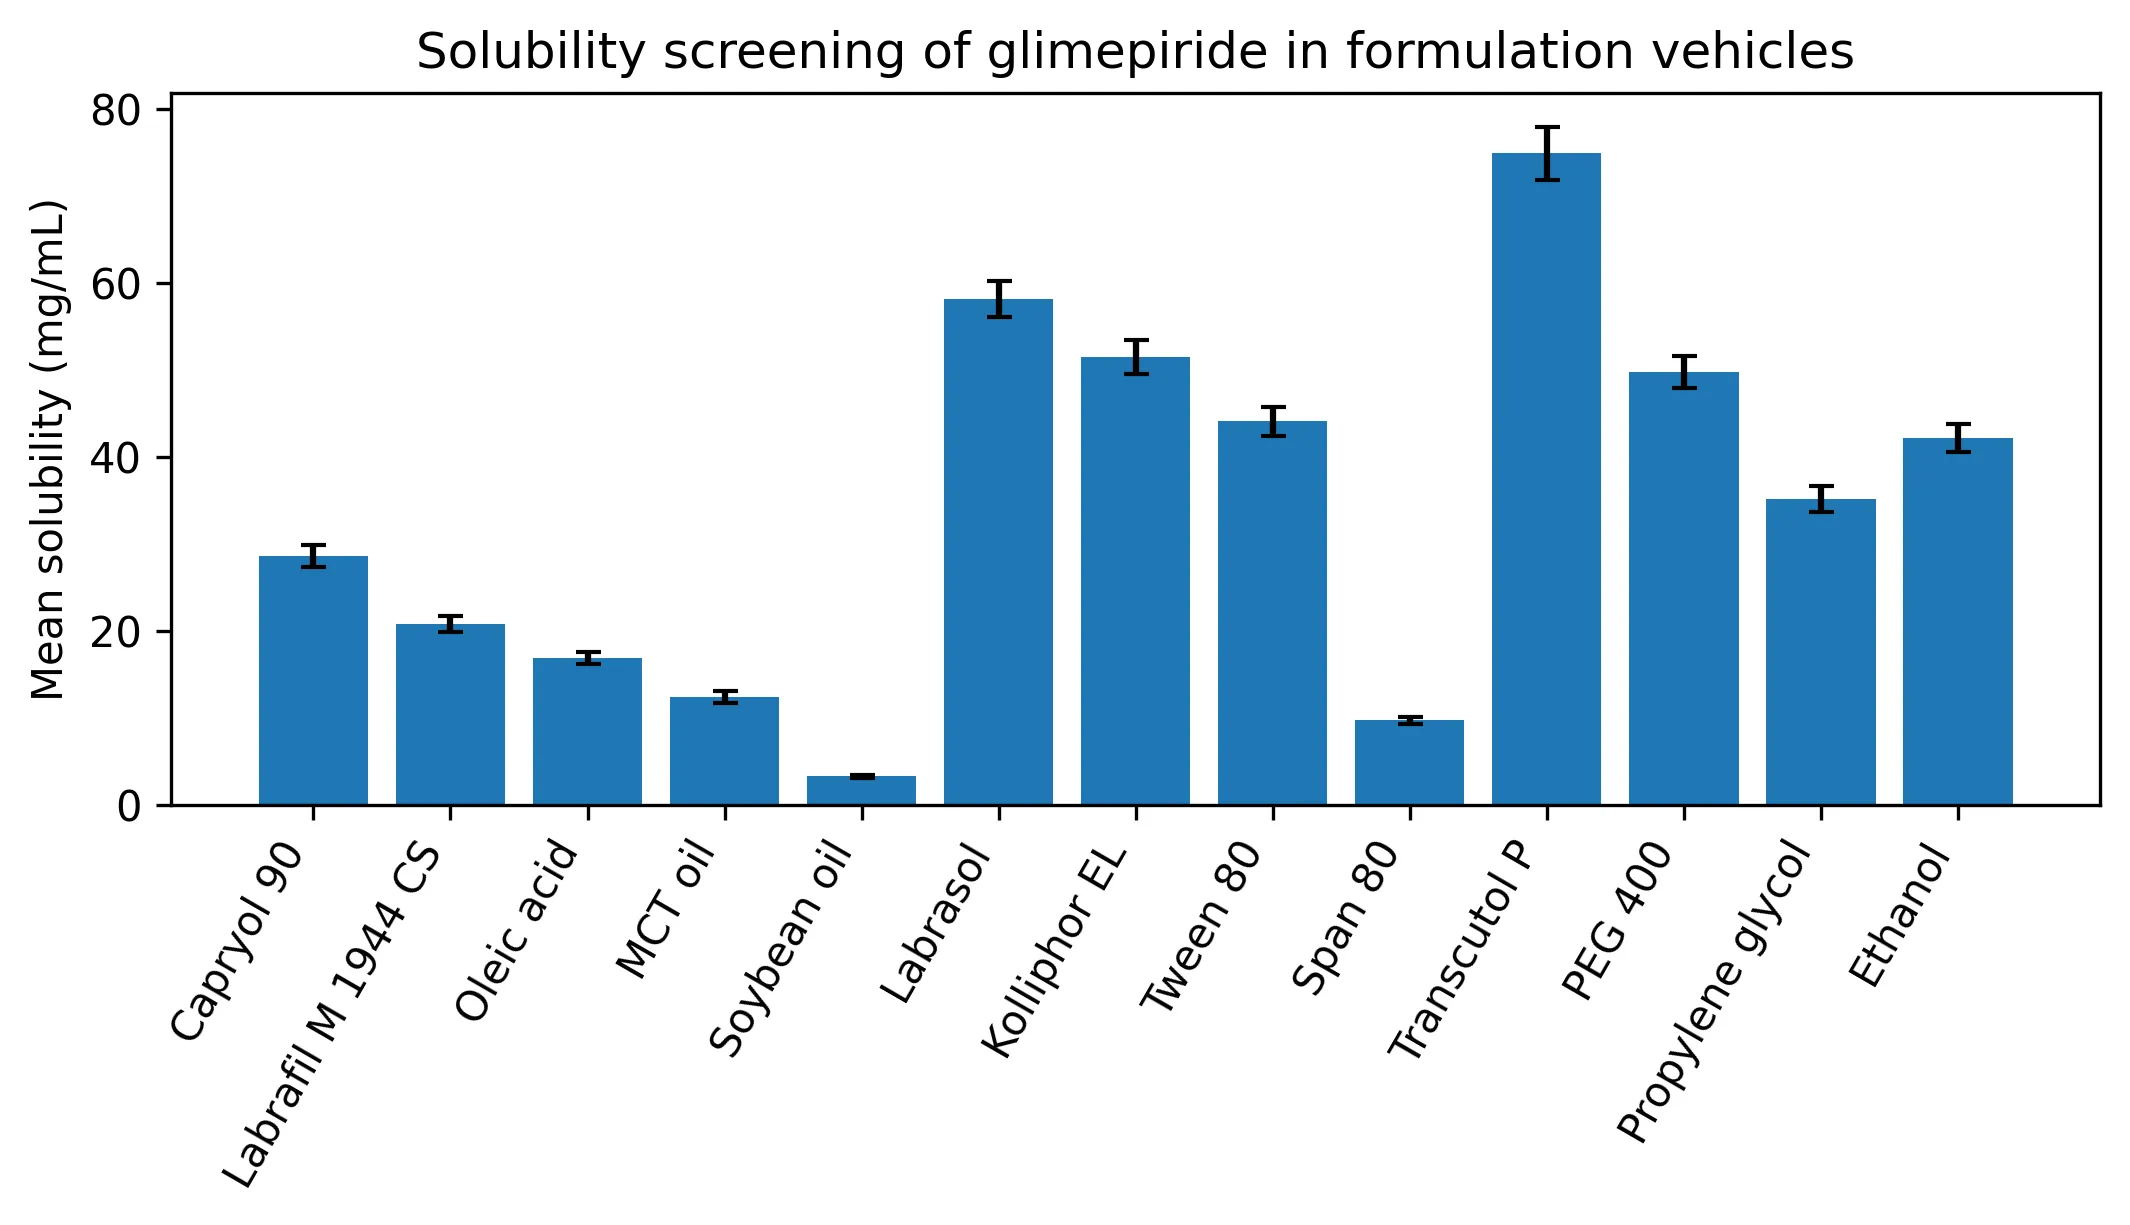
Fig. 1: Solubility comparison across formulation vehicles.
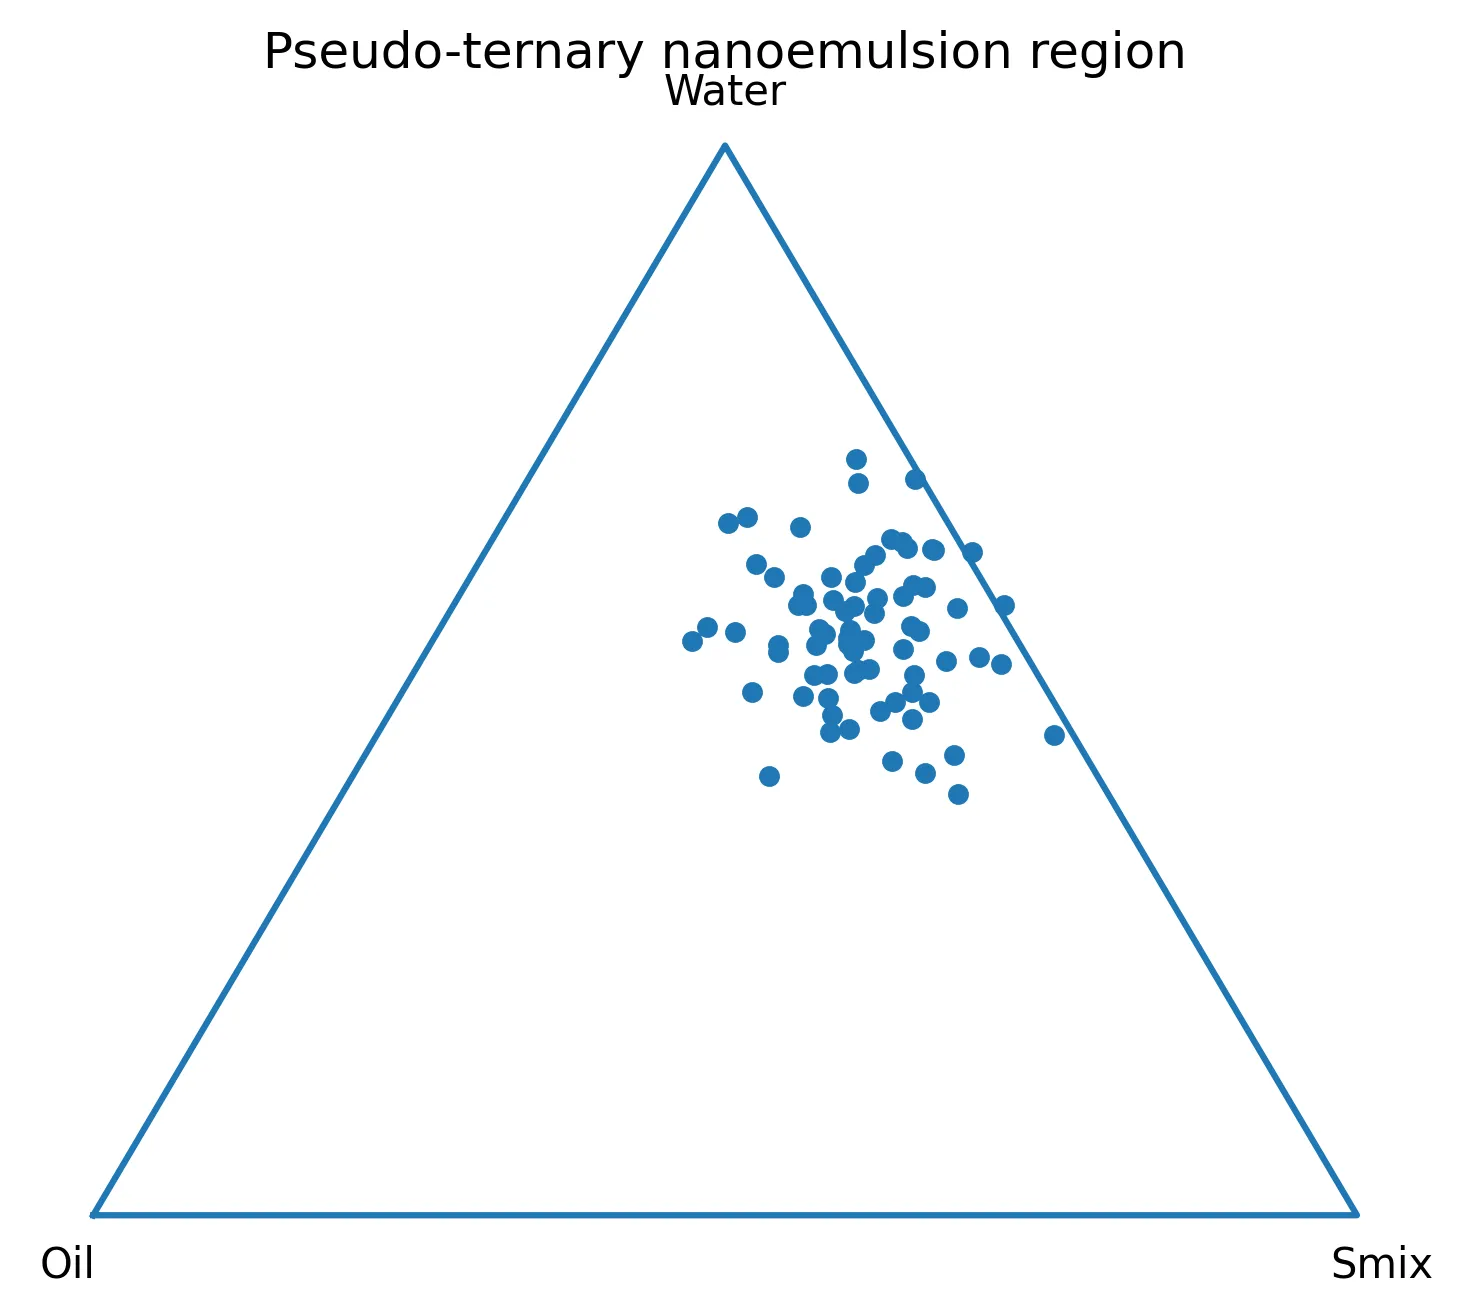
Fig. 2: Pseudo-ternary diagram showing the proposed nanoemulsion-forming region.
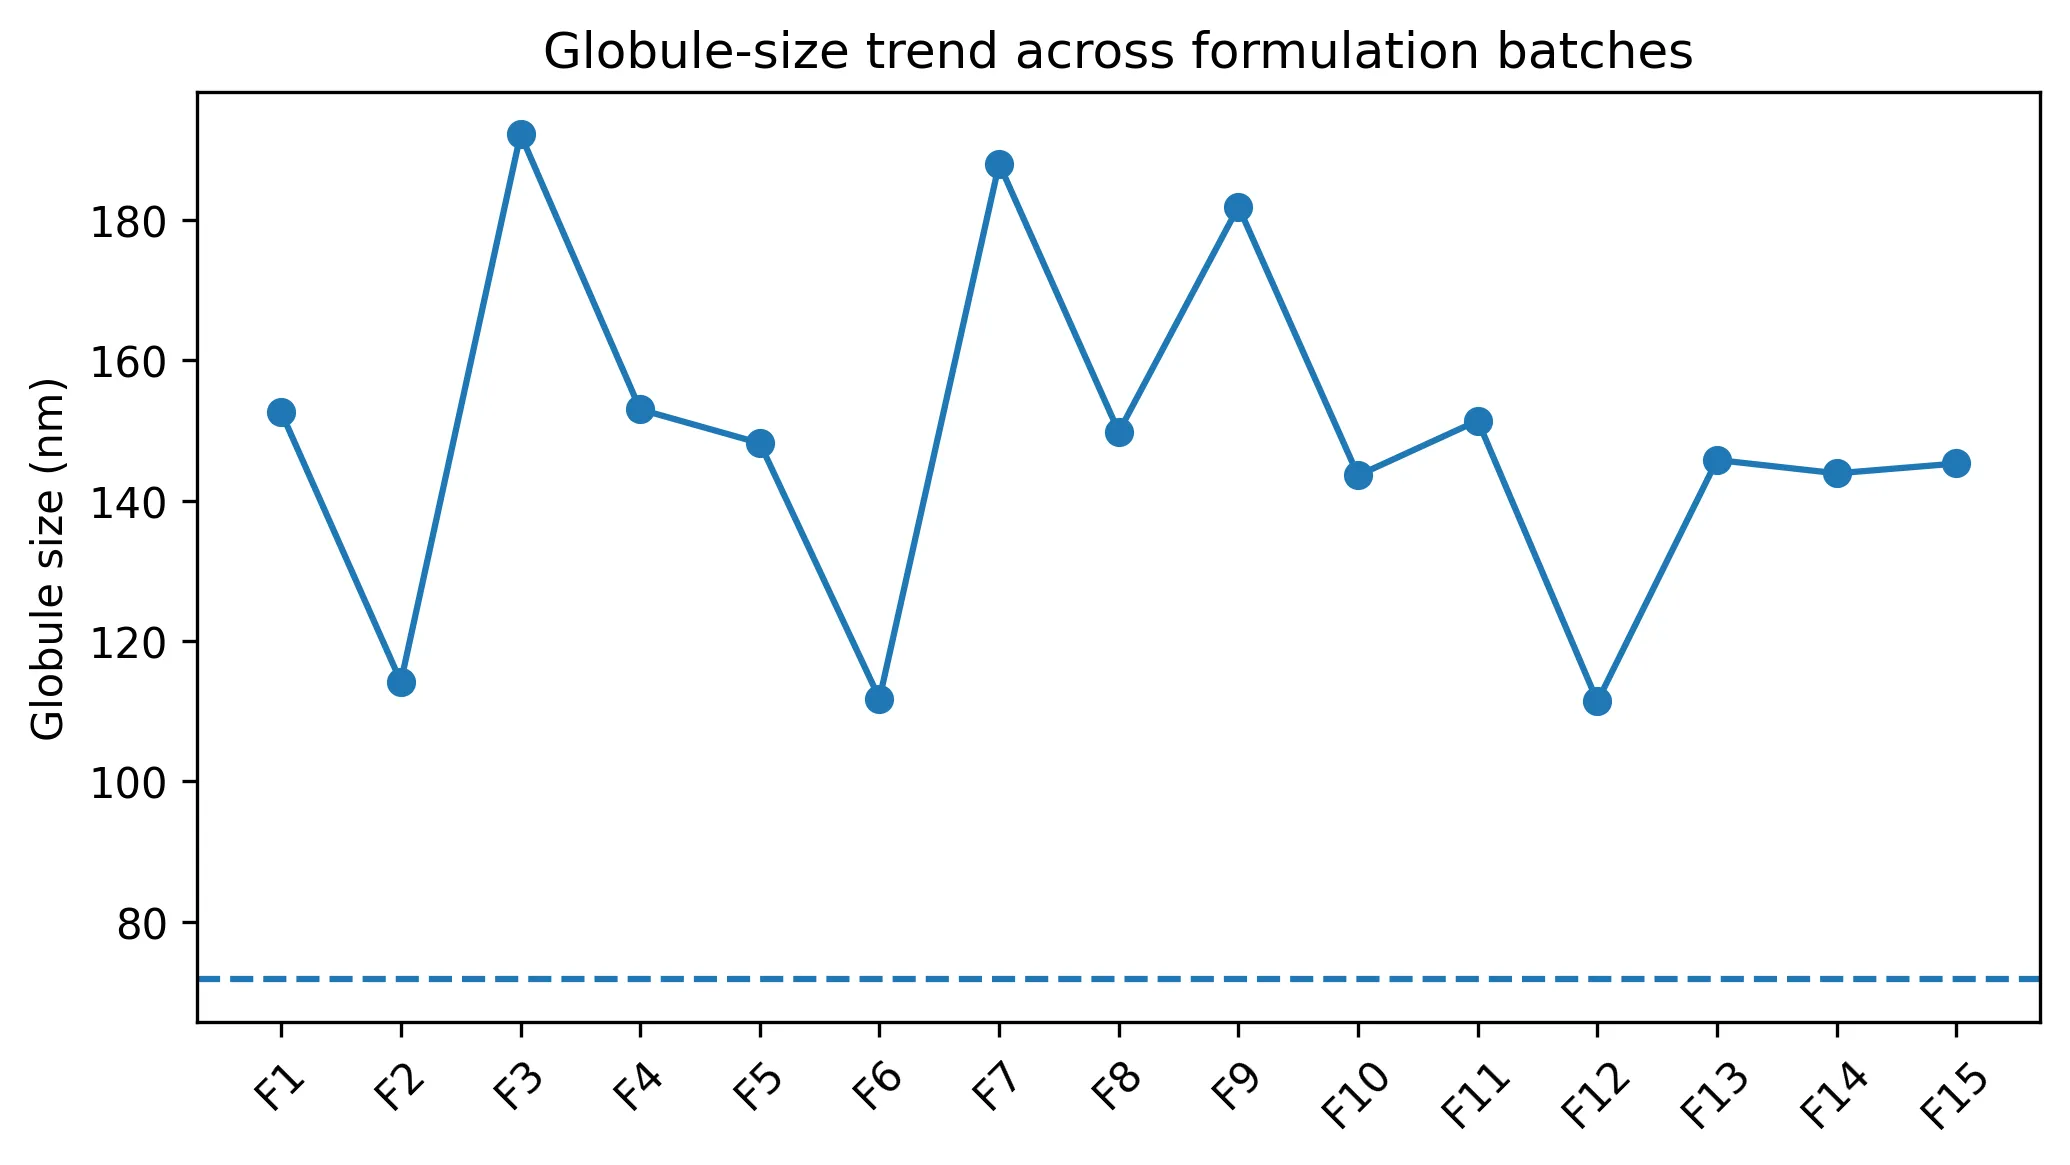
Fig. 3: Globule-size distribution trend across formulation batches.
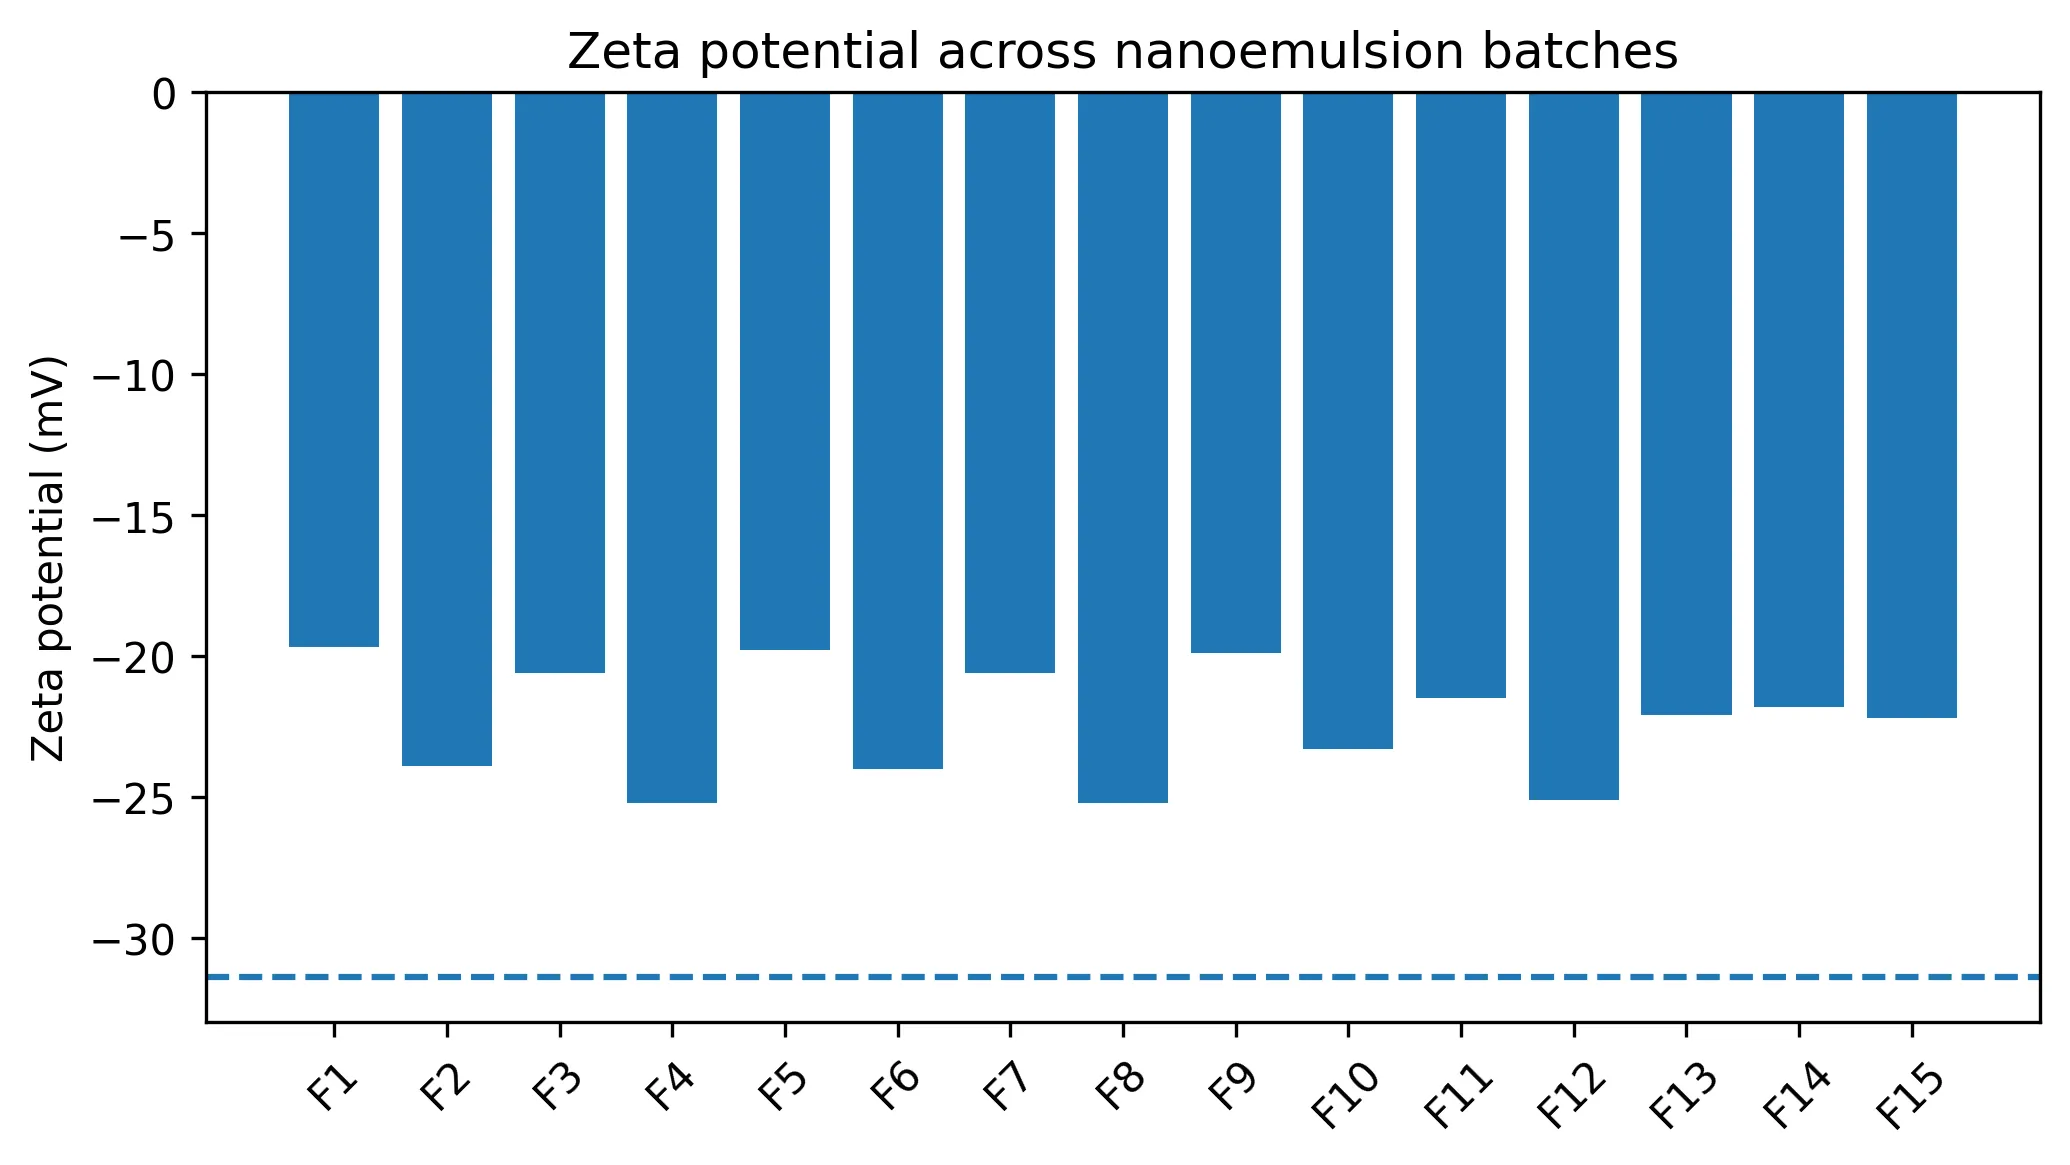
Fig. 4: Zeta potential values across nanoemulsion batches.
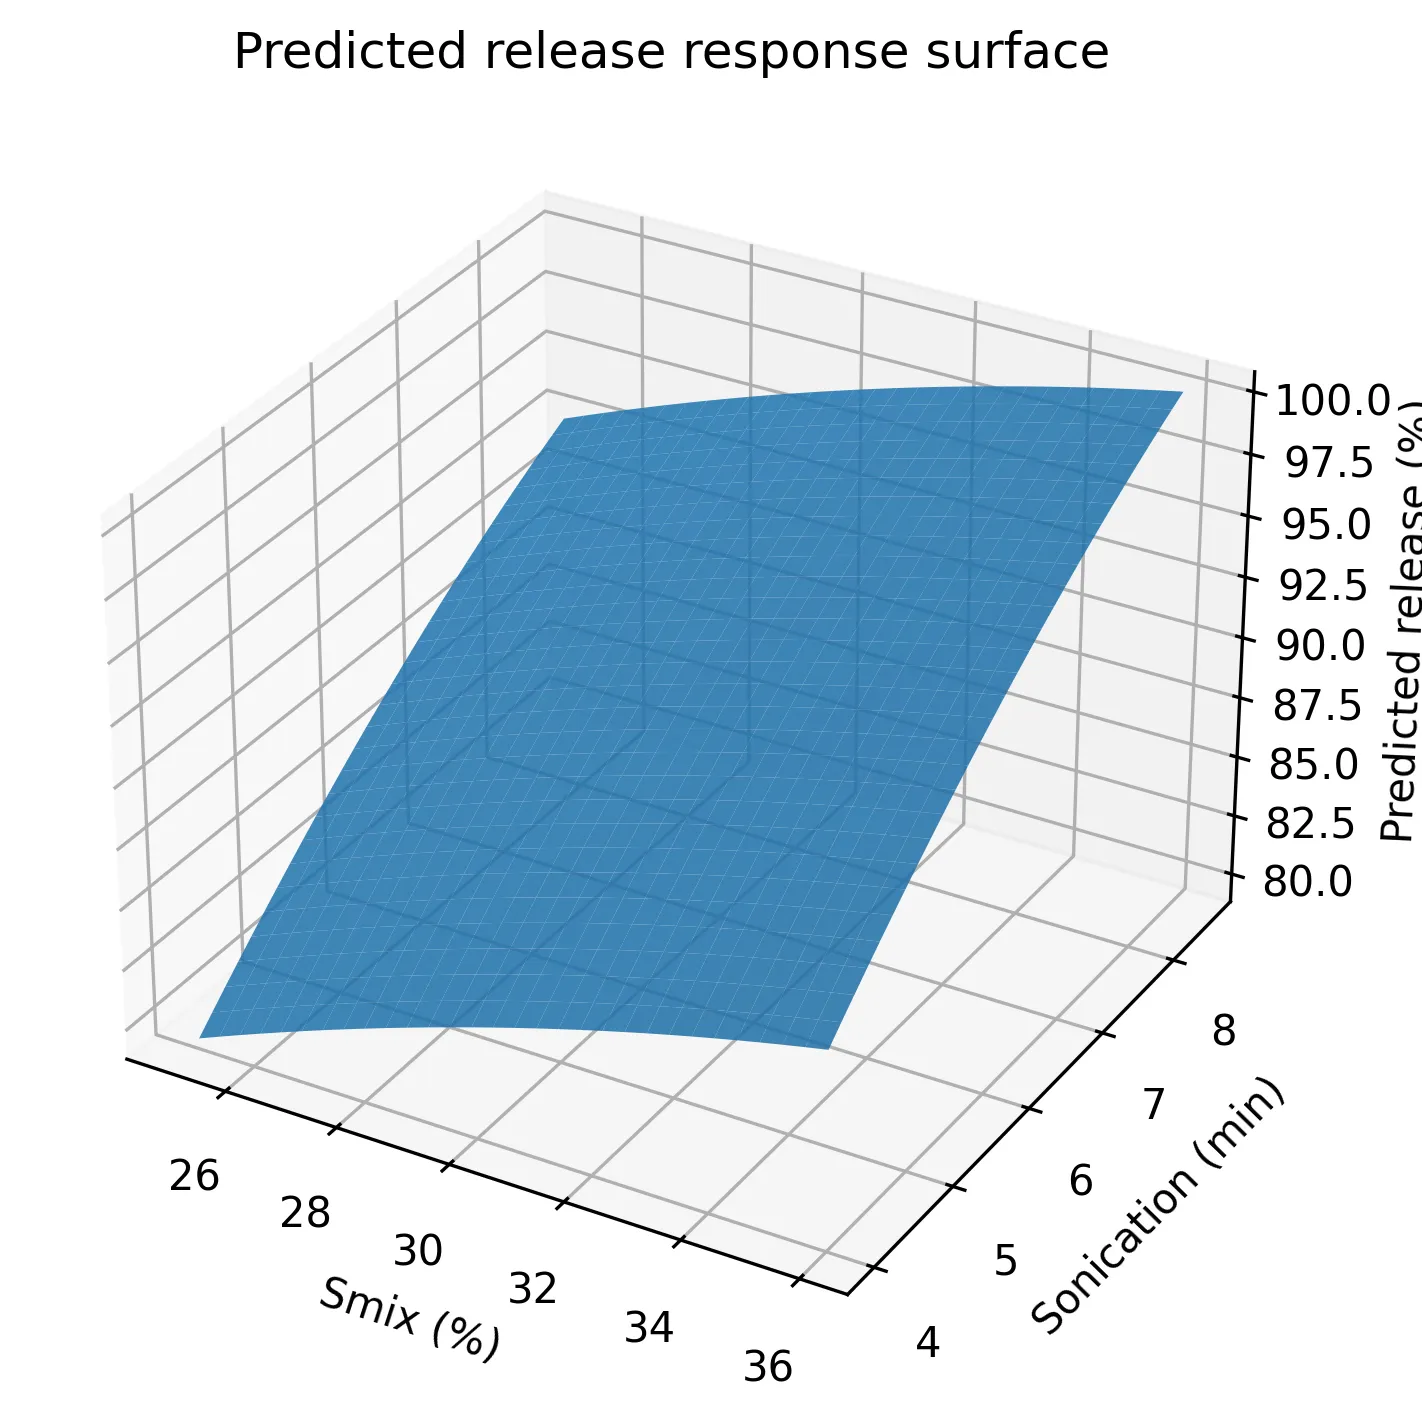
Fig. 5: Response surface showing predicted release as a function of Smix and sonication time.
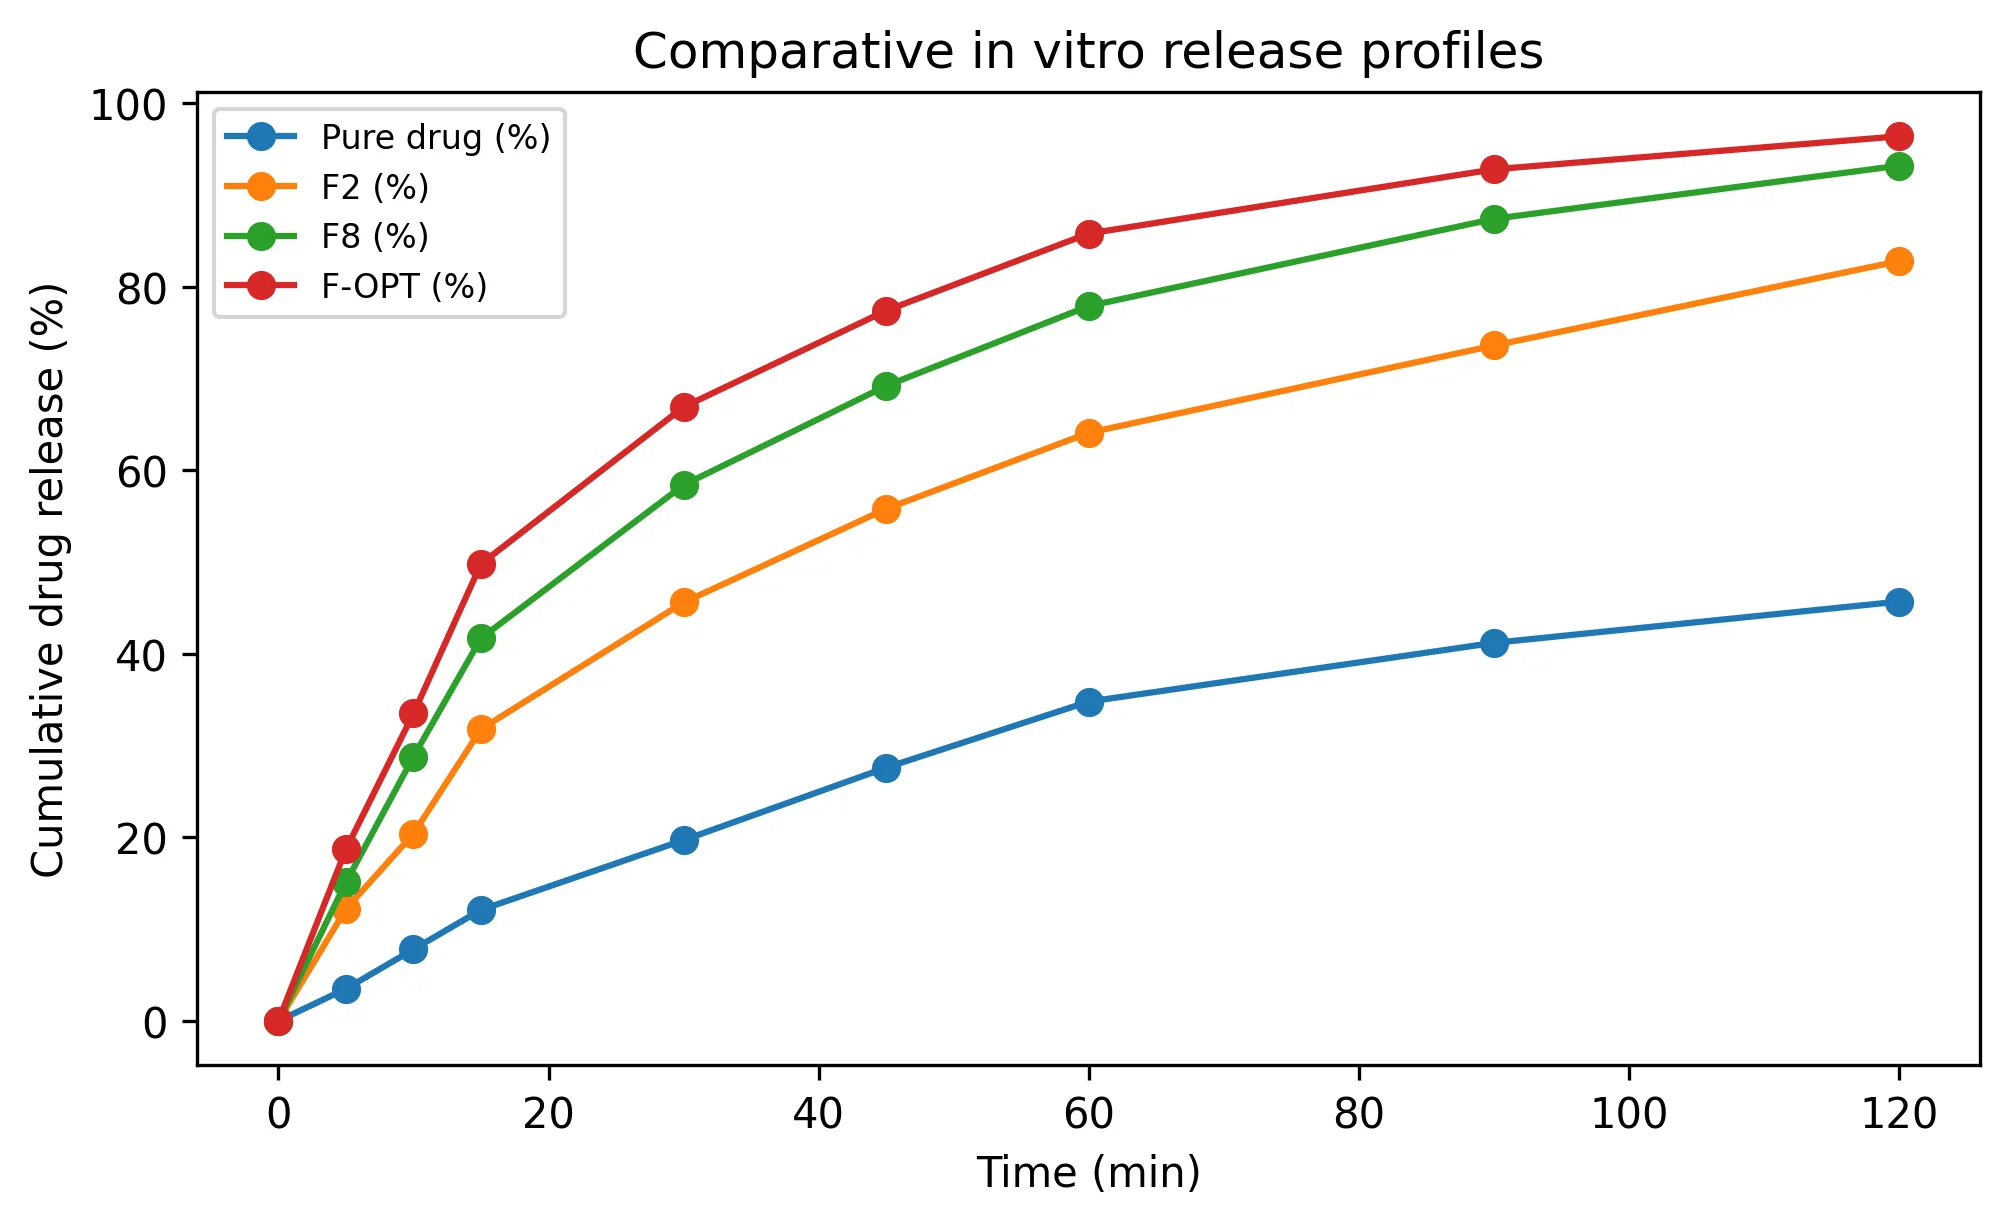
Fig. 6: Comparative in vitro release profiles for pure drug, intermediate formulations and optimized nanoemulsion.
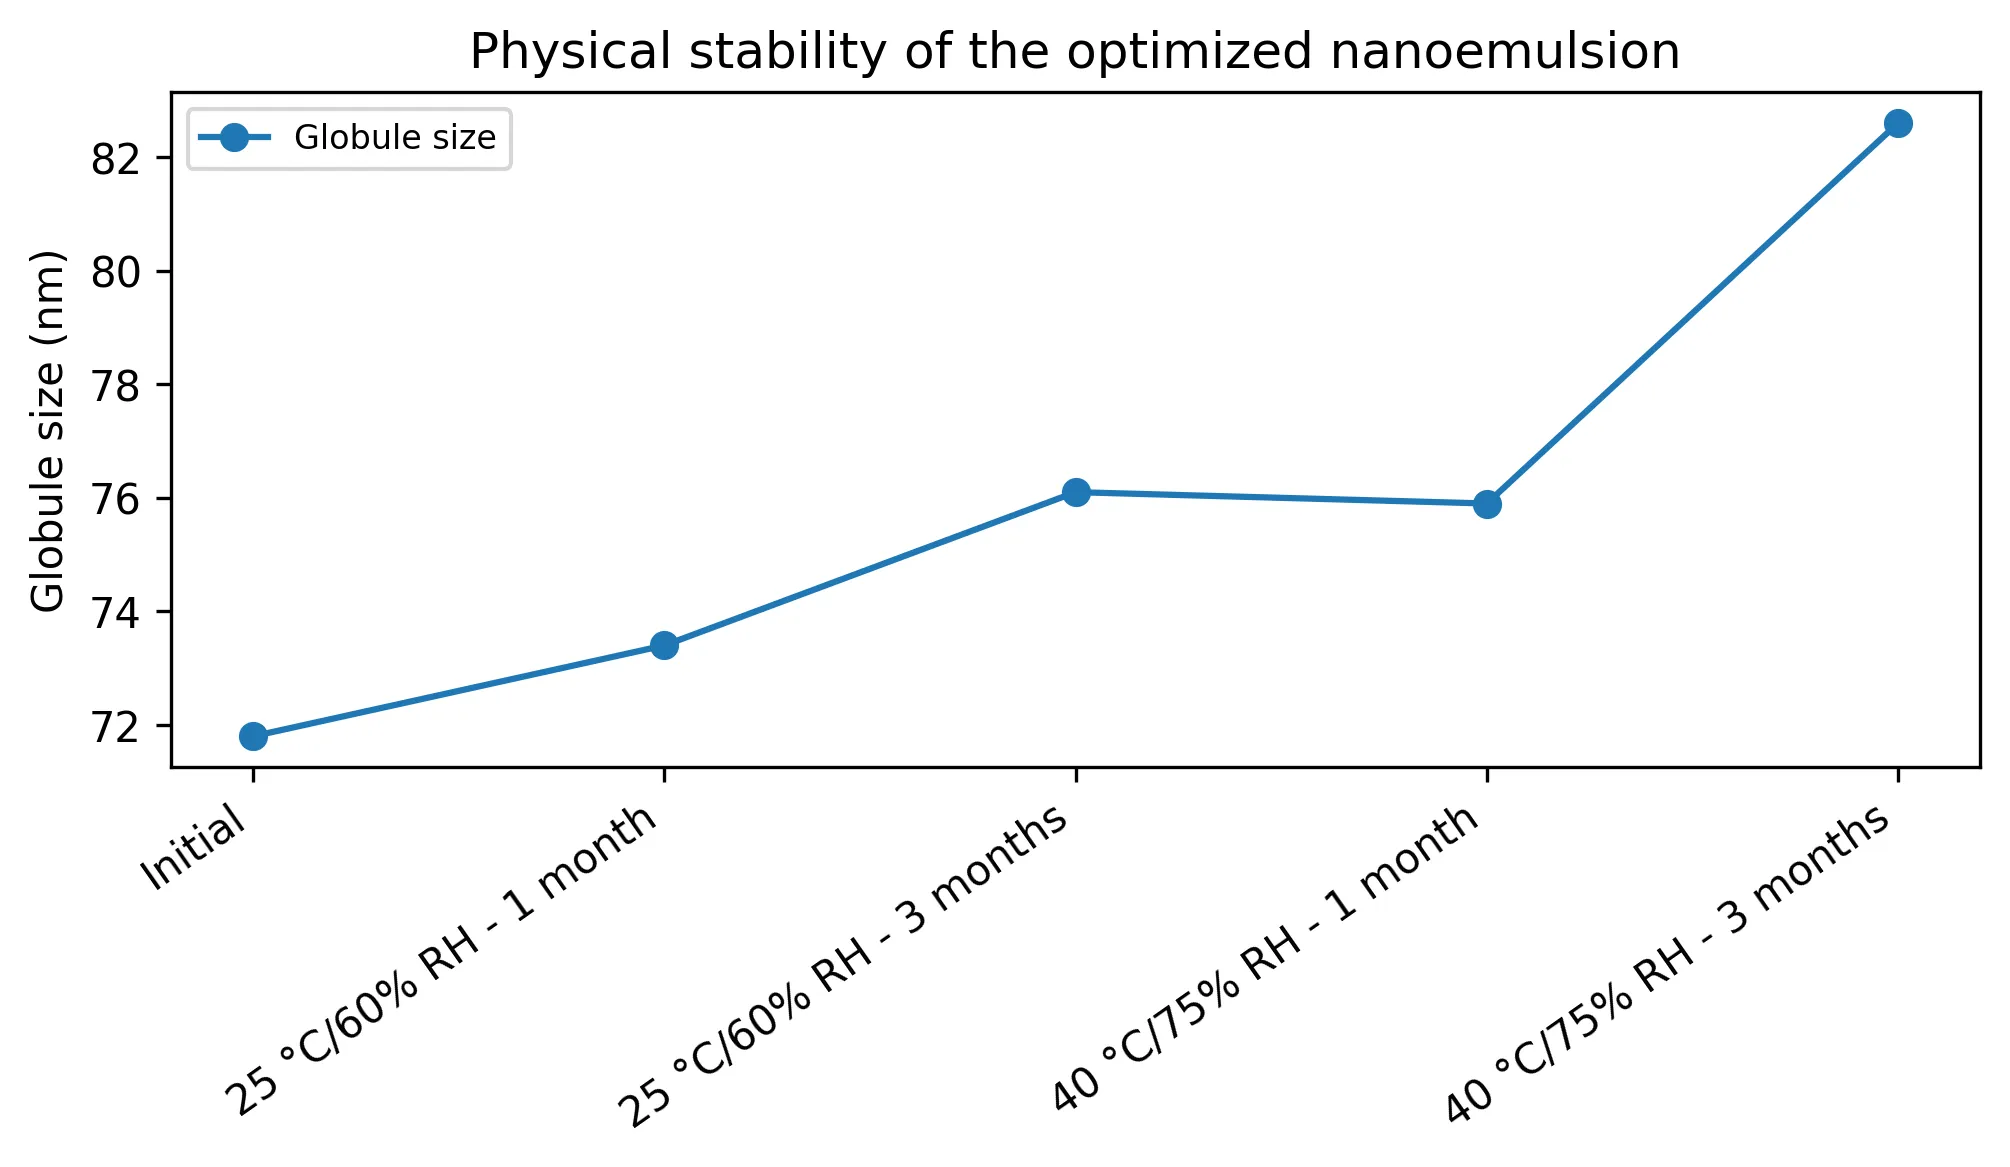
Fig. 7: Stability-related change in globule size of the optimized nanoemulsion.


Chetan Jain, Dr. Viabhavkumar Jagtap, Formulation, Optimization and In Vitro Evaluation of Nanoemulsion-Based Delivery Systems for BCS Class II Antidiabetic Drugs: A Solubility, Dissolution and Stability Analysis, Int. J. of Pharm. Sci., 2026, Vol 4, Issue 6, 7763-7773, https://doi.org/10.5281/zenodo.21067402
 10.5281/zenodo.21067402