

We use cookies to ensure our website works properly and to personalise your experience. Cookies policy
1Department of Oils, Lipid Science & Technology, CSIR - Indian Institute of Chemical Technology, Hyderabad – 500007, Telangana, India.
2Department of Pharmaceutical Chemistry, University College of Pharmaceutical Sciences, Acharya Nagarjuna University, Guntur - 522 510, Andhra Pradesh, India.
Psoralea corylifolia L. is a medicinal plant containing valuable bioactive constituents, including bakuchiol and triglycerides. This study aimed to optimize extraction, characterize bakuchiol, determine fatty acid composition, and evaluate antioxidant activity. Five Soxhlet extraction protocols using solvents of varying polarities were investigated. Sequential extraction with methanol and aqueous methanol yielded the highest crude extract recovery (approximately 35.6%). However, hexane extraction followed by chloroform–methanol (2:1, v/v) extraction was selected for further investigation because of its suitability for enriching lipophilic constituents. Silica gel column chromatography separated triglyceride-rich and bakuchiol-rich fractions. Fatty acid profiling revealed linoleic acid (28.2%) and oleic acid (26.6%) as the predominant unsaturated fatty acids, while palmitic acid (23.2%) was the major saturated fatty acid. Bakuchiol identity was supported by GC–FID, GC–MS, FT-IR, and NMR analyses. Antioxidant activity was evaluated using the DPPH radical scavenging assay, with butylated hydroxytoluene (BHT) as the reference. Bakuchiol exhibited concentration-dependent activity, showing greater scavenging than BHT at 0.25–2.0 mM, whereas BHT was more active at higher concentrations. The preliminary IC?? estimate for bakuchiol requires confirmation at lower concentrations. These findings highlight P. corylifolia seeds as potential sources of bakuchiol and triglyceride-rich fractions for further investigation in cosmetic and pharmaceutical applications.
Psoralea corylifolia L. (syn. Cullen corylifolium), belonging to the family Fabaceae, is an important medicinal plant widely distributed across India, China, and southern Africa [1-3] (Figure 1). Commonly known as Babchi or Bakuchi, it has traditionally been used to treat vitiligo, chronic skin disorders, and various inflammatory, gastrointestinal, and genitourinary ailments. Its seeds contain diverse phytoconstituents, including coumarins, flavonoids, terpenoids, phenolic compounds, and a substantial lipid fraction [4-6]. Among these constituents, bakuchiol (BAK; Figure 1D), a characteristic meroterpene phenol, has attracted considerable attention because of its diverse pharmacological properties [7–12]. Bakuchiol was first isolated from Psoralea glandulosa L. by Mehta et al. in 1966 [13, 14]. It has been reported to exhibit antioxidant, antimicrobial, anti-inflammatory, anti-aging, estrogen-like, and antitumor activities [15–18]. Studies have also demonstrated its protective effects in experimental models of acute kidney injury, acute lung injury, and neuroinflammation [19–22]. Furthermore, BAK has demonstrated notable biological activity in lipopolysaccharide (LPS)-stimulated BV-2 microglial and HT22 hippocampal cells compared with other metabolites of P. corylifolia [23].
Figure 1: Photographs of Psoralea corylifolia L. (a) Whole Plant, (B) Flowers, (C) Seeds, and (D) Bakuchiol.
In addition to its phenolic constituents, the seed oil of P. corylifolia represents an important component that warrants further investigation. The nutritional, physicochemical, and industrial properties of plant oils are largely determined by their fatty acid composition, particularly the relative proportions of saturated and unsaturated fatty acids. Palmitic, stearic, oleic, linoleic, and α-linolenic acids are common constituents of plant-derived oils. Therefore, comprehensive fatty acid profiling is essential for characterizing P. corylifolia seed oil and assessing its potential applications. Despite extensive research on the secondary metabolites and pharmacognostic properties of this plant [24–27], studies integrating detailed fatty acid profiling with targeted BAK isolation, structural characterization, and antioxidant evaluation remain limited. Accordingly, the present study investigates the fatty acid composition of P. corylifolia seed oil alongside the isolation, structural characterization, and antioxidant evaluation of BAK. Soxhlet extraction using different solvents was performed to evaluate extraction efficiency, followed by silica gel column chromatography to separate the lipid and phenolic fractions. The fatty acid composition was determined by GC following conversion of the lipid fraction into fatty acid methyl esters (FAMEs). The isolated BAK was characterized using GC and GC–MS, FT-IR, 1H and 13C NMR techniques. Its antioxidant potential was evaluated using the DPPH free-radical scavenging assay, with BHT as the reference antioxidant. This integrated approach provides complementary information on the lipid and phenolic constituents of P. corylifolia, contributing to a better understanding of its chemical composition, extraction characteristics, and antioxidant potential. The findings may support further research on phytochemical characterization, standardization, and the potential applications of this medicinal plant in the pharmaceutical, cosmetic, and related industries.
MATERIALS AND METHODS
2.1. Plant Material and Reagents
Seeds of Psoralea corylifolia L. were procured from a local seed supplier in Hyderabad, India. Analytical-grade solvents, including hexane, ethyl acetate, methanol, and chloroform, were purchased from SDFCL, Mumbai, India. Silica gel (100–200 mesh) for column chromatography was obtained from Merck Pvt. Ltd., Mumbai, India. Silica gel GF₂₅₄ plates were used for thin-layer chromatographic (TLC) analysis. 2,2-Diphenyl-1-picrylhydrazyl (DPPH) and butylated hydroxytoluene (BHT) were purchased from Sigma-Aldrich, St. Louis, USA. All reagents were used as received unless otherwise specified.
2.2. Soxhlet Extraction of Psoralea Corylifolia Seeds
Powdered P. corylifolia seeds (50 g) were subjected to Soxhlet extraction using five different protocols (I–V) to evaluate solvent-dependent extraction efficiency and selectivity. The protocols involved sequential extraction with solvents of different polarities or extraction using a single solvent system.
In Protocol I, the seed powder was extracted with hexane (300 mL) for 6 h to obtain Extract I-A. The residual material was subsequently extracted with chloroform–methanol (2:1, v/v; 300 mL) for an additional 6 h to obtain Extract I-B. In Protocol II, the seed powder was extracted with methanol (300 mL) for 6 h to obtain Extract II-A, followed by extraction of the residue with hexane (300 mL) for another 6 h to obtain Extract II-B. In Protocol III, the seed powder was initially extracted with 20% aqueous methanol (300 mL) for 6 h to obtain Extract III-A, followed by extraction of the residual material with hexane (300 mL) for a further 6 h to obtain Extract III-B. In Protocol IV, the seed powder was extracted using chloroform–methanol (2:1, v/v; 600 mL) as a single solvent system. In Protocol V, acetone (600 mL) was used for single-solvent extraction. Following extraction, the solvents were removed under reduced pressure using a rotary evaporator at a controlled temperature. The resulting crude extracts were weighed and stored appropriately until further analysis.
The extraction yield (%) was calculated as the percentage of dried extract recovered relative to the initial mass of seed powder:
Extraction Yield (%) = Wt. of dried extract (g) / Wt. of seed powder (g) × 100
For the sequential extraction protocols (I–III), the total extraction yield was calculated as the sum of the yields of the respective extracts obtained from the first and second extraction steps.
2.3. Thin-Layer Chromatographic Analysis
The crude extracts obtained from the different extraction protocols were analyzed by TLC using silica gel GF₂₅₄ plates (5 × 5 cm; 0.2 mm thickness; Merck, Darmstadt, Germany). Commercial TLC sheets were cut to the required dimensions before use. Appropriate quantities of the extracts were applied to the plates, which were developed using hexane–ethyl acetate (9:1, v/v) as the mobile phase. After development, the plates were dried, and the separated constituents were visualized in an iodine chamber. The retention factor (Rf) was calculated as the ratio of the distance travelled by an individual spot to the distance travelled by the solvent front:
Rf = Distance travelled by the spot/Distance travelled by the solvent front
Under the specified chromatographic conditions, the isolated lipophilic fraction and bakuchiol exhibited Rf values of 0.75 and 0.53, respectively. The TLC profiles were compared to assess the distribution and separation of constituents in extracts obtained using different solvent systems. Based on the extraction yields and chromatographic profiles, the hexane extract obtained in Protocol I (Extract I-A) was selected for further chromatographic separation because of its enrichment in non-polar constituents.
2.4. Column Chromatography of the Crude Hexane Extract
The crude hexane extract (Extract I-A) was subjected to silica gel column chromatography to separate its major constituents. Briefly, 1.0 g of the extract was loaded onto a column packed with silica gel (30 g; 100–200 mesh), corresponding to a stationary-phase-to-sample mass ratio of 30:1 (w/w). Elution was initiated with pure hexane, followed by a stepwise increase in mobile-phase polarity using ethyl acetate in hexane at concentrations ranging from 0.1% to 1.0% (v/v). The eluate was collected in 50 mL fractions, yielding a total of 25 fractions. The collected fractions were monitored by TLC, and those exhibiting similar chromatographic profiles were pooled. The pooled fractions were concentrated under reduced pressure, and the recovered residues were weighed and retained for further characterization. Based on the elution profile, fractions 1–5 contained predominantly pigment-like constituents, whereas fractions 6–10 were enriched in hydrocarbon-like components. Fractions 11–15, eluted with 0.5% ethyl acetate in hexane, were pooled to obtain the triglyceride-rich fraction. Fractions 16–20, eluted with 0.6% ethyl acetate in hexane, were pooled to obtain the bakuchiol-rich fraction. Fractions 21–25, eluted with 0.7–1.0% ethyl acetate in hexane, contained mixtures of later-eluting constituents. The fractional yield (%) was calculated relative to the initial mass of crude extract loaded onto the column:
Fraction yield (%) = Wf/Wl×100
where, Wf is the mass of the recovered fraction (g) and Wl is the mass of crude extract loaded onto the column (g).
2.5. Characterization of the Isolated Triglyceride Fraction
The triglyceride-rich fraction obtained by column chromatography was subjected to fatty acid composition analysis. The triglycerides were converted into their corresponding fatty acid methyl esters (FAMEs) using the methylation or transesterification procedure employed in the experiment. The resulting FAMEs were analyzed by gas chromatography coupled with a flame ionization detector (GC–FID) using a DB-225 capillary column (30 m × 0.25 mm internal diameter × 0.25 µm film thickness). The oven temperature was initially maintained at 160 °C for 2 min, increased to 230 °C at a rate of 5 °C min⁻¹, and maintained at 230 °C for 25 min. Helium was used as the carrier gas at a flow rate of 1.0 mL min⁻¹, with a split ratio of 50:1. Fatty acid components were evaluated by comparing their chromatographic retention times with those of a standard FAME mixture. Their relative abundances were determined from the corresponding chromatographic peak areas.
2.6. Structural Elucidation of Isolated Bakuchiol
The isolated bakuchiol obtained as a light-brown viscous liquid was characterized using gas chromatography (GC-FID), gas chromatography–mass spectrometry (GC–MS), Fourier-transform infrared spectroscopy (FT-IR), 1H and 13C nuclear magnetic resonance (1H & 13C NMR) spectroscopy and the data is presented in Table 1. GC–FID analysis was performed to determine the purity of bakuchiol in the isolated fraction using an HP-1 capillary column (30 m × 0.25 mm internal diameter × 0.25 µm film thickness). The oven temperature was initially maintained at 80 °C for 2 min and subsequently increased at a rate of 10 °C min⁻¹ to 300 °C, followed by a 20 min hold at 300 °C. Helium was used as the carrier gas at a flow rate of 1.0 mL min⁻¹, with a split ratio of 50:1. GC–MS analysis was performed using an Agilent 6890N Series gas chromatograph coupled to an Agilent 5973 mass spectrometer (Palo Alto, CA, USA). Mass spectra were acquired in electron ionization (EI) mode at 70 eV over an m/z range of 50–550. The ion source and quadrupole temperatures were maintained at 230 °C and 150 °C, respectively.
FT-IR spectra were recorded using a PerkinElmer Spectrum BX FT-IR spectrometer, with chloroform (CHCl₃) used as the solvent. The 1H and 13C NMR spectra were recorded at 300 K using a Bruker UXNMR spectrometer operating at 500 MHz for 1H NMR and 75 MHz for 13C NMR. Deuterated chloroform (CDCl₃) was used as the solvent, and tetramethylsilane (TMS) served as the internal standard. Chemical shifts (δ) are reported in parts per million (ppm), and coupling constants (J) are expressed in hertz (Hz). Signal multiplicities are abbreviated as follows: s, singlet; bs, broad singlet; d, doublet; dd, doublet of doublets; t, triplet; and m, multiplet.
Table 1: Spectral Data of Isolated Bakuchiol
| Spectroscopic technique | Spectral data |
|---|
| Physical state | Light-brown viscous liquid |
|---|
| 1H NMR (500 MHz, CDCl₃, δ ppm) | 1.19 (3H, s, H-16), 1.25 (2H, m, H-10), 1.58 (3H, s, H-15), 1.62 (3H, s, H-14), 1.95 (2H, m, H-11), 5.02 (2H, m, H-18), 5.11 (1H, br t, H-12), 5.88 (1H, dd, J = 17.5, 10.6 Hz, H-17), 6.05 (1H, d, J = 16.1 Hz, H-8), 6.25 (1H, d, J = 16.1 Hz, H-7), 6.76 (2H, d, J = 8.6 Hz, H-3/5), 7.24 (2H, d, J = 8.6 Hz, H-2/6) |
|---|
| 13C NMR (75 MHz, CDCl₃, δ ppm) | 17.6 (C-15), 23.4 (C-11), 25.6 (C-14), 30.9 (C-16), 41.2 (C-9), 42.4 (C-10), 111.8 (C-18), 115.3 (C-3,5), 124.7 (C-12), 126.4 (C-7), 127.2 (C-2,6), 130.5 (C-1), 131.2 (C-13), 135.6 (C-8), 145.9 (C-17), 154.8 (C-4) |
|---|
| FT-IR (cm⁻¹) | 3376, 3081, 3024, 2966, 1609, 1512, 1235 |
|---|
| ESI-MS (m/z) | 256 [M]⁺ |
|---|
2.7. DPPH Free Radical Scavenging Assay
2.7.1 Preparation of standard solutions
A 0.1 mM DPPH solution was prepared by dissolving 3.94 mg of DPPH in 100 mL of ethanol. The solution was protected from light and freshly prepared or stored under appropriate dark conditions before use.
A 2 mM stock solution of BHT was prepared by accurately weighing 11.02 mg of BHT and dissolving it in ethanol in a 25 mL volumetric flask. The volume was adjusted to the calibration mark, and the solution was mixed thoroughly.
Similarly, a 2 mM stock solution of bakuchiol was prepared by dissolving 12.82 mg of the isolated compound in ethanol in a 25 mL volumetric flask. The volume was adjusted to the calibration mark, and the solution was mixed thoroughly.
2.7.2 Antioxidant assay
The antioxidant activity of isolated bakuchiol was evaluated using the DPPH radical scavenging assay according to previously reported methods [4, 28, 29]. Briefly, an appropriate volume of the test solution was mixed with 2 mL of DPPH solution (0.1 mM), and the final volume was adjusted to 3 mL using methanol. Different concentrations of bakuchiol were prepared and analyzed in the same manner. BHT was used as the reference antioxidant and tested at corresponding concentrations. The reaction mixtures were incubated at 37 °C for 40 min in the dark. After incubation, the absorbance was measured at 517 nm using a UV–visible spectrophotometer. A control containing 2 mL of DPPH solution and 1 mL of methanol was used to determine the absorbance of the DPPH radical in the absence of the test compound. Each sample was analyzed in triplicate, and the mean absorbance was used to calculate the percentage free radical scavenging activity (FRSA) according to the following equation:
FRSA (%) = Ac−As/Ac×100
where, Ac is the absorbance of the control containing DPPH without the test compound, and As is the absorbance of the reaction mixture containing the test compound after incubation for 40 min.
The half-maximal inhibitory concentration (IC₅₀) was estimated from the DPPH radical scavenging data as the concentration required to achieve 50% radical scavenging activity. Where the measured values bracketed 50% inhibition, linear interpolation between the two adjacent concentrations was used to estimate the IC₅₀:
IC50 = C1 + (50−R1/R2−R1) (C2−C1)
where, C1 and C2 are the concentrations immediately below and above 50% scavenging activity, respectively, and R1 and R2 are their corresponding mean scavenging percentages. The estimated IC₅₀ values were interpreted as preliminary estimates where the available concentration range did not adequately define the response around 50% inhibition.
RESULTS AND DISCUSSION
3.1. Extraction of Constituents and Evaluation of Extraction Protocols
The chemical constituents of Psoralea corylifolia seeds were investigated using five Soxhlet extraction protocols (I–V), comprising sequential and single-solvent extraction systems with solvents of different polarities. The chemical constituents of Psoralea corylifolia seeds were investigated using five Soxhlet extraction protocols (I–V), comprising sequential and single-solvent extraction systems of varying polarities. The extraction schemes, recovered extract masses, and comparative yields are presented in Figure 2 and Table 2. The extraction yield varied depending on the solvent system and extraction sequence. Protocols II and III afforded the highest cumulative extraction yields, approximately 35.6% each. In Protocol II, methanol extraction yielded 22.44% of crude extract, followed by recovery of an additional 13.12% using hexane. Similarly, Protocol III yielded 27.68% with 20% aqueous methanol, followed by an additional 7.86% using hexane. The combined yield of Protocol III was approximately 35.5%. Protocols I, IV, and V afforded total extraction yields of 28.0%, 26.5%, and 25.0%, respectively.
The relatively high yields obtained using methanol and aqueous methanol may be attributed to their ability to extract a broad range of polar and moderately polar constituents. However, the total crude extract yield alone does not indicate the selectivity of an extraction procedure toward specific target compounds. Polar solvents may also extract additional constituents, resulting in chemically complex mixtures. To evaluate differences in extract composition, the crude extracts were analyzed by thin-layer chromatography (TLC) using silica gel GF₂₅₄ plates and hexane–ethyl acetate (9:1, v/v) as the mobile phase. The resulting chromatographic profiles showed variations in the number, intensity, and distribution of spots among the extraction protocols, indicating differences in the composition of the recovered extracts. Sequential extraction also enabled the recovery of constituents with different solvent affinities in separate fractions.
Among the investigated protocols, Protocol I was selected for further investigation because the initial hexane extract (Extract I-A) provided a suitable starting material for the isolation of lipophilic constituents. Its selection was based on the intended separation of non-polar constituents rather than on the highest total extraction yield. The subsequent chloroform–methanol extract (Extract I-B) represented the fraction recovered using the more polar solvent mixture. Accordingly, Extract I-A was subjected to silica gel column chromatography for further fractionation and characterization of the triglyceride-rich and bakuchiol-rich fractions.
Table 2: Comparative Soxhlet Extraction Yields of P. corylifolia Seeds.
| 6 h 1st Extraction 6 h 2nd Extraction |
|---|
Figure 2: Soxhlet Extraction Protocols of P. corylifolia Seeds.
| Extraction Step | Protocol I | Protocol II | Protocol III | Protocol IV | Protocol V |
|---|---|---|---|---|---|
| First extraction | Hexane (I-A), 7.30 g | Methanol (II-A), 11.22 g | 20% Aq. methanol (III-A), 13.84 g | Chloroform–methanol (2:1, v/v), 13.23 g | Acetone (V), 12.50 g |
| Second extraction | Chloroform–methanol (2:1, v/v) (I-B), 6.71 g | Hexane (II-B), 6.56 g | Hexane (III-B), 3.93 g | NA | NA |
| Total extraction yield (%) | 28.0 | 35.6 | 35.5 | 26.5 | 25.0 |
| TLC samples analyzed | I-A and I-B | II-A and II-B | III-A and III-B | IV | V |
NA, Not applicable. Extraction yields are expressed as percentages of the initial seed powder mass. For sequential extraction protocols (I–III), the total yield represents the combined mass of extracts obtained in both extraction steps.
3.2. Column Chromatographic Separation of the Hexane Extract
The crude hexane extract (Extract I-A) was subjected to silica gel column chromatography to separate its major constituents. A 1.0 g portion of the crude extract was loaded onto a silica gel column containing 30 g of stationary phase, corresponding to a stationary-phase-to-sample mass ratio of 30:1 (w/w). Stepwise gradient elution was performed using hexane with increasing concentrations of ethyl acetate (0.1–1.0%, v/v). A total of 25 fractions, each with a volume of 50 mL, were collected and monitored by TLC. The fractionation profile and corresponding yields are presented in Table 2. Fractions 1–5, eluted with pure hexane, contained pigment-like constituents and accounted for 3.4% of the loaded extract. Fractions 6–10, eluted with 0.1–0.4% ethyl acetate in hexane, were enriched in hydrocarbon-like constituents and represented 4.5% of the loaded mass.
Table 2: Column Chromatographic Fractionation of the Crude Hexane Extracts of P. corylifolia Seeds.
| Fraction No. | Eluent Composition (v/v) | Isolated Constituents | Fraction Yield (%)* |
|---|---|---|---|
| 1-5 | Hexane | Pigment-like constituents | 3.4 |
| 6-10 | 0.1–0.4% EtOAc/ Hexane | Hydrocarbon-like constituents | 4.5 |
| 11-15 | 0.5% EtOAc / Hexane | Triglyceride-rich fraction | 33.3 |
| 16-20 | 0.6% EtOAc / Hexane | Bakuchiol-rich fraction | 53.2 |
| 21-25 | 0.7–1.0% EtOAc / Hexane | Polar constituents | 5.6 |
*Fraction yield is expressed as a percentage of the initial crude extract mass loaded onto the column.
Fractions 11–15, eluted with 0.5% ethyl acetate in hexane, yielded the triglyceride-rich fraction, corresponding to 33.3% of the initial crude extract mass. Increasing the ethyl acetate concentration to 0.6% resulted in the recovery of the bakuchiol-rich fraction in fractions 16–20, which accounted for 53.2% of the loaded mass. The final fractions, eluted using 0.7–1.0% ethyl acetate in hexane, contained later-eluting constituents and accounted for the remaining 5.6%. The combined fraction yields accounted for approximately 100% of the mass loaded onto the column. The chromatographic separation therefore provided distinct fractions enriched in different classes of lipophilic constituents. The triglyceride-rich and bakuchiol-rich fractions were selected for further characterization. The fractional yield of the bakuchiol-rich fraction represents the total recovered fraction mass and should not be interpreted as the purity or absolute yield of bakuchiol itself.
3.2.1. Characterization of the isolated triglyceride fraction
The triglyceride-rich fraction obtained by silica gel column chromatography was recovered as a colourless liquid and accounted for approximately 33.3% of the crude hexane extract loaded onto the column. Its fatty acid composition was investigated by converting the constituent triglycerides into their corresponding fatty acid methyl esters (FAMEs), followed by chromatographic analysis and the resulting fatty acid profile is presented in Table 3.
Table 3: Fatty Acid Composition of the Isolated Triglyceride-Rich Fraction from P. corylifolia Seeds.
| S. No | Fatty Acid | Composition (wt.%) |
|---|---|---|
| 1 | Lauric acid (12:0) | 0.6 |
| 2 | Myristic acid (14:0) | 0.2 |
| 3 | Palmitic acid (16:0) | 23.2 |
| 4 | Stearic acid (18:0) | 10.8 |
| 5 | Oleic acid (18:1) | 26.6 |
| 6 | Linoleic acid (18:2) | 28.2 |
| 7 | Linolenic acid (18:3) | 6.5 |
| 8 | Arachidic acid (20:0) | 1.8 |
| 9 | Gondoic acid (20:1) | 0.3 |
| 10 | Behnic acid (22:0) | 0.9 |
| 11 | Lignoceric acid (24:0) | 0.9 |
Linoleic acid (18:2) was the predominant fatty acid, accounting for 28.2 wt.%, followed by oleic acid (18:1) at 26.6 wt.% and palmitic acid (16:0) at 23.2 wt.%. Stearic acid (18:0) represented 10.8 wt.%, while linolenic acid (18:3) accounted for 6.5 wt.%. The remaining fatty acids, including lauric, myristic, arachidic, gondoic, behenic, and lignoceric acids, occurred at comparatively lower proportions. Based on the reported composition, unsaturated fatty acids accounted for approximately 61.6 wt.% of the total fatty acid profile, whereas saturated fatty acids represented approximately 38.4 wt.%. The predominance of unsaturated fatty acids provides useful information about the lipid composition of P. corylifolia seeds. Linoleic acid, an essential omega-6 fatty acid, contributes to cellular membrane structure and epidermal barrier function, whereas oleic acid influences the physicochemical properties of lipid-based formulations. The coexistence of saturated and unsaturated fatty acids may also influence the physical and oxidative properties of the lipid fraction. These compositional findings suggest that the isolated triglyceride-rich fraction warrants further investigation for potential applications in cosmetic and pharmaceutical formulations. However, its suitability as a formulation ingredient will depend on additional assessments of oxidative stability, compatibility, and performance.
3.2.2. Structural elucidation of isolated bakuchiol
The bakuchiol-rich fraction was recovered from fractions 16–20 as a pale-brown, viscous oil. Its identity was investigated using GC–FID, GC–MS, FT-IR, and NMR spectroscopy (Table 1), and the results were compared with previously reported spectral data for bakuchiol [14, 30].
FT-IR analysis. The FT-IR spectrum of the isolated compound (Figure 3) exhibited a prominent absorption band at 3425 cm⁻¹, consistent with O–H stretching of a phenolic hydroxyl group. Bands at 2965 and 2925 cm⁻¹ were assigned to aliphatic C–H stretching vibrations. An absorption band at 968 cm⁻¹ was consistent with out-of-plane bending associated with a trans-disubstituted alkene. Collectively, these absorption features supported the presence of a phenolic group, aliphatic chains, and an unsaturated structure in the isolated compound.
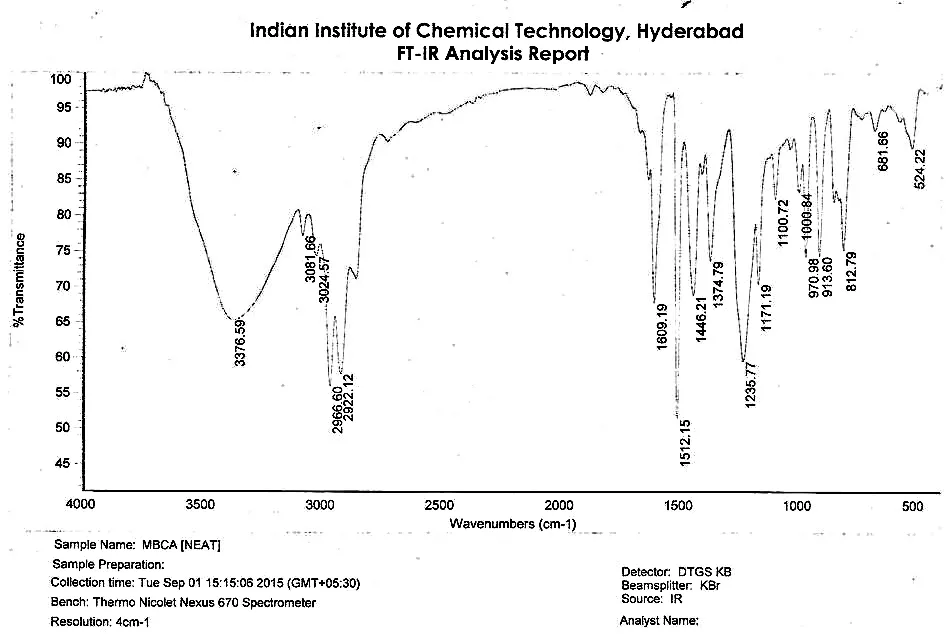
Figure 3: FT-IR Spectrum of Isolated Bakuchiol.
GC–FID and GC–MS analysis. The GC–FID chromatogram (Figure 4a) showed a major peak at a retention time of 17.32 min, accounting for approximately 96% of the total integrated peak area. This result indicated that the isolated fraction was highly enriched in the principal chromatographic component. GC–MS analysis under electron ionization conditions (70 eV) produced a molecular ion at m/z 256, consistent with the molecular formula C₁₈H₂₄O and the expected molecular mass of bakuchiol. The mass spectrum also contained fragment ions at m/z 241 and 213, together with a base peak at m/z 173. These fragmentation features were considered alongside the chromatographic and spectroscopic findings to support the proposed identity of the isolated compound.
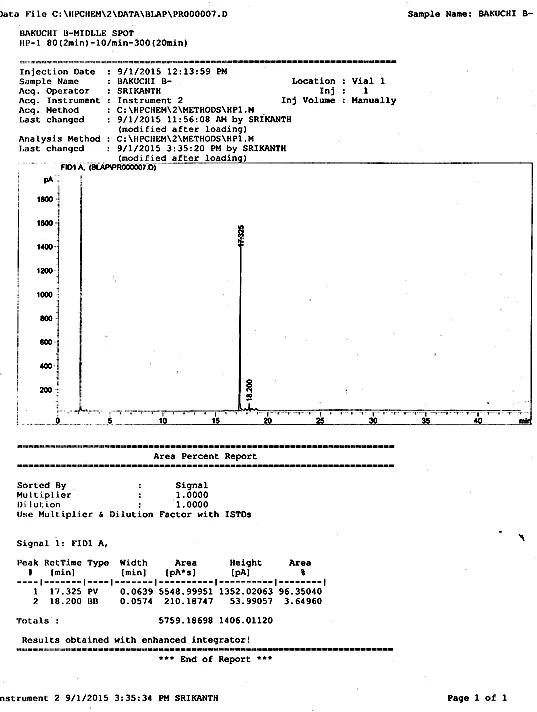
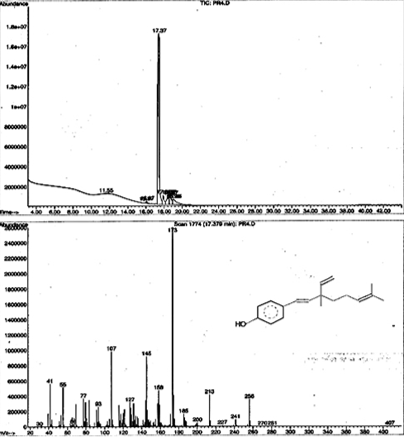
Figure 4: (A) GC–FID Chromatogram and (B) GC–ms Chromatogram and Mass Spectrum of Isolated Bakuchiol.
NMR spectral analysis. The 1H and 13C NMR spectra recorded in CDCl₃ were evaluated against reported spectral data for bakuchiol [14, 30]. The aromatic region of the 1H NMR spectrum showed two doublets at δ 7.24 (2H, d, J = 8.6 Hz) and δ 6.76 (2H, d, J = 8.6 Hz), consistent with the proton environments of a para-disubstituted aromatic ring. The corresponding 13C NMR signals included aromatic carbon resonances at δ 127.3 and 115.3 ppm, together with a phenolic carbon resonance at approximately δ 154.5–154.8 ppm.
Signals in the olefinic region were consistent with the presence of multiple carbon–carbon double bonds. Two resonances reported at δ 6.25 and 6.05 ppm, each appearing as a doublet with a coupling constant of approximately 16.1 Hz, were consistent with a trans-configured disubstituted alkene. Additional olefinic signals were observed at δ 5.11 ppm and in the region of δ 5.02–5.88 ppm, corresponding to other unsaturated portions of the proposed structure. The aliphatic region contained signals attributable to methylene, methine, and methyl groups associated with the unsaturated side chain. The overall pattern of aromatic, olefinic, and aliphatic resonances supported the proposed bakuchiol structure. Nevertheless, the final carbon and proton assignments should be verified against the original spectra and appropriate reference data before definitive structural assignments are made.
Table 4: Selected 1H and 13C NMR Data Reported for the Isolated Bakuchiol in CDCl₃.
| S. No | Position | δC (ppm) | δH (ppm), Multiplicity in Hz | Structural Assignment |
|---|---|---|---|---|
| 1 | 1 | 130.5 | - | Quaternary aromatic carbon |
| 2 | 2,6 | 127.3 | 7.24 (2H, d, J = 8.6 Hz) | Aromatic CH |
| 3 | 3,5 | 115.3 | 6.76 (2H, d, J = 8.6 Hz) | Aromatic CH |
| 4 | 4 | 154.8 | - | Phenolic carbon |
| 5 | 7 | 126.4 | 6.25 (1H, d, J = 16.1 Hz) | Olefinic CH (trans) |
| 6 | 8 | 135.6 | 6.05 (1H, d, J = 16.1 Hz) | Olefinic CH (trans) |
| 7 | 9 | 41.2 | - | Aliphatic quaternary carbon |
| 8 | 10 | 42.4 | 1.25 (2H, m) | Methylene |
| 9 | 11 | 23.4 | 1.95 (2H, m) | Allylic methylene |
| 10 | 12 | 124.7 | 5.11 (1H, br t) | Olefinic CH |
| 11 | 13 | 131.2 | - | Olefinic quaternary carbon |
| 12 | 14 | 25.6 | 1.62 (3H, s) | Methyl group |
| 13 | 15 | 17.6 | 1.58 (3H, s) | Methyl group |
| 14 | 16 | 30.9 | 1.19 (3H, s) | Methyl group |
| 15 | 17 | 145.9 | 5.88 (1H, dd, J=17.5, 10.6 Hz) | Vinyl CH |
| 16 | 18 | 111.8 | 5.02 (2H, m) | Terminal vinyl CH2 |
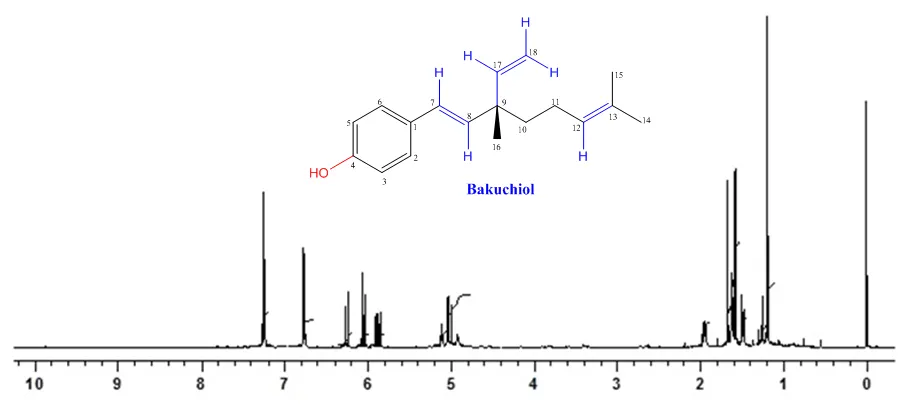
Figure 5: 1H NMR Spectrum of Isolated Bakuchiol.
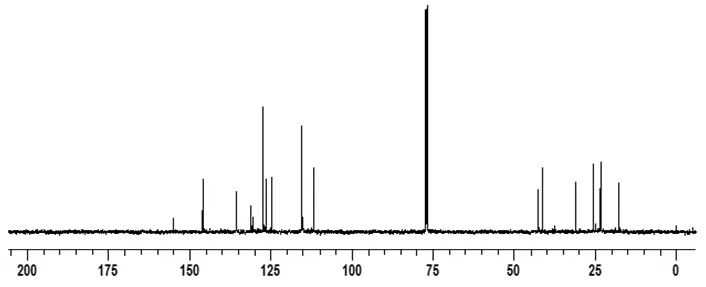
Figure 6: 13C NMR Spectrum of Isolated Bakuchiol.
3.3. Antioxidant activity of isolated bakuchiol
The antioxidant activity of isolated bakuchiol was evaluated using the DPPH radical scavenging assay, with BHT serving as the reference antioxidant [4]. The percentage radical scavenging activities of both compounds at different concentrations are summarized in Table 5. Bakuchiol exhibited concentration-dependent radical scavenging activity over the investigated concentration range. At 0.25 mM, bakuchiol produced 50.33% scavenging activity, compared with 46.69% for BHT. The scavenging activity of bakuchiol increased to 64.35% at 2.0 mM and 72.19% at 4.0 mM. BHT also showed increasing activity, from 46.69% at 0.25 mM to 76.53% at 4.0 mM. At concentrations between 0.25 and 2.0 mM, bakuchiol showed higher scavenging activity than BHT under the experimental conditions. At 3.0 and 4.0 mM, however, BHT exhibited higher activity, reaching 69.66% and 76.53%, respectively, compared with 66.10% and 72.19% for bakuchiol. These findings indicate that the relative radical scavenging performance of the two compounds varied with concentration.
The estimated IC₅₀ for BHT was 0.681 mM, calculated by linear interpolation between the measurements at 0.5 and 1.0 mM. For bakuchiol, an approximate value of 0.227 mM was obtained by extrapolating the initial response between 0.25 and 0.5 mM. Because the lowest tested bakuchiol concentration already produced more than 50% scavenging, its estimated IC₅₀ lies below the experimentally investigated concentration range. Consequently, this value should be considered a preliminary estimate rather than a directly measured IC₅₀. Further measurements at concentrations below 0.25 mM are necessary to determine the IC₅₀ more reliably. The radical scavenging activity of bakuchiol may be associated with its phenolic hydroxyl group, which can participate in hydrogen-atom or electron-transfer reactions with the DPPH radical. The resulting phenoxyl radical may be stabilized by delocalization within the aromatic system. This mechanism provides a plausible chemical explanation for the observed activity, although the present assay does not independently establish the specific reaction pathway.
Table 5: DPPH Radical Scavenging Activity of Isolated Bakuchiol and BHT.
| Compound | 0.25 mM | 0.5 mM | 1.0 mM | 1.5 mM | 2.0 mM | 3.0 mM | 4.0 mM | Estimated IC₅₀ (mM) |
|---|---|---|---|---|---|---|---|---|
| BHT | 46.69 ±0.09 | 47.75 ±0.03 | 53.97 ±0.14 | 54.78 ±0.13 | 62.23 ±0.16 | 69.66 ±0.25 | 76.53 ±0.37 | 0.681 |
| Bakuchiol | 50.33 ±0.03 | 53.88 ±0.10 | 55.69 ±0.05 | 59.16 ±0.11 | 64.35 ±0.18 | 66.10 ±0.09 | 72.19 ±0.10 | ~0.227* |
Values are expressed as mean ± SD (n = 3). The BHT IC₅₀ was estimated by linear interpolation. The bakuchiol IC₅₀ was extrapolated below the lowest tested concentration and requires experimental confirmation.
Overall, the DPPH assay demonstrated that the isolated bakuchiol exhibited appreciable in vitro radical scavenging activity. Its activity at low and intermediate concentrations supports further investigation of its antioxidant properties. Nevertheless, DPPH scavenging is a chemical assay and does not directly establish antioxidant efficacy in biological systems or finished formulations. Additional complementary antioxidant assays, stability studies, and biological evaluations are therefore required to establish its potential applications in cosmetic and pharmaceutical products.
CONCLUSION
The present study established an effective extraction and chromatographic separation strategy for isolating bakuchiol and triglyceride-rich fractions from Psoralea corylifolia L. seeds. Among the five Soxhlet extraction protocols investigated, sequential extraction with hexane followed by chloroform–methanol (2:1, v/v) was selected for its suitability in enriching lipophilic constituents. Silica gel column chromatography enabled the separation of triglyceride-rich and bakuchiol-rich fractions. Fatty acid profiling identified linoleic and oleic acids as the predominant unsaturated fatty acids and palmitic acid as the major saturated fatty acid in the isolated triglyceride-rich fraction, providing further insight into the lipid composition of the seeds. The identity of bakuchiol was supported by complementary GC–FID, GC–MS, FT-IR, and NMR analyses. The isolated bakuchiol exhibited concentration-dependent DPPH radical scavenging activity, showing greater activity than butylated hydroxytoluene (BHT) at lower and intermediate tested concentrations, whereas BHT was more active at higher concentrations. Although the preliminary IC₅₀ estimate suggested promising radical scavenging activity, further measurements at lower concentrations are required for reliable determination. Overall, these findings highlight P. corylifolia seeds as a potential source of bakuchiol and triglyceride-rich fractions for further investigation. Future studies should focus on confirming compound purity, evaluating oxidative stability, conducting complementary antioxidant assays, and assessing biological safety and efficacy to establish their suitability for cosmetic and pharmaceutical applications.
Acknowledgements
The author M. Praveen is grateful to the Director, CSIR-IICT for providing the facilities to carry out ‘Master of Pharmacy in Pharmaceutical Chemistry’ Dissertation work and DKIM for providing plagiarism check software and CSIR-IICT Communication number (IICT/Pubs./2026/370).
Conflicts of Interest
The authors declare no conflicts of interest.
Data availability
Data will be made available on request.
ORCID
B. L. A. Prabhavathi Devi id, https://orcid.org/0000-0001-9785-7999
REFERENCES


M. Praveen, B. L. A. Prabhavathi Devi, Isolation, Structural Characterization, and Antioxidant Activity of Bakuchiol and Fatty Acid Profiling of Psoralea Corylifolia L. Seed Oil, Int. J. of Pharm. Sci., 2026, Vol 4, Issue 10, 4692-4705. https://doi.org/
 10.5281/zenodo.23762683