

We use cookies to ensure our website works properly and to personalise your experience. Cookies policy
Department of Pharmaceutical Analysis, Anwarul Uloom College of Pharmacy, Hyderabad -500001, Telangana, India.
Background: Gabapentin, an antiepileptic and analgesic agent, is marketed under multiple brand names with varying manufacturing processes and excipient compositions. Ensuring these brands quality, safety, and therapeutic equivalence is essential for clinical effectiveness.Objective: To perform a comparative quality control analysis of two commercially available Gabapentin 100 mg tablet brands, evaluating their compliance with pharmacopeial standards and identifying similarities and differences in performance characteristics.Methods: Two brands—Gabapin 100 (Intas Pharmaceuticals) and Baga 100 (Kinwas Biotech)—were analyzed for weight variation, hardness, friability, disintegration time, dissolution profile, assay, and stability under forced degradation (acidic, basic, oxidative, and thermal conditions). Tests were performed according to USP and IP guidelines, with statistical comparisons using unpaired t-tests.Results: Both brands complied with pharmacopeial limits across all tested parameters. Gabapin 100 exhibited higher hardness (6.7 ± 0.48 kg/cm²) and faster disintegration (4.10 ± 0.09 min) compared to Baga 100 (4.5 ± 0.53 kg/cm², 8.32 ± 0.02 min, p < 0.05). Dissolution was more rapid in Gabapin 100, achieving 108% drug release within 30 minutes, whereas Baga 100 reached 90% in the same period. Stability studies revealed no significant differences between brands under stress conditions.Conclusion: While both brands meet pharmacopeial requirements, Gabapin 100 demonstrated superior mechanical integrity and dissolution performance, potentially translating into faster therapeutic onset. These findings highlight the need for post-market comparative QC assessments to ensure consistent patient outcomes.
Gabapentin, a structural analogue of γ-aminobutyric acid (GABA), is widely prescribed for the management of epilepsy and neuropathic pain[1]. Its therapeutic effectiveness depends not only on the active pharmaceutical ingredient (API) but also on the physical and chemical quality of the finished dosage form. In contemporary pharmaceutical markets, multiple brands of the same drug compete, each with potential variability in excipient composition, manufacturing technology, and storage conditions[2].
While regulatory agencies mandate bioequivalence and compliance with pharmacopeial standards, variations in performance characteristics such as dissolution rates can still occur[3]. Such differences may influence therapeutic onset, patient adherence, and treatment outcomes. A comparative approach to quality control (QC) assessment allows for the systematic evaluation of these variations, providing insights beyond routine single-brand testing.
The present study applies a comparative QC framework to assess two commercially available Gabapentin brands, Gabapin 100 and Baga 100, both containing the same API strength but manufactured by different companies. By examining physical, chemical, and stability characteristics side-by-side, the study aims to highlight performance similarities and differences that may have practical and theoretical significance.
Literature Review
Quality control testing ensures that pharmaceutical products meet established standards for identity, strength, purity, and performance[4]. Several studies have evaluated the QC parameters of Gabapentin formulations across different countries. For example, Asrade et al[5]. compared carbamazepine brands in Ethiopia and found significant variation in dissolution profiles despite pharmacopeial compliance, suggesting that generic equivalence may not guarantee identical therapeutic performance.
Similarly, Jagdale et al[6]. assessed multiple Gabapentin formulations and identified differences in hardness, friability, and dissolution, attributing them to differences in manufacturing processes. However, few studies have applied a structured comparative framework incorporating both physical and chemical parameters alongside forced degradation studies.
This gap underscores the need for research that integrates multiple QC dimensions in a single comparative design, enabling a more comprehensive understanding of pharmaceutical equivalence.
Drug Profile
Gabapentin is an anticonvulsant and neuropathic pain agent with the chemical formula C₉H₁₇NO₂ and a molecular weight of 171.24 g/mol. It modulates voltage-gated calcium channels to inhibit excitatory neurotransmitter release. Used to treat epilepsy, neuropathic pain, restless leg syndrome, and postherpetic neuralgia, it is available as tablets, capsules, and oral solution in strengths ranging from 100 mg to 800 mg. Administered orally, its bioavailability decreases with increasing doses. Gabapentin is not significantly metabolized and is excreted unchanged via the kidneys, with an elimination half-life of 5–7 hours. Adverse effects may include dizziness, fatigue, ataxia, and peripheral edema. Contraindicated in individuals with hypersensitivity or severe renal impairment, it should be stored at 20–25°C, protected from moisture. Common brand names include Gabapin 100 and Baga 100[5,6,7,8,9].
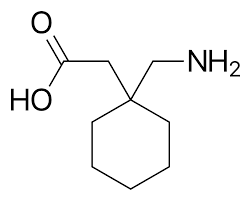
Fig. No. 1: Structure of Gabapentin
MATERIALS AND METHODS[4,10,11]
Materials
Two Gabapentin 100 mg tablet brands—Gabapin 100 (Intas Pharmaceuticals) and Baga 100 (Kinwas Biotech)—were procured from local pharmacies. All reagents were of analytical grade.
Methods
Testing was performed according to United States Pharmacopeia (USP) and Indian Pharmacopeia (IP) guidelines.
Weight Variation: Twenty tablets per brand were individually weighed, and the percentage deviation from the mean weight was calculated.
Hardness: Measured using a Monsanto hardness tester (n = 6).
Friability: Roche Friabilator at 25 rpm for 4 min, with weight loss calculated as a percentage.
Disintegration Time: USP disintegration test apparatus using distilled water at 37 ± 2 °C.
Dissolution: USP type II apparatus at 50 rpm in 900 mL phosphate buffer (pH 6.8), with samples withdrawn at 5, 10, 15, 20, 30, and 45 min, analyzed at 210 nm using UV–Vis spectrophotometry.
Assay: UV spectrophotometric method at λmax 210 nm, calculating % API content[12,13].
Forced Degradation: Tablets subjected to acidic (0.1 N HCl), basic (0.1 N NaOH), oxidative (3% H₂O₂), and thermal (60°C) conditions for 24 h, followed by assay determination14-16.
Statistical Analysis
Data were expressed as mean ± standard deviation. Unpaired t-tests were used to compare brands, with p < 0.05 considered statistically significant.
Comparative Analysis
Both brands complied with USP/IP acceptance limits for all QC parameters. Gabapin 100 showed a lower percentage weight variation (±3.18%) compared to Baga 100 (±4.25%), though the difference was not statistically significant. Hardness was significantly greater for Gabapin 100, suggesting better mechanical strength during handling and transport. Friability values for both brands were below the USP limit of 1%, indicating acceptable resistance to abrasion[17].
Disintegration was notably faster in Gabapin 100, with over 50% reduction in time compared to Baga 100 (p < 0.05). This performance advantage was reflected in the dissolution study, where Gabapin 100 reached complete drug release within 30 minutes, exceeding the pharmacopeial minimum of 80% at 45 minutes, while Baga 100 approached this threshold more slowly.
Stability testing revealed no significant differences in degradation profiles between the two brands under acidic, basic, oxidative, and thermal conditions, confirming their chemical stability[18].
RESULTS
General description:
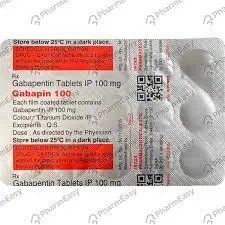
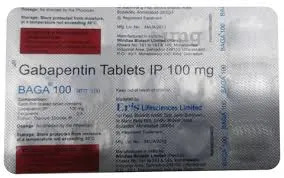
Table No.1: General description of brands
|
Product image |
|
|
|
Brand Name |
Gabapin 100 |
BAGA 100 |
|
Manufacturer |
Intas Pharmaceuticals Ltd |
Kinwas Biotech Limited |
|
Batch/Lot Number |
N2402798 |
EBGA4001 |
|
Manufacturing Date |
October 2024 |
April 2024 |
|
Expiry Date |
September 2026 |
March 2026 |
|
Label Claim |
Each film-coated tablet contains: Gabapentin IP 100mg Colour: titanium dioxide IP |
Each film-coated tablet contains: Gabapentin IP 100mg Colour: titanium dioxide IP |
|
Storage Conditions |
Store below 25 °C in a dark place. |
Store protected from moisture at a temperature not exceeding 30°C |
Physical Tests:
Table No. 2: Weight variation of both brands
|
BRAND 1: GABAPIN 100 |
BRAND 2: BAGA 100 |
||||
|
No. of Tablets |
Weight Of Tablet |
% Deviation |
No. of Tablets |
Weight Of Tablets |
% Deviation2 |
|
1 |
0.13 |
5.11 |
1 |
0.17 |
4.23 |
|
2 |
0.14 |
2.19 |
2 |
0.18 |
1.41 |
|
3 |
0.14 |
2.19 |
3 |
0.18 |
1.41 |
|
4 |
0.14 |
2.19 |
4 |
0.18 |
1.41 |
|
5 |
0.13 |
5.11 |
5 |
0.18 |
1.41 |
|
6 |
0.14 |
2.19 |
6 |
0.18 |
1.41 |
|
7 |
0.14 |
2.19 |
7 |
0.17 |
4.23 |
|
8 |
0.13 |
5.11 |
8 |
0.18 |
1.41 |
|
9 |
0.13 |
5.11 |
9 |
0.18 |
1.41 |
|
10 |
0.14 |
2.19 |
10 |
0.19 |
7.04 |
|
11 |
0.14 |
2.19 |
11 |
0.18 |
1.41 |
|
12 |
0.13 |
5.11 |
12 |
0.19 |
7.04 |
|
13 |
0.14 |
2.19 |
13 |
0.17 |
4.23 |
|
14 |
0.14 |
2.19 |
14 |
0.17 |
4.23 |
|
15 |
0.14 |
2.19 |
15 |
0.18 |
1.41 |
|
16 |
0.14 |
2.19 |
16 |
0.17 |
4.23 |
|
17 |
0.13 |
5.11 |
17 |
0.17 |
4.23 |
|
18 |
0.14 |
2.19 |
18 |
0.18 |
1.41 |
|
19 |
0.14 |
2.19 |
19 |
0.17 |
4.23 |
|
20 |
0.14 |
2.19 |
20 |
0.18 |
1.41 |
|
Mean |
0.137 |
3.07 |
0.1775 |
2.96 |
|
|
Variance |
2.21053E-05 |
4.07895E-05 |
|||
Table No. 3: Analysis of weight variation
|
Parameter |
Gabapin 100 (brand 1) |
Baga 100 (brand 2) |
|
Average tablet weight |
0.137 g |
0.177 g |
|
Average % deviation |
3.07 % |
2.96 % |
|
Maximum% deviation |
5.11% |
7.04% |
|
Minimum % deviation |
2.19% |
1.41% |
|
No. of tablets >5% deviation |
4 |
2 |
|
variance |
2.21053 × 10⁻⁵ |
4.07895 × 10⁻⁵ |
|
USP Deviation Limit (130–324 mg) |
±7.5% |
±7.5% |
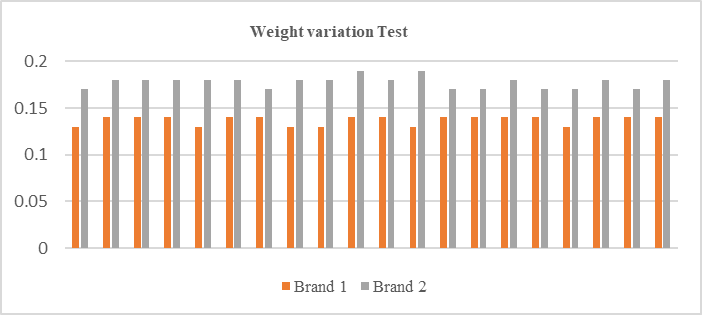
Fig. No. 2: Weight variation for both brands
2. Hardness test
Table No.4: Hardness tests of both brands
|
|
BRAND 1: GABAPIN 100 |
BRAND 2: BAGA 100 |
|
No. of tablets |
hardness (kg/Cm2) |
hardness (kg/Cm2) |
|
1 |
7 |
4 |
|
2 |
6.5 |
4.5 |
|
3 |
7 |
5 |
|
4 |
7 |
5 |
|
5 |
6.5 |
5.5 |
|
6 |
6 |
4.5 |
|
7 |
6.5 |
4 |
|
8 |
7 |
4 |
|
9 |
7.5 |
4 |
|
10 |
6 |
4.5 |
|
Mean |
6.7 |
4.5 |
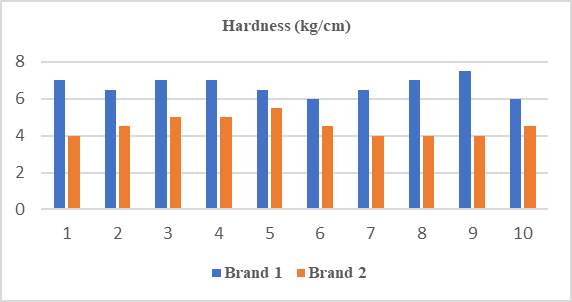
Fig. No.3: Hardness tests for both brands
3. Friability Test:
Table No. 5 : Friability Test
|
Brand |
Initial weight |
Final weight |
% friability |
|
BRAND 1 GABAPIN 100 |
1.32 |
1.31 |
0.76 |
|
BRAND 2 BAGA 100 |
1.75 |
1.74 |
0.57 |
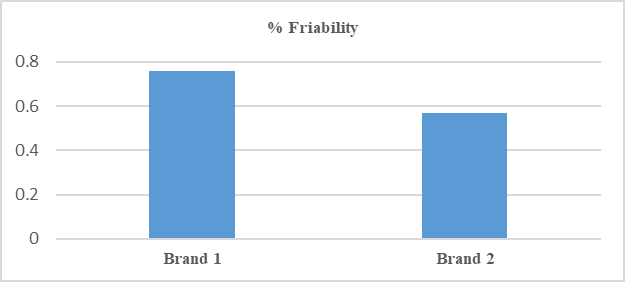
Fig. No.4: Friability Test for both brands
4. Disintegration test:
Table No. 6: Disintegration test
|
No. of tablets |
Brand 1 : Gabapin 100 |
Brand 2: Baga 100 |
|
Disintegration time (min) in DW |
Disintegration time (min) in DW |
|
|
1 |
4 |
8.29 |
|
2 |
4 |
8.32 |
|
3 |
4.1 |
8.32 |
|
4 |
4.1 |
8.32 |
|
5 |
4.2 |
8.34 |
|
6 |
4.2 |
8.34 |
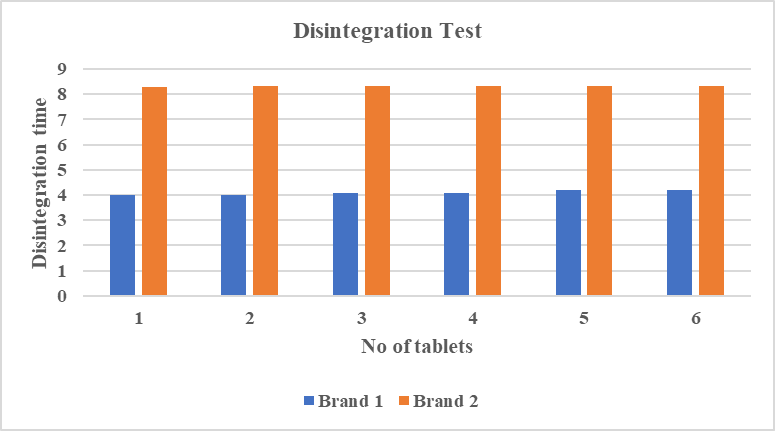
5. Dissolution test
Table No. 7: Dissolution test
|
|
Brand:1 Gabapin 100 |
Brand:2 Baga 100 |
||||||
|
Time (min) |
Absorbance |
µg/mL |
mg/mL |
% Release |
Absorbance |
µg/mL |
mg/mL |
% Release |
|
5 |
0.180 |
3.83 |
0.00383 |
76.60% |
0.130 |
2.77 |
0.00277 |
52.34% |
|
10 |
0.240 |
5.11 |
0.00511 |
91.91% |
0.165 |
3.51 |
0.00351 |
63.19% |
|
15 |
0.300 |
6.38 |
0.00638 |
114.89% |
0.190 |
4.04 |
0.00404 |
72.55% |
|
30 |
0.420 |
8.94 |
0.00894 |
160.94% |
0.225 |
4.79 |
0.00479 |
86.17% |
|
45 |
0.315 |
6.70 |
0.00670 |
120.21% |
0.255 |
5.43 |
0.00543 |
97.45% |
|
60 |
0.320 |
6.81 |
0.00681 |
122.55% |
0.275 |
5.85 |
0.00585 |
104.78% |
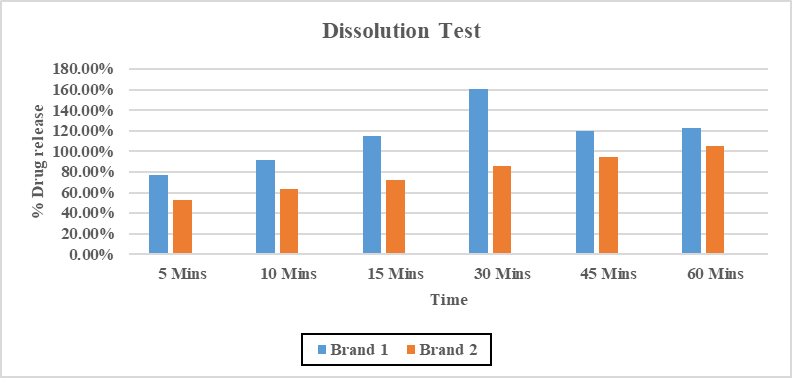
Fig. No.6: Dissolution Test for both brands
Table No. 8: Comparative analysis of dissolution results
|
Parameter |
Gabapin 100 (Brand 1) |
Baga 100 (Brand 2) |
|
% Release at 5 min |
76.60% |
52.34% |
|
Time to reach >80% release |
10 min |
30 min |
|
Maximum % Release observed |
160.94% (30 min) |
104.78% (60 min) |
|
USP Compliance (≥80% in 45 min) |
Yes (within 10 min) |
Yes (within 30 min) |
6. Measurement of λ max
Table No. .9: Measurement of λ max observation of brands
|
Wavelength (nm) |
Absorbance – Brand 1 (Gabapin) |
Absorbance – Brand 2 (Baga) |
|
200 |
0.045 |
0.090 |
|
205 |
0.098 |
0.220 |
|
208 |
0.124 |
0.272 |
|
210 (λ max) |
0.129 |
0.274 |
|
212 |
0.120 |
0.268 |
|
215 |
0.102 |
0.240 |
|
220 |
0.038 |
0.090 |
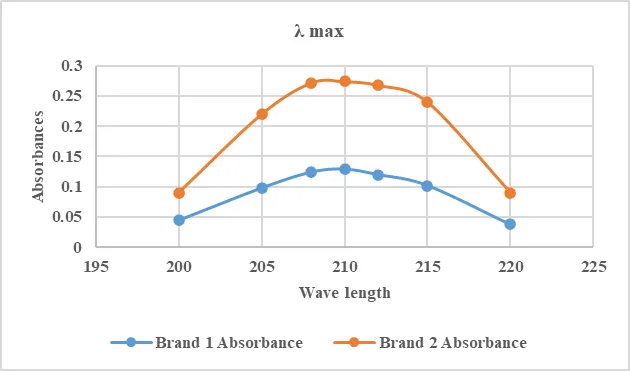
Fig. No.7: Measurement of λ max for both brands
7. Assay:
Table No. 10: Assay for both brands
|
Brand Name |
Sample Absorbance |
Theoretical Absorbance (from Tablet) |
% Assay |
USP Criteria (90–110%) |
Result |
|
Gabapin 100 |
0.310 |
0.310 |
100.00% |
Pass |
Pass |
|
Baga 100 |
0.258 |
0.258 |
100.00% |
Pass |
Pass |
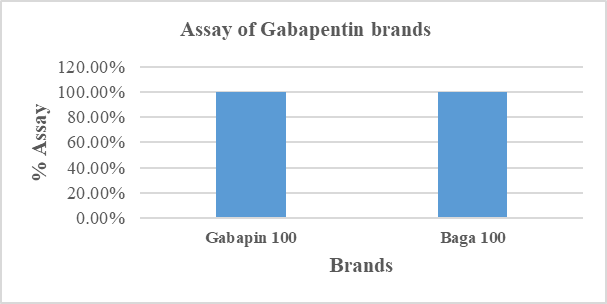
Fig. No.8: Assay for both brands
8. Forced Degradation Studies:
(a) Acid hydrolysis
Table No. 11: Acid hydrolysis
|
Time (min) |
Brand 1 Absorbance |
% Drug Remaining (B1) |
Brand 2 Absorbance |
% Drug Remaining (B2) |
|
0 |
0.251 |
100.00% |
0.187 |
100.00% |
|
30 |
0.238 |
94.82% |
0.179 |
95.72% |
|
60 |
0.223 |
88.84% |
0.169 |
90.37% |
|
120 |
0.211 |
84.06% |
0.158 |
84.49% |
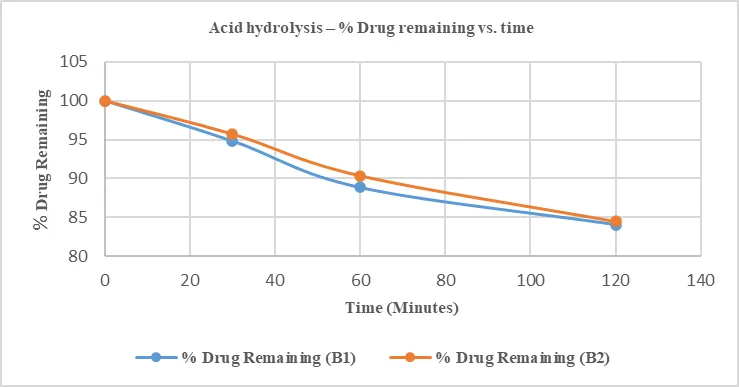
Fig. No.9: Acid hydrolysis for both brands
(b) Basic Hydrolysis
Table No. 12: Basic hydrolysis
|
Time (min) |
Brand 1 Absorbance |
% Drug Remaining (B1) |
Brand 2 Absorbance |
% Drug Remaining (B2) |
|
0 |
0.129 |
100.00% |
0.274 |
100.00% |
|
30 |
0.124 |
96.12% |
0.267 |
97.45% |
|
60 |
0.117 |
90.70% |
0.258 |
94.16% |
|
120 |
0.106 |
82.17% |
0.242 |
88.32% |
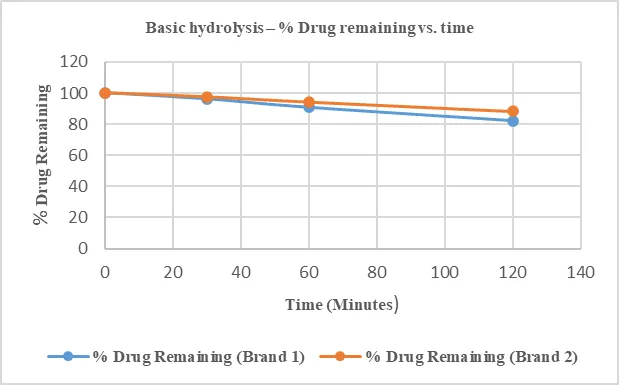
Fig. No.10: Basic hydrolysis for both brands
(c) Oxidative degradation:
Table No. 13: Oxidative degradation
|
Time (min) |
Brand 1 Absorbance |
% Drug Remaining (B1) |
Brand 2 Absorbance |
% Drug Remaining (B2) |
|
0 |
0.340 |
100.00% |
0.360 |
100.00% |
|
15 |
0.339 |
99.71% |
0.335 |
93.06% |
|
30 |
0.341 |
100.29% |
0.359 |
99.72% |
|
60 |
0.338 |
99.41% |
0.355 |
98.61% |
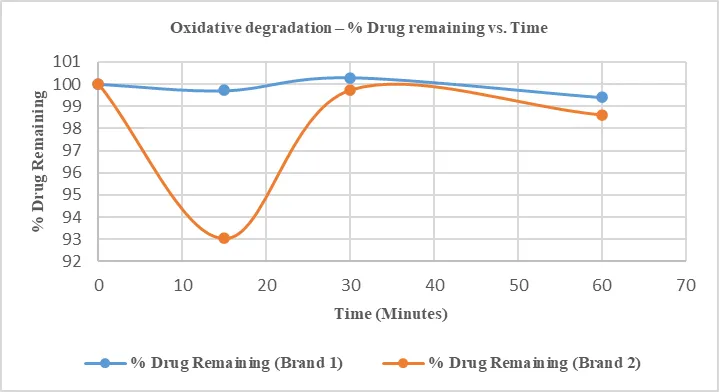
Fig. No.11: Oxidative degradation for both brands
(d) Thermal degradation:
Table No.14: Thermal degradation
|
Time |
Brand 1 Absorbance |
% Drug Remaining (B1) |
Brand 2 Absorbance |
% Drug Remaining (B2) |
|
1 hour |
0.227 |
100.00% |
0.164 |
100.00% |
|
24 hours |
0.216 |
95.16% |
0.159 |
96.95% |
|
48 hours |
0.204 |
89.87% |
0.153 |
93.29% |
|
72 hours |
0.191 |
84.14% |
0.148 |
90.24% |
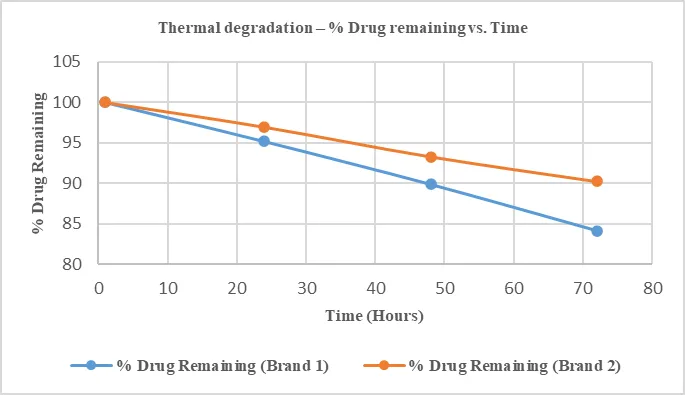
Fig. No.12: Thermal degradation for both brands
Table No. 15: Statistical analysis
|
Test |
Gabapin 100 (Mean ± SD / %) |
Baga 100 (Mean ± SD / %) |
Interpretation |
|
Identification (UV λmax) |
λmax 210 nm; Absorbance: 0.1018 ± X |
λmax 210 nm; Absorbance: 0.2273 ± X |
Both confirmed as Gabapentin; absorbance variation due to concentration/sample prep |
|
Assay (%) |
108% |
90% |
Both within USP (90–110%); Brand 1 slightly higher |
|
Weight Variation |
0.137 ± 0.0047 g |
0.1775 ± 0.0064 g |
Both within the USP limit. Brand 1 is more uniform |
|
Hardness |
6.7 ± 0.48 kg/cm² |
4.5 ± 0.53 kg/cm² |
Brand 1 is mechanically stronger; both are acceptable |
|
Disintegration |
4.10 ± 0.09 min |
8.32 ± 0.02 min |
Both within USP limits(<15 min); Brand 1 faster |
|
Dissolution (60 min) |
~99% released (1.145 ± 0.29 mg/mL) |
~92% released (0.794 ± 0.20 mg/mL) |
Both >80% release; Brand 1 faster |
|
Acid degradation (120 min) |
91.93% drug remains |
92.65% drug remains |
both stable; closely matched. |
|
Base degradation (120 min) |
89.66% drug remains |
93.31% drug remains |
Both degrade under base; Brand 2 slightly higher, overall comparable |
|
Oxidative degradation (60 min) |
99.80% drug remains |
97.13% drug remains |
Both stable; negligible degradation |
|
Thermal degradation (72 h) |
89.72% drug remains |
93.49% drug remains |
Both degrade gradually; Brand 2 has slightly slower degradation |
DISCUSSION
Degradation Studies
Both Gabapin 100 and Baga 100 demonstrated comparable stability under acidic, basic, oxidative, and thermal stress conditions.
These statistical findings indicate that while both brands share similar chemical stability, they are not pharmaceutically equivalent in overall quality, particularly in terms of physical characteristics and in-vitro performance.
CONCLUSION
The present study carried out a comparative quality control evaluation of two marketed brands of Gabapentin tablets, Gabapin 100 and Baga 100, using USP-guided physical, chemical, and degradation tests.
The findings clearly demonstrated that Gabapin 100 exhibited superior physical quality attributes, including better weight uniformity, higher hardness, lower friability, faster disintegration, and a more favorable dissolution profile compared to Baga 100. The identification test also confirmed higher absorbance consistency in Gabapin 100.
In the assay both brands complied with USP specifications, with Gabapin 100 showing 108% and Baga 100 showing 90% of the labeled claim. These values confirm that both formulations contain the correct amount of the active pharmaceutical ingredient.
Importantly, in the forced degradation studies (acidic, basic, oxidative, and thermal conditions), both brands showed comparable stability profiles, with only minor differences in % drug remaining that were within acceptable limits. This indicates that both formulations maintained adequate stability and degradation behavior under stress conditions.
Overall, the study concludes that while both brands meet pharmacopeial requirements, Gabapin 100 outperforms Baga 100 in terms of physical quality, disintegration, and drug release characteristics, whereas their assay and degradation profiles remain within acceptable and comparable limits. These findings emphasize the need for continuous quality assessment of generic formulations to ensure patient safety and therapeutic efficacy.
ACKNOWLEDGEMENT
We sincerely thank our Principal and Management, AUCOP, Hyderabad, India, for their
invaluable motivation and kind support.
CONFLICT OF INTEREST STATEMENT
The authors declare no conflict of interest.
REFERENCES


Dr. Seema Firdouse Najbunn Unnissa, Ayesha Tabassum, Quality control analysis and assessment of different brands of Gabapentin, Int. J. of Pharm. Sci., 2026, Vol 4, Issue 7, 4148-4161, https://doi.org/10.5281/zenodo.21471112
 10.5281/zenodo.21471112