

We use cookies to ensure our website works properly and to personalise your experience. Cookies policy
Department of Pharmacology, B. K. Mody Government Pharmacy College, Rajkot 360003.
Coagulation disorders such as thrombosis and stroke are major health concerns, and the use of conventional anticoagulants is often limited by adverse effects. this study evaluated the anticoagulant potential of the ethanolic extract of Ficus racemosa bark (EEFRB). in vitro analysis demonstrated significant prolongation of prothrombin time (pt) at 1 mg/ml and activated partial thromboplastin time (APTT) at 10 mg/ml. in vivo studies in rats, administered EEFRB (100, 200, and 400 mg/kg), showed increased pt (days 3 and 5), significant APTT prolongation (day 5), reduced platelet count, and extended clotting time, indicating effects on both extrinsic and intrinsic pathways. LC–MS analysis identified key bioactive compounds, including coumarin, quercetin, kaempferol, and ?-sitosterol. overall, EEFRB exhibited dose-dependent anticoagulant activity comparable to warfarin, with notable efficacy at 200 and 400 mg/kg.
Haemostasis is a vital physiological process that prevents blood loss through coordinated interactions among the vessel wall, platelets, and coagulation factors, leading to stable clot formation(1). disruption of this balance results in hypercoagulable states, increasing the risk of conditions such as deep vein thrombosis, pulmonary embolism, stroke, and myocardial infarction(2). although conventional anticoagulants like heparin and warfarin are effective, their use is limited by adverse effects, including bleeding and dermatological reactions(3). this has driven interest in safer, plant-based alternatives. Ficus racemosa (family moraceae), a medicinal plant with diverse pharmacological activities, has been traditionally suggested to possess anticoagulant properties; however, scientific validation remains limited. the plant is rich in bioactive compounds such as coumarin, quercetin, kaempferol, β-sitosterol, lupeol, and ellagic acid, which are associated with anticoagulant effects. therefore, the present study aims to evaluate the anticoagulant activity of Ficus racemosa bark extract using both in vitro and in vivo models(4,5,6).
MATERIALS AND METHODS
Ficus racemosa bark was collected from the B.K. Mody Government Pharmacy College campus, Rajkot, and authenticated at Saurashtra University (Ref. No. SU/BIO/2516692). The bark was washed, shade-dried, powdered, and extracted using the maceration method(7,8). The dried powder was subjected to extraction with Ethanol, and the extract was concentrated and stored for further analysis. Preliminary Phytochemical screening confirmed the presence of flavonoid, Phenolic, Coumarin, alkaloids, Terpenoids, and steroids, while quantitative estimation of total Phenolic and flavonoid content was performed using spectrophotometric methods(9,10,11,12). Phytoconstituents were further analyzed using LC–MS(13).
In vitro anticoagulant activity was evaluated using platelet-poor plasma obtained from rat blood, with Prothrombin Time (PT) and Activated Partial Thromboplastin Time (APTT) as key parameters(13). The extract was tested at varying concentrations. For in vivo studies, Sprague Dawley rats (180–200 g) were divided into five groups: normal control, standard (warfarin 0.2 mg/kg), and three treatment groups receiving Ethanolic extract (100, 200, and 400 mg/kg, Oral.) for 3 days, Blood samples were collected on days 3rd, 5th, and 7th, and evaluated for PT, APTT, clotting time, and platelet count(13,14,15). Statistical analysis was performed using ANOVA followed by Tukey’s test, with significance set at p < 0.05(13).
RESULTS AND DISCUSSION:
The percentage yield of the Ethanolic extract obtained from 100 grams of Ficus racemosa Bark was determined to be 7%w/w.
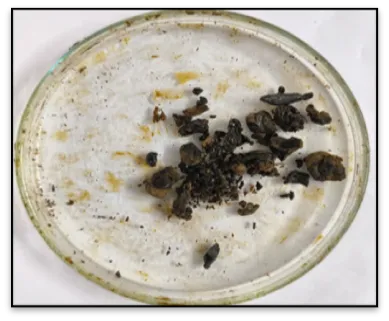
Figure 1 Extract of racemosa Bark
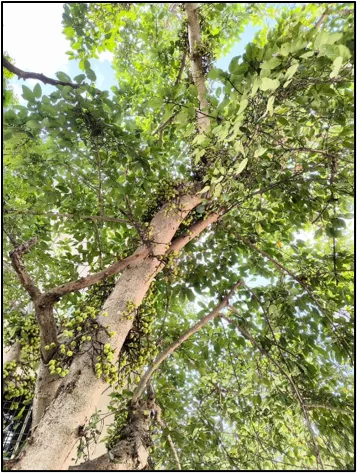
Figure 2 Tree of Ficus racemosa
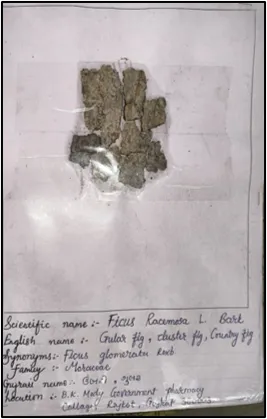
Figure 3 bark of Ficus racemosa
Table 1 Phytochemical analysis of Ethanolic extract of Ficus racemosa bark Powder
|
Chemical test |
Name of test |
Inference |
Result |
|
Alkaloids |
Mayer’s Test |
Creamy-white colored precipitate |
+ |
|
Dragendorff’s Test |
Orange-colored precipitate |
+ |
|
|
Wagner’s Test |
Brown-colored precipitate |
+ |
|
|
Hager’s Test |
Yellow-colored precipitate |
+ |
|
|
Saponins |
Foam test |
Foam layer (1cm) |
+ |
|
Protein and Amino acids |
Million’s Test |
White Precipitate turns red upon gentle heating. Not observed |
_ |
|
Flavonoid |
Alkaline reagent Test |
Yellow colour become colourless after adding Conc. HCl |
+ |
|
Shinoda test |
Magnetic red colour |
+ |
|
|
Ferric chloride Test (1%) |
Blue-green coloured |
+ |
|
|
Lead acetate Test |
Yellow coloured precipitate |
+ |
|
|
Phenols |
Ferric chloride Test (5%) |
Dark green color |
+ |
|
Lead acetate Test |
White coloured precipitate |
+ |
|
|
Glycosides |
Keller Killani Test |
Reddish-brown ring color at junction and bluish-green colored upper layer |
_ |
|
Legal’s Test |
Pink to red color |
+ |
|
|
Steroids |
Liebermann – Burchard Reaction |
Initially red color, followed by blue color and in last green color appear chloroform layer |
+ |
|
|
Salkowski’s test |
Red color in chloroform layer and greenish-yellow color in acid layer |
+ |
|
Tannins |
Ferric chloride solution (5%) |
Dark green color |
+ |
|
Lead acetate solution |
White precipitate |
+ |
|
|
Potassium dichromate test |
Yellow-colored precipitate |
+ |
|
|
Carbohydrates |
Molisch’s test |
Purple to violet ring at junction of two layers |
+ |
|
Benedict’s test |
Reddish-brown precipitate |
+ |
|
|
Coumarin test |
10% NaoH |
Yellow Color |
+ |
Table 2 Conc. and absorbance at 510 nm of Quercetin and EEFRB
|
Conc.(µg/ml) |
Abs (nm) |
|
10 |
0.172 |
|
20 |
0.234 |
|
40 |
0.387 |
|
60 |
0.523 |
|
80 |
0.722 |
|
100 |
0.895 |
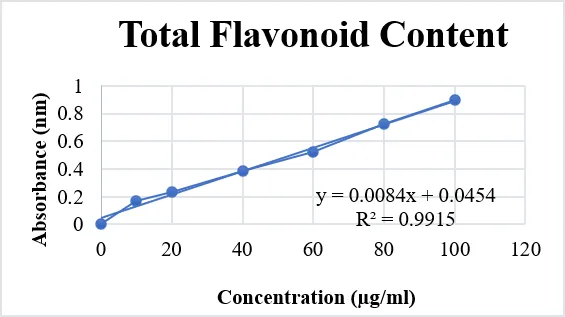
Figure 4 standard curve of Quercetin
Table 3 Conc. and absorbance at 765 nm of gallic acid and EEFRB
|
Conc.(µg/ml) |
Abs (nm) |
|
10 |
0.196 |
|
20 |
0.265 |
|
40 |
0.464 |
|
60 |
0.636 |
|
80 |
0.919 |
|
100 |
1.214 |
|
120 |
1.345 |
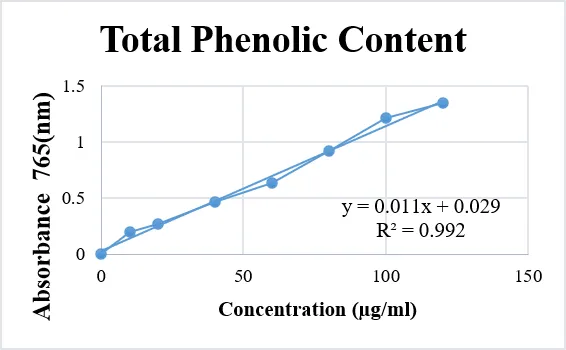
Figure 5 standard curve of Quercetin
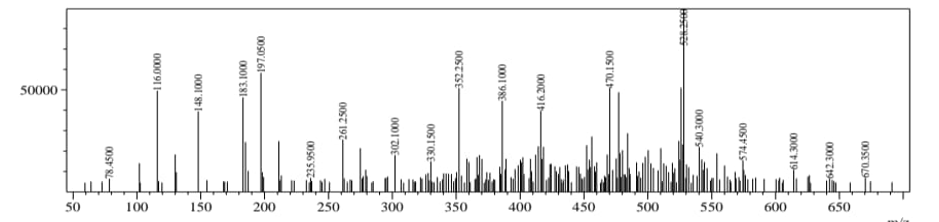
Figure 6 ion mass spectra reveal major ion product of Quercetin at m/z -302.10(303.05g/mol)
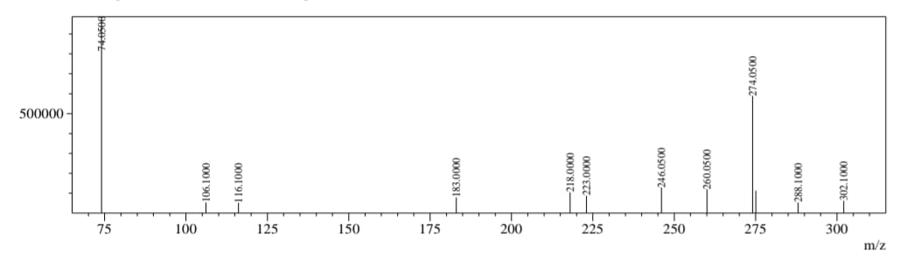
Figure 7 ion mass spectra reveal major ion product of Kaempferol at m/z -288.10 (287.06g/mol)
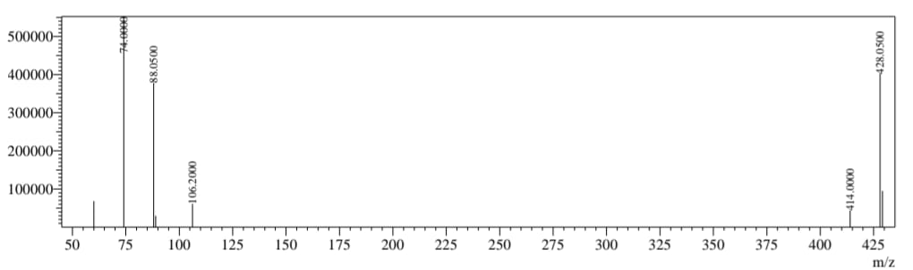
Figure 8 ion mass spectra reveal major ion product of β-Sitosterol at m/z -414.00 (415.40g/mol)
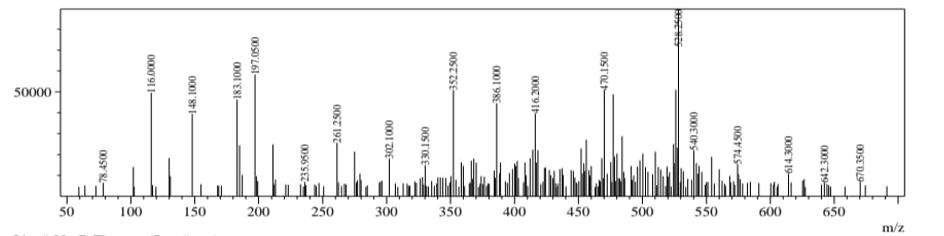
Figure 9 ion mass spectra reveal major ion product of Coumarin at m/z -148.10 (147.05g/mol)
Table 4 Effect of EEFRB on Prothrombin time (PT)
|
Sr. No |
Conc. (mg/ml) |
Prothrombin time (s) Mean ± SEM |
Prothrombin time in INR unit |
|
1 |
Blank |
11.00 ± 0.58 |
1 |
|
2 |
0.2 |
20.18 ±0.43* |
1.83 |
|
3 |
0.3 |
21.81 ±1.01* |
1.98 |
|
4 |
0.4 |
22.61 ±0.76* |
2.06 |
|
5 |
0.5 |
24.29 ±0.39* |
2.21 |
|
6 |
0.6 |
26.56 ±1.05* |
2.41 |
|
7 |
0.7 |
29.75 ±0.47* |
2.7 |
|
8 |
0.8 |
32.29 ±0.22* |
2.94 |
|
9 |
0.9 |
33.43 ±0.71* |
3.04 |
|
10 |
1 |
34.84 ±0.26* |
3.17 |
|
11 |
1.2 |
29.96 ±0.53* |
2.72 |
|
12 |
10 |
28.61 ±0.26* |
2.6 |
|
13 |
100 |
26.02 ±0.47* |
2.37 |
|
14 |
500 |
25.36 ±0.46* |
2.31 |
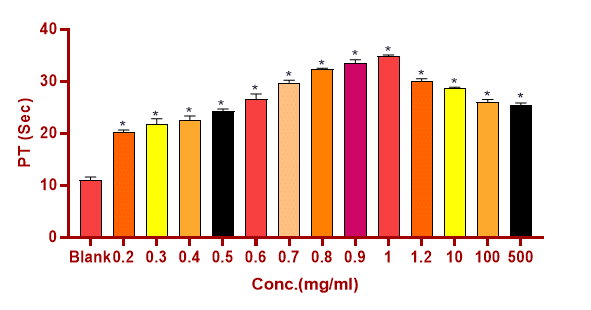
Figure 10 Effect of EEFRB on Prothrombin
Table 5 Activated Partial Thromboplastin time test (APTT)
|
Sr. No |
Conc.(mg/ml) |
Effect of EEFRB APTT (s) |
|
1 |
Blank |
32.33 ± 0.88 |
|
2 |
1 |
33.52 ± 0.65 |
|
3 |
2 |
34.51 ± 0.68 |
|
4 |
3 |
36.43 ± 0.14* |
|
5 |
4 |
39.95 ± 0.43* |
|
6 |
5 |
41.84 ± 0.34* |
|
7 |
6 |
46.64 ± 0.18* |
|
8 |
7 |
51.72 ± 0.39* |
|
9 |
8 |
58.38 ± 0.33* |
|
10 |
8.5 |
58.19 ± 0.37* |
|
11 |
9 |
63.15 ± 0.96* |
|
12 |
9.5 |
66.31 ± 0.76* |
|
13 |
10 |
69.75 ± 0.18* |
|
14 |
11 |
59.03 ± 0.35* |
|
15 |
12 |
57.40 ± 0.70* |
|
16 |
13 |
54.52 ± 0.82* |
|
17 |
14 |
53.02 ± 0.05* |
|
18 |
15 |
53.49 ± 0.21* |
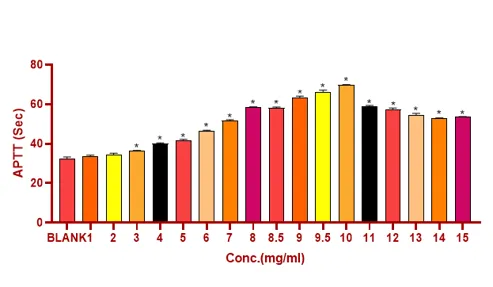
Figure 11 Activated Partial Thromboplastin time test (APTT)
Table 6 Prothrombin time at different days
|
Group |
Day 3 PT time (s) |
Day 5 PT time (s) |
Day 7 PT time (s) |
|
Control |
15.02± 0.40 |
15.30±0.21 |
16.65±0.31 |
|
Standard (0.2mg/kg Warfarin) |
27.98±0.60* |
34.80±0.32* |
31.91±0.28* |
|
100mg/kg EEFRB |
21.64±0.38* |
25.27±0.50* |
23.64±0.62* |
|
200mg/kg EEFRB |
23.61±0.53* |
30.81±0.25* |
26.6±0.67* |
|
400mg/kg EEFRB |
27.10±0.57* |
31.12±0.87* |
31.08±0.24* |
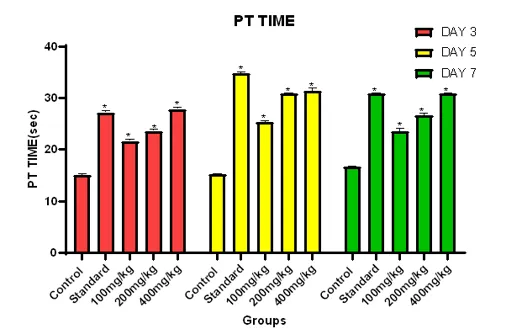
Figure 12 Prothrombin time at different days
Table 7 APTT Time at different days
|
Group |
Day 3 APTT time (s) |
Day 5 APTT time (s) |
Day 7 APTT time (s) |
|
Control |
14.36±0.57 |
15.30±0.21 |
16.65±0.31 |
|
Standard(0.2mg/kg Warfarin) |
22.51±0.61* |
34.80±0.32* |
30.82±0.28* |
|
100mg/kg EEFRB |
17.97±0.56* |
25.27±0.50* |
23.64±0.62* |
|
200mg/kg EEFRB |
18.95±0.50* |
30.81±0.25* |
26.6±0.67* |
|
400mg/kg EEFRB |
20.16±0.53* |
31.32±0.87* |
30.23±0.24* |
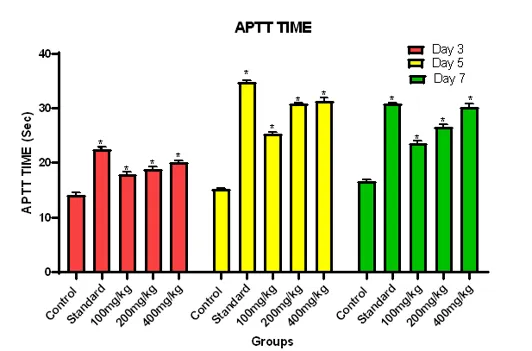
Figure 13 APTT Time at different days
Table 8 Clotting time
|
Group |
Day 3 clotting time (s) |
Day 5 clotting time (s) |
Day 7 clotting time (s) |
|
Control |
38.81±0.71 |
37.68±0.66 |
38.1±0.72 |
|
Standard(0.2mg/kg Warfarin) |
55.45±0.79* |
75.02±0.74* |
71.87±0.68* |
|
100mg/kg EEFRB |
48.46±0.68* |
61.08±0.69* |
59.13±0.79* |
|
200mg/kg EEFRB |
52.43±0.74* |
66.73±0.78* |
65.2±0.83* |
|
400mg/kg EEFRB |
54.58±0.82* |
72.08±0.84* |
70.38±0.76* |
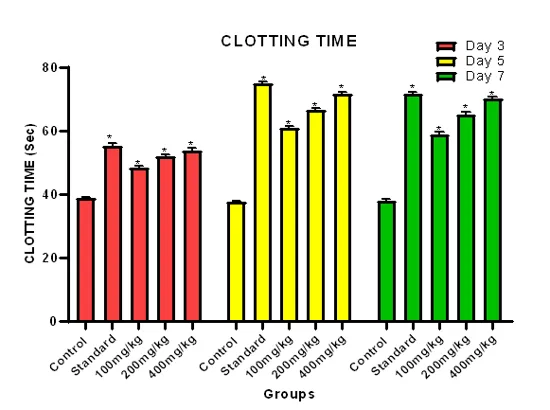
Figure 14 clotting time
Table 9 Platelet Count
|
Group |
Day 3 Platelet count |
Day 5 Platelet count |
Day 7 Platelet count |
|
Control |
865.40±25.10 |
37.68±0.66 |
38.1±0.72 |
|
Standard(0.2mg/kg Warfarin) |
55.45±0.79* |
75.02±0.74* |
71.87±0.68* |
|
100mg/kg EEFRB |
48.46±0.68* |
61.08±0.69* |
59.13±0.79* |
|
200mg/kg EEFRB |
52.43±0.74* |
66.73±0.78* |
65.2±0.83* |
|
400mg/kg EEFRB |
54.58±0.82* |
72.08±0.84* |
70.38±0.76* |
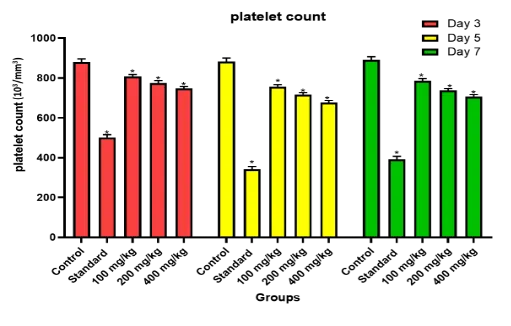
Figure 15 Platelet Count
Table 10 CBC on 3rd day
|
PARAMETER |
Control Group |
Standard Group |
100mg/kg |
200mg/kg |
400mg/kg |
|
HBG g/dL |
14.81±0.73 |
20.21±0.95 |
20.31±0.49 |
18.09±0.39 |
20.56±0.61 |
|
RBCmill./Cmm |
8.20±0.19 |
9.51±0.84 |
7.74±0.25 |
7.44±0.80 |
7.65±0.40 |
|
WBC 103/mm3 |
7.69±0.32 |
8.38±0.19 |
9.01±0.55 |
7.66±0.40 |
7.22±0.81 |
|
PLT103/mm3 |
865.40±25.10* |
501.67 ±5.58* |
807.50 ± 4.1* |
775.00 ± 4.83* |
748.33 ±3.66* |
|
HCT % |
53.21±0.51 |
54.06±0.35 |
55.9±0.64 |
51.33±0.29 |
48.53±0.37 |
|
MCV fL |
62.36±2.98 |
68.19±2.81 |
69.18±2.331 |
67.386±2.77 |
63.15±2.75 |
|
MCH pg |
23.91±0.59 |
21.30±0.20 |
24.23±0.46 |
21.56±0.35 |
25.93±0.67 |
|
MCHC g/dL |
34.25±0.87 |
37.15±0.32 |
36.25±0.91 |
31.85±0.63 |
36.06±2.77 |
|
RDW-CV % |
14.21±0.12 |
14.25±0.36 |
14.23±0.78 |
14.1±0.24 |
14.23±0.43 |
|
NEU % |
39.76±0.43 |
33.66±0.75 |
36.36±0.58 |
27.46±0.85 |
35.73±2.50 |
|
LYM % |
56.16±0.75 |
60.66±0.58 |
57.83±0.15 |
61.16±0.579 |
58.5±0.88 |
|
EOS % |
1±0 |
1±0 |
1±0 |
1±0 |
1±0 |
|
MON % |
8.86±0.59 |
5.63±0.38 |
8±0.66 |
7±0.47 |
7.9±0.52 |
Table 11 CBC on 5th day
|
PARAMETER |
Control Group |
Standard Group |
100mg/kg |
200mg/kg |
400mg/kg |
|
HBG g/dL |
18.65±0.60 |
19.75±0.88 |
18.85±0.31 |
19.60±0.35 |
2.95±1.60 |
|
RBCmill./Cmm |
8.55±0.18 |
9.30±0.85 |
8.40±0.28 |
7.15±0.15 |
7.50±1.00 |
|
WBC 103/mm3 |
7.65±0.40 |
8.35±1.10 |
9.00±0.55 |
7.65±0.40 |
7.20±0.38 |
|
PLT103/mm3 |
882.50 ±7.39* |
340.83 ±5.83* |
757.17 ±3.96* |
717.50 ±3.82* |
676.67 ±4.41* |
|
HCT % |
55.00±2.40 |
52.90±1.60 |
55.10±0.45 |
52.90±1.40 |
49.40±0.90 |
|
MCV fL |
62.00±2.70 |
62.00±2.70 |
69.20±2.00 |
66.00±2.80 |
63.90±4.80 |
|
MCH pg |
21.10±0.70 |
21.70±1.50 |
25.00±0.80 |
21.10±0.70 |
25.30±0.85 |
|
MCHC g/dL |
35.10±0.35 |
38.00±0.90 |
37.00±0.85 |
33.00±0.90 |
38.80±2.70 |
|
RDW-CV % |
14.20±0.05 |
14.20±0.02 |
14.20±0.03 |
14.05±0.04 |
14.20±0.03 |
|
NEU % |
35.00±1.80 |
33.00±1.70 |
36.50±1.60 |
27.50±0.90 |
35.50±2.90 |
|
LYM % |
55.00±2.00 |
61.50±1.60 |
56.50±2.10 |
61.00±1.60 |
58.20±2.80 |
|
EOS % |
1±0 |
1±0 |
1±0 |
1±0 |
1±0 |
|
MON % |
8.00±1.10 |
5.00±0.35 |
7.90±1.40 |
6.80±1.50 |
4.40±0.20 |
Table 12 CBC on 7th day
|
PARAMETER |
Control Group |
Standard Group |
100mg/kg |
200mg/kg |
400mg/kg |
|
HBG g/dL |
18.70±0.58 |
19.85±0.92 |
18.95±0.28 |
19.70±0.34 |
2.90±1.65 |
|
RBCmill./Cmm |
8.58±0.17 |
9.35±0.88 |
8.50±0.29 |
7.20±0.13 |
7.55±1.02 |
|
WBC 103/mm3 |
7.70±0.43 |
8.38±1.12 |
9.05±0.58 |
7.70±0.43 |
7.25±0.40 |
|
PLT103/mm3 |
890.83 ±6.51* |
391.67 ±6.15* |
785.83 ±4.73* |
737.50 ±3.82* |
707.50 ±3.82* |
|
HCT % |
55.15±2.50 |
53.00±1.60 |
55.25±0.46 |
53.05±1.42 |
49.50±0.92 |
|
MCV fL |
62.10±2.78 |
62.10±2.78 |
69.50±2.05 |
66.30±2.85 |
64.10±4.90 |
|
MCH pg |
21.20±0.76 |
21.85±1.55 |
25.30±0.86 |
21.20±0.76 |
25.45±0.88 |
|
MCHC g/dL |
35.30±0.36 |
38.20±0.92 |
37.30±0.88 |
33.10±0.90 |
39.00±2.75 |
|
RDW-CV % |
14.21±0.04 |
14.24±0.02 |
14.24±0.03 |
14.10±0.04 |
14.23±0.03 |
|
NEU % |
35.10±1.82 |
33.10±1.75 |
36.70±1.55 |
27.70±0.92 |
35.70±2.95 |
|
LYM % |
55.20±1.95 |
61.70±1.55 |
56.90±2.18 |
61.20±1.58 |
58.60±2.85 |
|
EOS % |
1±0 |
1±0 |
1±0 |
1±0 |
1±0 |
|
MON % |
8.10±1.12 |
5.05±0.37 |
8.00±1.48 |
6.90±1.55 |
4.50±0.23 |
CONCLUSION
The present study provides strong scientific evidence supporting the anticoagulant potential of Ficus racemosa bark extract. The ethanolic extract (EEFRB) demonstrated significant anticoagulant activity in both in vitro and in vivo studies by prolonging Prothrombin Time (PT) and Activated Partial Thromboplastin Time (APTT), indicating effects on the extrinsic and intrinsic coagulation pathways, respectively. In vivo administration at doses of 200 and 400 mg/kg resulted in a marked increase in PT, APTT, and clotting time, along with a reduction in platelet count, suggesting inhibition of platelet function. These effects may be attributed to bioactive constituents such as coumarin, quercetin, kaempferol, and β-sitosterol. Overall, the findings highlight the ethanolic extract of Ficus racemosa bark as a promising natural anticoagulant, warranting further pharmacological and clinical investigations to establish its safety and therapeutic potential.
REFERENCES



Vidhi Shukla, Rachna Katbamna, Dakshkumar Patel, Ravi Manek, Jignesh Patel, Malay Rathod, Manisha Kalariya, Evaluation of Anti-Coagulant Activity of Ficus racemosa Bark Extract in Rats, Int. J. of Pharm. Sci., 2026, Vol 4, Issue 8, 815-825. https://doi.org/10.5281/zenodo.21809047
 10.5281/zenodo.21809047