
We use cookies to ensure our website works properly and to personalise your experience. Cookies policy
Mandesh Institute of Pharmaceutical Science and Research Center, Mhaswad
For the simultaneous measurement of propranolol hydrochloride and ascorbic acid in tablet dosage form, a reliable, exact, accurate, and stability-indicating Reverse Phase High Performance Liquid Chromatographic (RP-HPLC) method was created and verified.The chromatographic separation was achieved using Phenomenex C18 (150mm x 4.6mm, 5?m) column as stationary phase with Phenomenex Security Guard Cartridges C18, 4x3mm and methanol: phosphate buffer pH 7 (70:30) as mobile phase at 1.0ml/min flow rate. Detection was performed at a wavelength of 221nm using a Younglin Acme 9000 HPLC system. The method was validated for linearity, accuracy, precision, specificity, and robustness per ICH Q2(R1) guidelines.The methodology described exhibited a linear response within concentration ranges of 0.8-1.2?g/ml (r²=0.996) for Vit C and 64-96?g/ml (r²=0.991) for PRO. The quantities of Vit C and PRO found in the commercially available formulation were 107% and 101%, respectively. The developed method provides sufficient specificity, sensitivity, and reproducibility to quantify Vitamin C and PRO in tablet formulations.To confirm the method's stability, forced degradation studies were conducted under acidic. alkaline, oxidative, photolytic, and thermal stress conditions in accordance with ICH Q1A (R2) guidelines. Studies on forced deterioration were conducted in acidic, basic, oxidative, thermal, and photolytic environments. The method's capacity to indicate stability was demonstrated by its successful separation of degradation products from the active medicinal ingredients. Pharmaceutical formulations including ascorbic acid and propranolol hydrochloride can benefit from regular quality control and stability analysis using the suggested approach
Analytical techniques known as stability-indicating methods detect active pharmaceutical ingredients (APIs) precisely without influence from excipients, contaminants, or degradation products. These techniques are crucial for figuring out how stable a medicine is and how long it will last.
Pharmaceutical items may deteriorate during storage as a result of oxidation, temperature, light, and humidity. These degradation products can be separated from the intact medication using a stability-indicating technique, guaranteeing precise measurement and safety assessment.
Propranolol hydrochloride (PR0) is chemically described as 1-[(1-methyl ethyl) amino] 3-(1-napthylenoylxy) 2. As a nonselective β blocker, it inhibits the effects of epinephrine on both β1- and β2-adrenergic receptors. This medication is utilized to treat conditions such as angina pectoris, cardiac arrhythmias, hypertension, anxiety attacks, and glaucoma.The drug's effects include decreased cardiac output and heart rate, prolonged AV nodal conduction time, and decreased blood flow in the majority of vascular areas, raised triglycerides, decreased HDL cholesterol3, impaired lipolysis, and increased plasma renin activity.
Ascorbic acid, also referred to as vitamin C, is a water-soluble vitamin that is necessary for many body processes. It is essential for healing and plays a critical role in the formation of blood vessels, cartilage, muscle, and collagen in bones. As an antioxidant, it boosts immunity and helps shield cells from harm. Citrus fruits, berries, and vegetables are good sources of vitamin C, which is essential for humans and some primates to avoid scurvy. Ascorbic acid is also a nutritional supplement that is involved in metabolic activities.
One of the most popular analytical methods in pharmaceutical analysis is reverse phase high performance liquid chromatography (RP-HPLC). It is predicated on the partition chromatography principle, which states that variations in the hydrophobic interactions between analytes and the stationary phase cause separation.
Propranolol because it is lipophilic, it interacts strongly with the hydrophobic stationary phase in RP-HPLC, leading to a longer retention period. This characteristic makes it easier to separate from polar substances like ascorbic acid.
Ascorbic acid, on the other hand, elutes earlier in RP-HPLC due to its high polarity and low interaction with the non-polar stationary phase. However, stability-indicating analysis is essential because it is quite vulnerable to oxidation.
The objective of present work was to develop stability indicating method for determination of Propranolol and Ascorbic acid by RP-HPLC.
Figure 1: Structure of Propranolol and Ascorbic acid
MATERIALS AND METHODS
Chemicals and Reagents
Propranolol hydrochloride and Ascorbic acid were kindly provided as gift samples by Ipca Laboratories, Mumbai.Tablets of (Ascorbic acid 0.25mg, Propranolol hydrochloride 20 mg) were purchased from local market. Water LiChrosolv® (Merck Specialties Pvt. Ltd., Mumbai.), Methanol LiChrosolv® (Merck Specialties Pvt. Ltd., Mumbai.), Acetonitrile LiChrosolv® (Merck Specialties Pvt. Ltd., Mumbai.), Di potassium hydrogen phosphate anhydrous AR (Merck Specialties Pvt. Ltd., Mumbai.), Potassium dihydrogen orthophosphate AR (S.D. Fine-chem. Ltd., Mumbai).
Instruments
The chromatographic separation was carried out on a Younglin 9000 HPLC system. Chromatographic system equipped with Quaternary Gradient HPLC system (SP930D), fitted with UV-VIS Detector. Phenomenex C18 (150 x 4.6mm, 5μm) column as stationary phase with Phenomenex Security Guard Cartridges C18, 4x3mm. The mobile phase was degassed by sonication using ultrasonic bath (Microclean-103). Shimadzu UV Spectrophotometer 1800 was used for wavelength selection. The standard substances were weighed on, electronic balance Shimadzu, Japan AY220. Vigo Melting point apparatus was used.
Preparation of Standard Stock Solution
Standard Stock Solution of PRO
Weighed exactly 10 mg of standard PRO and transferred it to a 10 ml volumetric flask, then dissolved it in methanol LiChrosolv®.To achieve the desired concentration, the volume was adjusted to the mark using the same solvent. of 1000μg/ml of PRO. The "Std Stock PRO" (800 μg/ml) was prepared by diluting 8 ml of the solution to 10 ml with the same solvent.
Standard Stock Solution of Vit C
Weigh 10 mg of standard Vitamin C, transfer it to a 10ml volumetric flask, and dissolve it using methanol (LiChrosolv®).The solution was diluted to the mark with the same solvent to obtain a 1000 μg/ml Vitamin C concentration.To obtain the ‘Std Stock Vit C’ (10 μg/ml), 1 ml of the initial solution was diluted to 10 ml with the same solvent to reach a concentration of 100 μg/ml; subsequently, 1 ml of this intermediate solution was diluted again to 10 ml.
Combined Standard Stock Solution of PRO and Vit C
5ml of ‘Std Stock Vit C’ (10μg/ml) and 5ml of ‘Std Stock PRO’ (800μg/ml) mixed to get conc. of 5μg/ml of Vit C and 400μg/ml of PRO. The solution was labeled as ‘Std Stock MIX’.
Selection of Analytical Wavelength
To investigate the appropriate wavelength for simultaneous determination of Vit C and PRO, individual solutions in the mobile phase were scanned in the range of 200-300nm.
Chromatographic Condition
Analytical Column: Phenomenex C18 column (150 mm × 4.6 mm, 5 μm)
Mobile Phase: Methanol Phosphate Buffer pH7 (70:30)
Flow Rate: 1ml/min
Column temperature: Ambient
Injection Volume: 20 μl
Detection Wavelength: 221nm
Preparation of phosphate buffer pH7
Accurately weighed 0.136gm of potassium dihydrogen phosphate and 0.174gm of dipotasium hydrogen phosphate transferred in the 100ml volumetric flask and dissolved in HPLC water, then volume was made up to the mark with HPLC water.
Preparation of Mobile phase
Various combination of mobile phase including water, methanol, acetonitrile, phosphate buffer were tried finally Methanol and phosphate buffer of pH7 in the ratio (70:30) was selected for analysis of Vit C and PRO.
Identification of Separated Peak of the Drugs
For identification of peak of the drugs; the standard solutions of Vit C (10μg/ml) and PRO (10μg/ml) were injected separately into HPLC system and retention time were matched with retention time of mixture.
Method Validation
The method was validated according to ICH guidelines with respect to specificity, accuracy, precision, linearity, robustness, ruggedness, system suitability.
Specificity
The chromatogram of standard solution of mixture of Vit C and PRO was compared with formulation to observe the interference of excipient.
Linearity
Into a series of 10 mL volumetric flasks, transfer "Std Stock MIX" (Vit C 5 μg/mL & PRO 400 μg/mL) aliquots of 1.6, 1.8, 2.0, 2.2, and 2.4 mL.
The volume was made up to the mark with mobile phase to obtain the conc. of 0.8, 0.9, 1, 1.1 and 1.2μg/ml of Vit C and 64, 72,80,88 and 96 μg/ml of PRO.
After filtration through a syringe filter, 20 μL of each solution was injected into the HPLC system, and chromatograms were recorded for 10 minutes. Peak areas were recorded for all the peaks. Calibration curves of Vit C and PRO were constructed by plotting the peak area v/s conc. The correlation coefficient (r2) of least square linear regression for Vit C and PRO was calculated.
Range
The analytical range was determined by plotting the calibration curve and using the interval between its lowest and highest levels.
Accuracy
From the ‘Sample Stock 1’ solution 1 ml was transferred to four different 10ml volumetric flasks separately along with 0, 0.8, 1, 1.2 ml from the ‘Std Stock MIX’ (Vit C - 5μg/ml and PRO -400μg/ml) solution. The volume was brought to the mark with the mobile phase. All the solutions were filtered through syringe filter and injected into the HPLC system and their chromatograms were recorded under the same chromatographic conditions after getting a stable baseline. Peak areas were recorded for all the peaks and percent recoveries were calculated.
Precision
Evaluated the precision of the analytical method by assessing its repeatability and intermediate precision.
Repeatability
Repeatability was determined by analyzing the standard solution of Vit C (1μg/ml) and PRO (80μg/ml) six times and %RSD calculated
Intermediate Precision Intra-day Precision
Intra-day precision was determined by analyzing the standard solution of Vit C (1μg/ml) and PRO (80μg/ml) at 9.00am and 6.00pm on same day following the procedure of repeatability.
Robustness
Combined standard solution of Vit C (1μg/ml) and PRO (80μg/ml) was prepared and analyzed at different flow rates (0.9, 1.0, 1.1 ml/min) separately.
System Suitability
Sample solutions containing Vitamin C (1μg/ml)and PRO (80μg/ml) were prepared and analyzed six times.. Chromatograms were studied for different parameters such as tailing factor, resolution and theoretical plates to evaluating whether they stay within the recommended limits.
Assay of Tablet Formulation
Twenty tablets (containing 0.25mg of Vitamin C and 20mg of Propranolol hydrochloride each) were weighed and finely powdered. An accurately weighed portion of the powder equivalent to 0.25mg of Vitamin C and 20mg of Propranolol hydrochloride was then transferred to a 50mL volumetric flask. Add 5 mL of methanol, sonicate the mixture for 10 minutes, dilute it to volume with methanol, and filter it through Whatman No. 41 filter paper. (‘Sample Stock1’). 2ml of resulting solution diluted upto10ml with mobile phase to obtain 1μg/ml Vit C and 80μg/ml PRO(‘Sample Stock2’).
Sample Stock2 was filtered through syringe filter and injected into HPLC system. The amount of Vit C and PRO present in the tablets were calculated using calibration curve equations, y= 142x+6.2 and y= 130.91x+1058.4 respectively.
Forced degradation study
Forced degradation study performed on Vit C and PRO both standard sample and tablet formulation.
Preparation of standard stock solution of Vit C (API)
20mg of standard Vit C was weighed and transferred to a 20ml volumetric flask then dissolved in the methanol LiChrosolv®. The volume was made up to the mark with methanol to obtain conc. of 1000μg/ml of Vit C (Sample stock A).1 ml of above solution dilute up to 10 ml with methanol resulting concentration 100μ/ml. Dilute 4 mL of this solution to 10 mL with mobile phase to obtain a final concentration of 40 μg/mL.solution filtered through syringe filter and injected in HPLC. This is chromatograph of fresh sample.
Preparation of standard stock solution of PRO (API)
20mg of standard PRO was weighed and transferred to a 20ml volumetric flask then dissolved in the methanol LiChrosolv®. The volume was made up to the mark with methanol to obtain conc. of 1000μg/ml of PRO (Sample stock A).1 ml of above solution dilute up to 10 ml with methanol resulting concentration 100μ/ml. Dilute 4 mL of this solution to 10 mL with mobile phase to obtain a final concentration of 40 μg/mL.solution filtered through syringe filter and injected in HPLC. (Chromatograph of fresh sample as a reference)
To conduct forced degradation study on API, standard stock solution was prepared using above procedure. These solutions subjected to acid hydrolysis i.e. refluxing with 0.1 N HCL at 700C. The mixture was neutralized by using 0.1N NAOH. Alkaline hydrolysis i.e. refluxing with 0.1N NAOH 700C. The mixture was neutralized by using 0.1N HCL. Oxidation using 5% H2O2, heating at 700C for 24 hrs. Photolysis degradation using UV Cabinet for 24 hrs. Thermal degradation using hot air oven at 700C, 24hrs.
Stress study on tablet formulation was performed by exposing tablets to oxidative, thermal, photolytic conditions. Stressed samples analyzed by validated HPLC method. Stressed samples were analyzed for peak purity via chromatograms.
RESULT AND DISCUSSION
Wavelength selection
Vit C (10μg/ml) and PRO (10μg/ml) in mobile phase were scanned separately in range of 200-400 nm.
λ max of Vit C 221nm and PRO 290nm.based on spectral characteristic and overlain spectra 221 selected as wavelength for analysis.
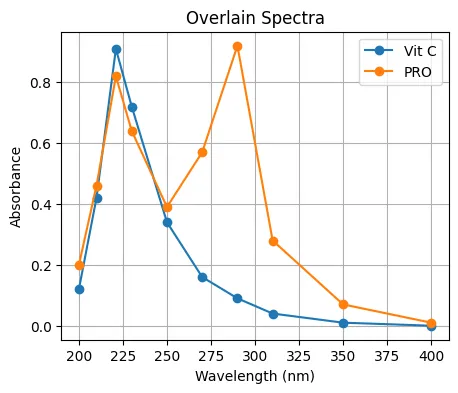
Figure 2: Overlain spectra of Vitamine C and PRO between 200- 400nm in mobile phase
Linearity and Range
Graphs were plotted concentration in μg/ml on X axis verses area on Y axis and the correlation coefficients were determined. The method was found to be linear in concentration range of 0.8-1.2μg/ml for Vit C and 64-96 μg/ml for PRO.
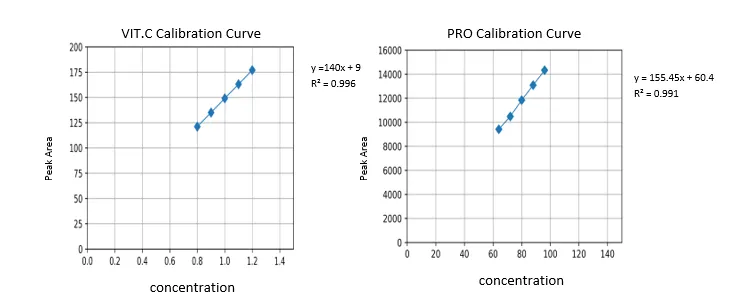
Figure 3: Calibration curve of Vitamine C and PRO by RP-HPLC method
Accuracy
This technique involves the addition of standard drug solution to preanalyzed sample solution at 80%, 100%, and 120%. The % recoveries were 100-105% (Vit C), 104- 109% (PRO).
Table 1: Result of Accuracy for RP-HPLC Method (n=3)
|
Sr. No |
Level of % Recovery |
Amount of Sample (μg/ml) |
Amount of Standard Drug Added (μg/ml) |
Total Amount Found (μg/ml) |
Amount Recovered (μg/ml) |
% Recovery |
|||||
|
Vit C |
PRO |
Vit C |
PRO |
Vit C |
PRO |
Vit C |
PRO |
Vit C |
PRO |
||
|
1 |
0 |
0.5 |
40 |
- |
- |
0.47 |
35.86 |
- |
- |
- |
- |
|
2 |
80 |
0.5 |
40 |
0.4 |
32 |
0.9 |
69.92 |
0.40 |
33.92 |
100 |
106 |
|
3 |
100 |
0.5 |
40 |
0.5 |
40 |
1.01 |
81.46 |
0.51 |
41.46 |
102 |
104 |
|
4 |
120 |
0.5 |
40 |
0.6 |
48 |
1.13 |
92.18 |
0.63 |
52.18 |
105 |
109 |
Precision
Table 2: Result of Repeatability and intermediate precision Study for Vit C and PRO
|
Repeatability |
Intermediate Precision |
|||||
|
Inj. |
Peak Area(mV) |
Peak Area at 9 am |
Peak Area at 6 pm |
|||
|
Vit C |
PRO |
Vit C |
PRO |
Vit C |
PRO |
|
|
1 |
152.42 |
11628.4 |
150.8 |
11512.6 |
152.12 |
11610.2 |
|
2 |
151.86 |
11596.8 |
151.2 |
11580.4 |
151.76 |
11592.4 |
|
3 |
152.1 |
11640.5 |
151.6 |
11602.8 |
152.02 |
11628.5 |
|
4. |
150.98 |
11492.7 |
150.9 |
11546.2 |
151.2 |
11538.7 |
|
5. |
151.54 |
11574.6 |
151.4 |
11588.5 |
151.66 |
11592.4 |
|
6. |
152 |
11602.9 |
151.1 |
11560.8 |
151.92 |
11586.1 |
|
%RSD |
0.33 |
0.44 |
0.21 |
0.29 |
0.24 |
0.27 |
Robustness
Table 3: Result of Robustness Study: Variation in Flow Rate (ml/min)
|
Inj. |
Flow Rate (ml/min) |
Analyte |
Retention Time (min) |
Tailing Factor (T) |
Theoretical Plates (N) |
Resolution (R) |
|
1. |
1 |
Vit C |
3.84 |
1.29 |
4368 |
4.58
|
|
PRO |
5.02 |
1.3 |
5642 |
|||
|
2. |
0.9 |
Vit C |
3.86 |
1.31 |
4218 |
4.71
|
|
PRO |
5.04 |
1.32 |
6486 |
|||
|
3. |
1.1 |
Vit C |
3.82 |
1.33 |
4424 |
4.46 |
|
PRO |
5.01 |
1.34 |
5780 |
Assay
The amounts of Vit C and PRO in marketed formulation were 107% and 101% respectively
System Suitability Testing
Table 4: Results of System Suitability Parameters
|
Analyte |
Retention Time (min) |
Tailing Factor (T) |
Theoretical Plates (N) |
Resolution (R) |
|
Vit C |
3.83 |
1.3 |
4368 |
4.59 |
|
PRO |
5.02 |
1.31 |
5642 |
Table 5: Forced Degradition Study of Vitamine C and PRO
|
Name |
Condition |
Time |
% Recovery |
% Degradation |
|
Vit C Standard |
Acid hydrolysis / 0.1N HCL/heating at 700C |
1 hrs |
41.2 |
58.8 |
|
Alkaline hydrolysis/0.1N HCL/heating at 700C |
24hrs |
87.6 |
12.4 |
|
|
Oxidation/Room temp. |
24 hrs |
85.1 |
14.9 |
|
|
Photolysis /UV Cabinet |
24 hrs |
98.5 |
1.5 |
|
|
Thermal Hot air oven/700C |
24hrs |
97.4 |
2.6 |
|
|
Vit C Sample |
oxidation/5% H2O2 |
24 hrs |
83.4 |
16.6 |
|
Photolysis/ UV Cabinet |
24 hrs |
97.2 |
2.8 |
|
|
Thermal/Hot-air oven/700C |
24 hrs |
96.5 |
3.5 |
|
|
PRO Standard |
Acid hydrolysis/ 0.1N HCL/heating at 700C |
24 hrs |
98.1 |
1.9 |
|
Alkaline hydrolysis/ 0.1N NAOH/heating at 700C |
24 hrs |
73.6 |
26.4 |
|
|
oxidation/ 5% H2O2 /heating at 700C |
24 hrs |
75.2 |
24.8 |
|
|
Photolysis/ UV Cabinet |
24 hrs |
85.8 |
14.2 |
|
|
Thermal /Hot air oven/700C |
24 hrs |
95.4 |
4.6 |
|
|
PRO Sample |
oxidation/5% H2O2 |
24 hrs |
73.6 |
26.4 |
|
Photolysis/ UV Cabinet |
24 hrs |
84.2 |
15.8 |
|
|
Thermal/Hot-air oven/700C |
24 hrs |
94.1 |
5.9 |
CONCLUSION
Developed RP-HPLC method was simple, accurate, precise, linear, robust, economical can be applied for routine analysis of Ascorbic acid and Propranolol hydrochloride in tablet dosage form
Results of stress study shows there was no other co-eluting peak with main peak and method is specific for estimation of Ascorbic acid and Propranolol hydrochloride in presence of their degradation products. Developed method is stability indicating method can be used for routine estimation of Vit C and PRO in tablet dosage form
REFERENCES


Vinit Patil*, Nilesh Patole, Ananda Waghmode, Nagaraju Potnuri, Stability Indicating Rp-Hplc Method Development and Validation for the Simultaneous Determination of Propranolol Hydrochloride and Ascorbic Acid in Tablet Dosage Form, Int. J. of Pharm. Sci., 2026, Vol 4, Issue 6, 6881-6890. https://doi.org/ 10.5281/zenodo.20938740
 10.5281/zenodo.20938740