

We use cookies to ensure our website works properly and to personalise your experience. Cookies policy
DJPS college of pharmacy, Pathri Parbhani Maharashtra 4315061.
Objective:To develop and validate a simple, rapid, accurate, precise, and stability-indicating reverse-phase high-performance liquid chromatography (RP-HPLC) method for the simultaneous estimation of selected marker compounds from Echinops echinatus, and to evaluate the stability of the marker compounds through forced degradation studies in accordance with ICH guidelines.Methods:A stability-indicating RP-HPLC method was developed by optimizing the chromatographic conditions, including the mobile phase composition, stationary phase, flow rate, detection wavelength, and column temperature, to achieve efficient separation of the selected marker compounds and their degradation products. The developed method was validated for system suitability, specificity, linearity, accuracy, precision, robustness, limit of detection (LOD), limit of quantification (LOQ), and solution stability as per ICH Q2(R2) guidelines. Forced degradation studies were performed under acidic, alkaline, oxidative, thermal, photolytic, and hydrolytic stress conditions to assess the degradation behavior and demonstrate the stability-indicating capability of the method.1,2Results:The optimized RP-HPLC method provided well-resolved and symmetrical peaks for the selected marker compounds with satisfactory chromatographic performance. The validation results demonstrated excellent linearity over the selected concentration range, with correlation coefficients (R²) greater than 0.999. The method exhibited acceptable accuracy, precision, specificity, robustness, and sensitivity, meeting the acceptance criteria recommended by ICH guidelines. Forced degradation studies revealed that the marker compounds underwent varying degrees of degradation under different stress conditions, while the degradation products were effectively separated from the analyte peaks, confirming the stability-indicating nature of the developed method.Conclusion:The developed RP-HPLC method is simple, reliable, precise, accurate, and stability-indicating for the analysis of Echinops echinatus
Medicinal plants have served as an important source of therapeutic agents for centuries and continue to play a significant role in modern healthcare systems. The growing global demand for herbal medicines has highlighted the need for scientifically validated analytical methods to ensure their quality, safety, efficacy, and consistency. Unlike synthetic drugs, herbal materials contain complex mixtures of phytoconstituents whose chemical composition may vary depending on geographical origin, harvesting conditions, processing, and storage. Therefore, the standardization of herbal products through the identification and quantification of characteristic marker compounds has become an essential component of quality control.2,3,4
Echinops echinatus Roxb., belonging to the family Asteraceae, is a medicinal plant widely distributed in India and other parts of Asia. It has been traditionally used in the treatment of inflammation, fever, microbial infections, reproductive disorders, liver ailments, and various other health conditions. Pharmacological investigations have demonstrated that the plant possesses diverse biological activities, including anti-inflammatory, antioxidant, antimicrobial, hepatoprotective, analgesic, and immunomodulatory effects. These therapeutic properties are primarily attributed to the presence of bioactive phytochemicals such as flavonoids, phenolic compounds, alkaloids, triterpenoids, and other secondary metabolites. The quantitative determination of selected marker compounds is therefore important for establishing the identity and quality of E. echinatus and its formulations.
Reverse-phase high-performance liquid chromatography (RP-HPLC) is one of the most widely employed analytical techniques for the qualitative and quantitative analysis of phytochemicals because of its high sensitivity, selectivity, reproducibility, and suitability for complex herbal matrices. The development of a stability-indicating RP-HPLC method is particularly valuable, as it enables the separation of marker compounds from their degradation products and potential impurities, thereby ensuring reliable analysis throughout the product's shelf life. Such methods are essential for routine quality control, stability assessment, formulation development, and regulatory compliance.5,6
Method validation is a critical step in analytical method development and is performed to demonstrate that the method consistently produces reliable and reproducible results for its intended purpose. According to the International Council for Harmonisation (ICH) guidelines, analytical methods should be evaluated for parameters such as specificity, linearity, accuracy, precision, robustness, sensitivity, and solution stability. In addition, forced degradation studies conducted under acidic, alkaline, oxidative, thermal, photolytic, and hydrolytic stress conditions provide valuable information regarding the intrinsic stability of the analytes and establish the stability-indicating capability of the developed method.7,8
The objective of the present study was to develop and validate a stability-indicating RP-HPLC method for the analysis of selected marker compounds of Echinops echinatus and to evaluate their degradation behavior under various forced degradation conditions in accordance with ICH guidelines.
MATERIALS AND METHODS
The whole plant of Echinops echinatus was authenticated and shade-dried before being powdered for analysis. HPLC-grade methanol, acetonitrile, water, orthophosphoric acid, hydrochloric acid, sodium hydroxide, and hydrogen peroxide (Merck KGaA, Darmstadt, Germany) were used throughout the study. The reference standard of the selected marker compound was obtained from a certified commercial supplier.
Chromatographic analysis was performed using an Agilent 1260 Infinity II RP-HPLC system (Agilent Technologies, Santa Clara, CA, USA) equipped with a C18 column (250 mm × 4.6 mm, 5 µm). Standard and sample solutions were prepared in HPLC-grade methanol, filtered through a 0.45 µm membrane filter, and analyzed under optimized chromatographic conditions.9,10,11
The developed RP-HPLC method was validated according to ICH Q2(R2) guidelines for specificity, linearity, accuracy, precision, robustness, limit of detection (LOD), and limit of quantification (LOQ). Forced degradation studies were carried out under acidic, alkaline, oxidative, thermal, photolytic, and neutral hydrolytic conditions to evaluate the stability-indicating capability of the method.
As the study involved only plant material and analytical experiments, ethical approval was not required. All experiments were performed in triplicate, and the results were expressed as mean ± standard deviation (SD). Statistical analysis was carried out using GraphPad Prism version 10.0, with statistical significance considered at p < 0.05.12,13
A stability-indicating RP-HPLC method was developed for the analysis of the selected marker compounds of Echinops echinatus. Standard and sample solutions were prepared in HPLC-grade methanol and filtered through a 0.45 µm membrane filter before analysis. Chromatographic conditions, including the mobile phase composition, flow rate, detection wavelength, and column temperature, were optimized to achieve satisfactory separation and peak resolution.
The optimized method was validated according to ICH Q2(R2) guidelines by evaluating system suitability, specificity, linearity, accuracy, precision, robustness, limit of detection (LOD), and limit of quantification (LOQ).14,15
Forced degradation studies were performed by exposing the marker compounds and plant extract to acidic, alkaline, oxidative, thermal, photolytic, and neutral hydrolytic stress conditions. The stressed samples were analyzed using the developed RP-HPLC method to assess degradation behavior and to confirm that the method could effectively separate the marker compounds from their degradation products.16
RESULTS
Extraction of Flower of Echinopus echinatus The flowers of plant shade dried were powdered and extracted with various solvent. The appearance and percent yield of extracts are reported as
follows:
Table No. 1-Separation of marker compound by column chromatography
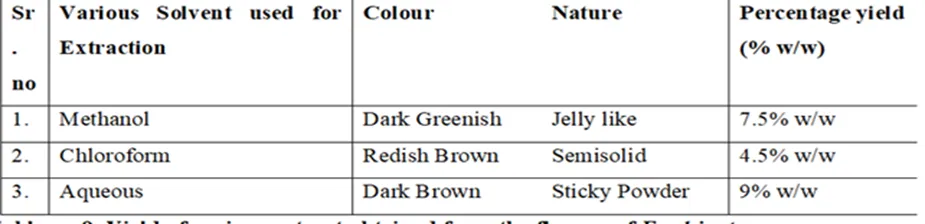
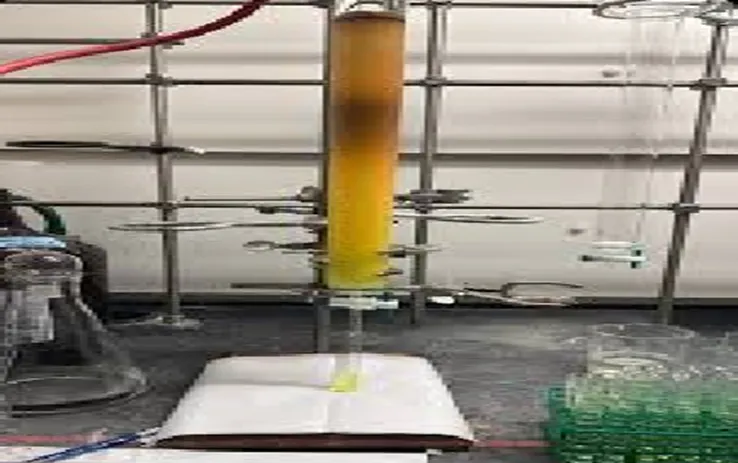
Fig No :1 TLC Identification Around 0.35–0.50 Rf value was noted and it is in the acceptable range
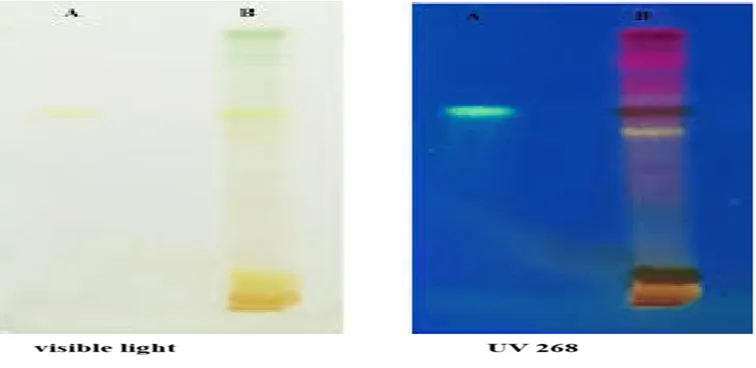
Fig No 2- UV-Visible Spectroscopy Dissolve sample in methanol and get clear λmax (approx.) at 268 nm and it show exact same for std
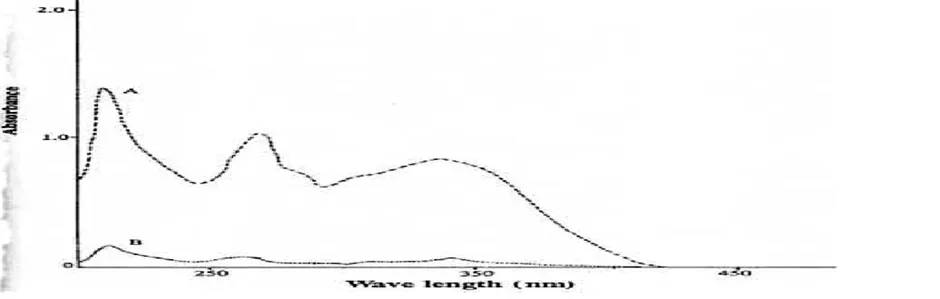
Fig No 3-Development and validation of RP-HPLC method-
The present work, carried out to develop and validate simple, selective, sensitive, rugged and reproducible method for quantitative determination of flower of Echinopus echinatus. The analytical method based on RP-HPLC using UV detection was developed and validated for determination of drug as chemical constituent Apigenin 7-O-glucoside .The acidic pH range was found suitable for solubility, resolution, stability, theoretical plates and peak shape of all three drugs components. Best results were obtained with ortho-phosphoric acid (0.1% v/v) solution to improve the peak shape of Apigenin 7-O-glucoside. Finally, mobile phase composition consisting of a mixture water pH 3 and acetonitrile 50:50 % v/v. Optimized mobile phase proportion was providing good resolution. For the selection of organic constituent of mobile phase, acetonitrile was chosen to reduce the longer retention time and to attain good peak shape.The acidic pH 3 of double distilled water as one of the solvent of mobile phase was found suitable for solubility, resolution, stability and peak shape of all components.Initial trials were taken using various organic solvents in different proportions. The observations and found are given below.17,18
|
Trials No. |
Mobile phase |
Observations |
|
|
Organic solvent |
Ratio |
||
|
1a |
Methanol: Water |
70:30 |
Not found suitable due to poor resolution of peak and tailing |
|
1b |
Methanol: Water |
65:35 |
Not found suitable peak due to tailing occurred |
|
1c |
Methanol: Water |
60:40 |
Did not found sharp resolution may be because of contaminated water or mobile phase composition |
|
2a |
Methanol: OPA at pH 2.51 |
65:35 |
Not found suitable due to poor resolution of peak and tailing |
|
2b |
Methanol: OPA at pH 2.51 |
60:40 |
Did not found sharp resolution may be because of improper pH or mobile phase composition |
|
2c |
Methanol: OPA at pH 3 |
70:30 |
Not found suitable due to tailing of peak |
|
2d |
Methanol: OPA at pH 3 |
65:35 |
Found better resolution but irregular baseline obtained may be because of mobile phase contaminated or detector cell contaminated |
|
3a |
Methanol: Phosphate buffer at pH 3.4,flow rate 1ml/min |
25:75 |
Apigenin 7-O-glucoside resolved properly but tailing in peak |
|
3b |
Methanol: Phosphate buffer at pH 3.4,flow rate 1ml/min |
30:70 |
Not found suitable due to tailing |
|
3c |
Methanol: Phosphate buffer at pH 3.4,flow rate 1ml/min |
40:60 |
Properly resolved peak but showed tailing |
|
3d |
Methanol: Phosphate buffer at pH 3.4,flow rate 1ml/min |
45:55 |
Found sharp peak but showed tailing |
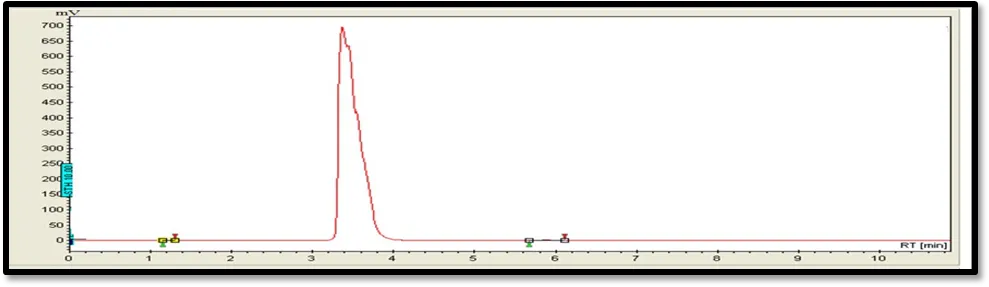
Fig No 4 Chromatogram of Trial no.1a (Methanol: Water with Composition 70:30v/v)
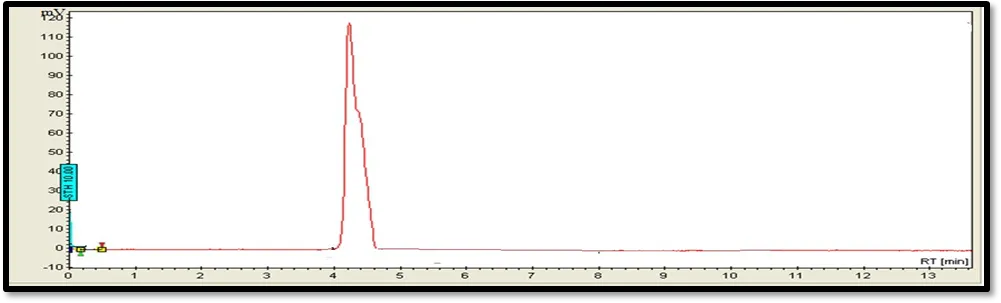
Fig No 5 Chromatogram of Trial 1b (Methanol: Water with composition 65:35v/v)
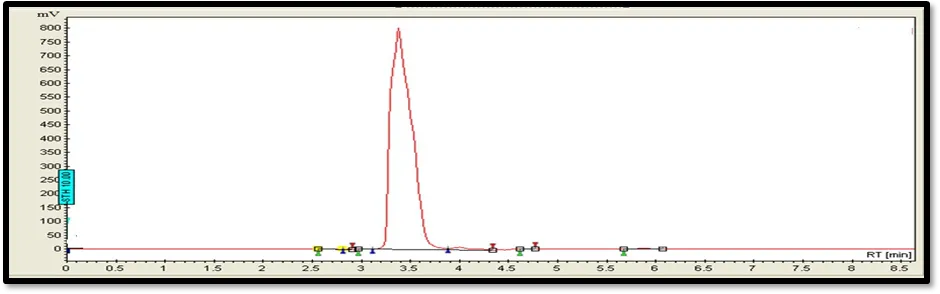
Fig No 6-Chromatogram of Trial no.1c (Methanol: Water with proportion 60:40v/v)
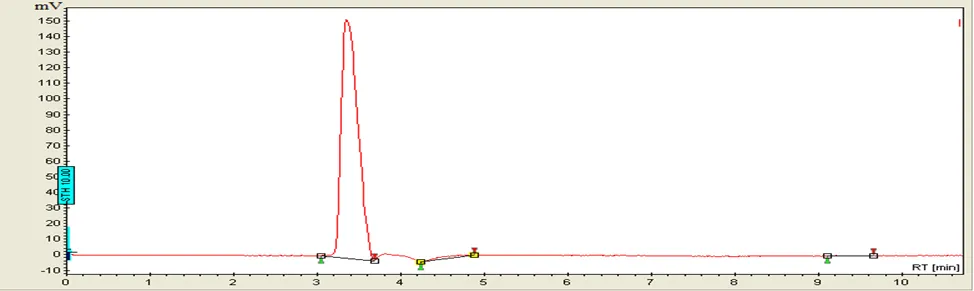
Fig No 7-Chromatogram of Trial no.2a (Methanol: OPA at pH 2.51 with ratio 65: 35v/v
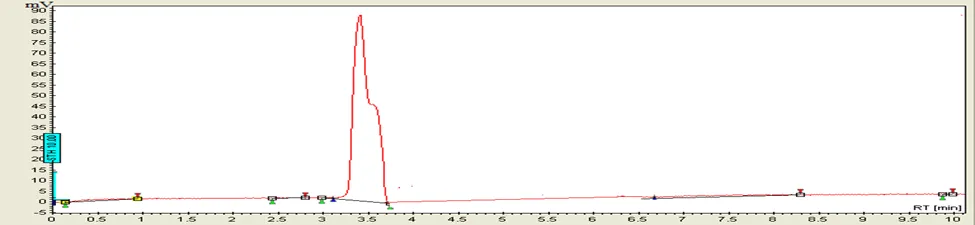
Fig No 8 - Chromatogram of Trial no.2b (Methanol: OPA at pH 2.51 with ratio 60:40v/v)
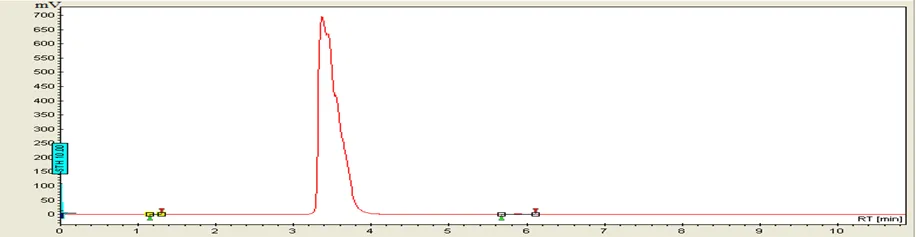
Fig No 9- Chromatogram of Trial no.2c (Methanol: OPA at pH 3 with ratio 70:30v/v)
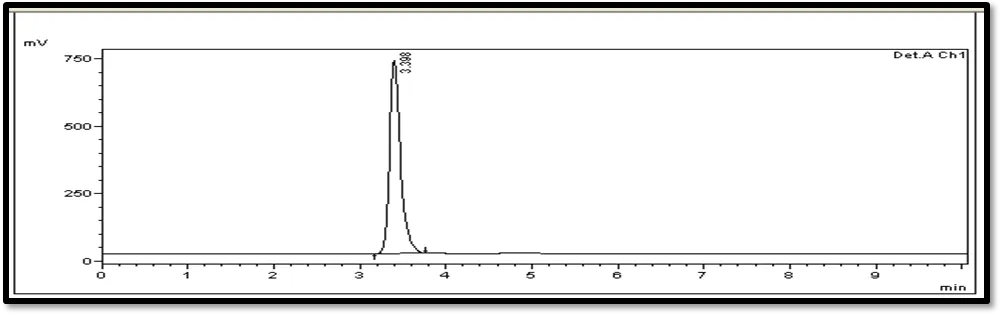
Fig No 10-Chromatogram obtained in Optimized mobile phase (Methanol: Phosphate buffer at pH 3.4 with 45:55v/v proportion with flow rate 1ml/min)
Validation of Drugs (Apigenin 7-O-glucoside.)
a) Linearity and range of standard drugs
Standard solutions ranging from 20-100 µg/ml of Apigenin 7-O-glucoside. was prepared. Concentration plotted on y- axis and peak area plotted on X- axis. The Apigenin 7-O-glucoside. showed good correlation coefficient in concentration range 20-100 µg/ml of 0.999. The linearity plot is drawn in figure Y-intercept and Slope of regression line were found to be 61320.1 and 15.14 of Apigenin 7-O-glucoside.. The correlation coefficient (R2) value for Apigenin 7-O-glucoside. was found to be within acceptable limits. This indicated that the method is linear between the concentrations for 20-100 µg/ml of Apigenin 7-O-glucoside.19,20
Table no.11 concentrations
|
Sr.No. |
Conc. µg/ml |
Peak area |
|
1 |
20 |
1017570 |
|
2 |
40 |
2400037 |
|
3 |
60 |
3514433 |
|
4 |
80 |
4624224 |
|
5 |
100 |
6052443 |
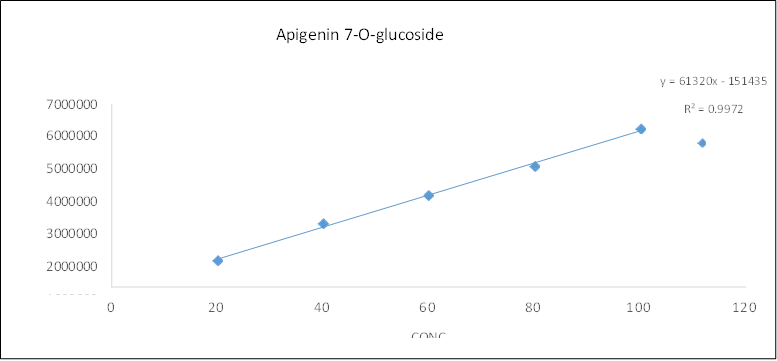
Fig No.-11 Concentration Apigenin 7-O-Glucoside
Range was inferred from the data of accuracy and linearity that the established range for the estimation of Apigenin 7-O-glucoside was between the concentration ranges of 20 % to 100 %. Thus, the range was established as 20-100 µg/ml of Apigenin 7-O-glucoside. Study of Linearity and Range
|
Drug |
Range (µg/ml) |
Peak Area |
Average |
± SD |
% RSD |
||
|
Apigenin 7-O-glucoside |
20 |
1017570 |
1012281 |
1015281 |
1015044 |
2652.4530 |
0.26 |
|
40 |
2400037 |
2410570 |
2340686 |
2383764 |
37676.82 |
1.58 |
|
|
60 |
3514433 |
3416661 |
3418136 |
3449677 |
56027.74 |
1.62 |
|
|
80 |
4624224 |
4661646 |
4397473 |
4561114 |
14294.4 |
0.31 |
|
|
100 |
6052443 |
6067808 |
6090012 |
6070088 |
18887.96 |
0.31 |
|
1) System suitability parameter
From table 5 all the system suitability parameters are within the acceptable range indicating the suitability of the method for estimation of Apigenin 7-O-glucoside 21
Table No. System Suitability Parameters
|
Sr. No |
Parameter |
Observed values |
Recommended value |
|
Apigenin 7-O-glucoside |
|
||
|
1 |
Retention time(min) |
3.31 |
|
|
2 |
Tailing factor |
1.4 |
≤ 2 |
|
3 |
Capacity factor |
1.041 |
> 1 |
|
4 |
Resolution |
0.00 |
> 2 |
|
5 |
Theoretical plates |
11313 |
>2000 |
|
6 |
% RSD (The retention time) |
1.07 |
≤ 2 |
2) Limit of Detection & Limit of Quantification-
Lower LOD and LOQ value indicates high sensitivity of the method. The limit of detection (LOD) and limit of quantitation (LOQ) were determined by calculating the signal to noise (S/N) ratio of the LOD preparation and LOQ preparation. The Limit of detection (LOD) and Limit of Quantitation (LOQ) were evaluated from calibration curve of linearity data.22,24
Table No.14 Result of LOD and LOQ.
|
Drug |
Conc µg/ml |
Peak area (mv.min) |
SD * |
Slope |
LO D Pp m |
LOQ Ppm |
|||
|
SFZ |
|
Replicate |
Replicate |
Replicate |
Mean of |
|
6149 |
0.7 |
2.21 |
|
|
1 |
2 |
3 |
peak area |
7.1 |
3 |
|||
|
20 |
1017570 |
1012281 |
1015281 |
1015044 |
2652.4 |
||||
|
|
40 |
2400037 |
2410570 |
2340686 |
2383764.3 |
37676.8 |
|
|
|
|
|
60 |
3514433 |
3416661 |
3418136 |
3449743.3 |
56027.7 |
|
|
|
|
|
80 |
4624224 |
4661646 |
4397473 |
4561114.3 |
14294.42 |
|
|
|
|
|
100 |
6052443 |
6067808 |
6090012 |
6070087.6 |
18887.9 |
|
|
|
3) Accuracy and analyte Recovery -
Recovery studies were conducted at three levels i.e. 80%, 100% and 120% of target concentration. It was carried out by adding known amount of standard drug of sample Apigenin 7-O-glucoside to the pre-analyzed. The mixed sample solutions were analyzed to obtained peak, retention time, and area under curve respectively. The concentration of Apigenin 7-O-glucoside was calculated from area under curve of peak. At each concentration three were performed and obtained were compared with standard results. The % RSD of accuracy study was found to be within specific limit and thus we can concluded that the developed method is suitable for assay and there is no interference of excipients.25 The recovery data from the study were reported in Table:
Spiked Concentration
Table No.15 Accuracy study of Apigenin 7-O-glucoside
|
Spiked Concentration (µg/ml) |
Mean , ±SD, % RSD |
% recovery |
|
80 |
79.97±0.41, 0.51 |
99.87 |
|
100 |
100.74±1.10,1.09 |
99.16 |
|
120 |
120.17±0.69, 0.58 |
100.53 |
4) Precision-
Method precision was demonstrated by preparing six test solutions at 100% concentration as per the test procedure & recording the chromatograms of six test solutions. The % RSD of six samples was calculated. Intermediate precision of the analytical method was determined by performing method precision on another day by different analysts under same experimental condition. The % RSD values were found to be within specified limit (<2%), which indicates that the developed method is precise.26,27 The results 20 µg/ml of standard drug solution (Apigenin 7-O-glucoside) was repeated for five times and the peak area was determined and was found to be consistent. The result are shown in Table no.
Table No.16 Repeatability data of Apigenin 7-O-glucoside
|
Sr. No. |
Concentration |
Peak area |
|
Apigenin 7-O-glucoside |
||
|
1 |
20 µg/ml |
1017169 |
|
2 |
20 µg/ml |
1012460 |
|
3 |
20 µg/ml |
1015965 |
|
4 |
20 µg/ml |
1013815 |
|
5 |
20 µg/ml |
1014301 |
|
Mean |
1014742 |
|
|
SD |
1847.11 |
|
|
% RSD |
0.18 |
|
Intraday precision-
The % RSD for retention time and area was found to be 0.18 of Apigenin 7-O-glucoside, % RSD is not more than 2 and is found within the specified limit.28
Table No.17 Results of Intraday precision of Apigenin 7-O-glucoside
|
Injection No. |
Apigenin 7-O-glucoside |
|
|
Retention time |
Area |
|
|
1 |
3.39 |
1017150 |
|
2 |
3.31 |
1012510 |
|
3 |
3.31 |
1015965 |
|
4 |
3.37 |
1013825 |
|
5 |
3.34 |
1014308 |
|
Mean |
3.344 |
1014751.6 |
|
SD |
0.035 |
1823.78 |
|
% RSD |
1.07 |
0.18 |
Inter day precision
The % RSD for retention time was found to be 0.15 of Apigenin 7-O-glucoside which is within specified limit of % RSD not more than 2
|
Injection No. |
Apigenin 7-O-glucoside |
|
|
Retention time |
Area |
|
|
1 |
3.39 |
1016134 |
|
2 |
3.31 |
1012505 |
|
3 |
3.31 |
1015960 |
|
4 |
3.37 |
1013825 |
|
5 |
3.34 |
1014311 |
|
Mean |
3.344 |
1014547 |
|
SD |
0.035 |
1521.66 |
|
% RSD |
1.07 |
0.15 |
Result of Interday precision of Apigenin 7-O-glucoside Robustness-
Deliberation variations were made in the method and % RSD was calculated plus and minus flow rate and mobile phase ratios were the variations that were analyzed. Small but deliberate variations were made in the method parameters and it was found that % RSD values for all the variations were in acceptable limits. This indicated that the method is robust and it can be used within small variations of flow rate and mobile phase, without having measure effect on the result.29
Table No.19 Result of Robustness of Apigenin 7-O-glucoside
|
Parameter |
Apigenin 7-O-glucoside |
|
Flow rate |
Retention time |
|
0.8 |
3.91 |
|
1.2 |
3.64 |
|
Mean±SD |
3.775±0.19 |
|
Mobile phase (Organic : aqueous) |
Retention time |
|
45:55 |
3.45 |
|
47:53 |
3.80 |
|
Mean±SD |
3.625±0.24 |
Ruggedness-
Result obtained by different analyst and different day were found within acceptable limit, which shows that test method is rugged.
Table No.20 Result of Ruggedness of Apigenin 7-O-glucoside
|
Injection No. |
Analyst Ι |
Analyst ΙΙ |
|
|
Area |
Area |
|
1 |
2400079 |
2400580 |
|
2 |
2400086 |
2400193 |
|
Average |
2400082.5 |
2400386.5 |
|
SD |
4.949747 |
273.6503 |
|
% RSD |
0.00 |
0.01 |
Stability indicating assay methods-
In order to determine whether the analytical method or assay were stability- indicating, Apigenin 7-O-glucoside were stressed under various conditions to conduct forced degradation studies. The development & validation of stability indicating assay method was carried out as per ICH guidelines ICH Q2A, Q2B, Q3B. Unfortunately, the current guidelines do not indicate detailed degradation conditions in stress testing. However, the used forced degradation conditions, stress agent concentration and time of stress, were found to show degradation of compounds which was within acceptable limit.
2) Acidic condition
Table No.21 Result of acidic degradation
|
Sr. No. |
Drug Name |
Degraded retention time |
|
1 |
Apigenin 7-O-glucoside |
5.570 |
3) Alkaline Condition-
Alkaline degradation study was performed by heating the drug content in 1 N NaOH at 80
°C for 1 hour and mixture was neutralized with 1 N HCl solutions.
Fig.No.19 Degradation of drugs by alkaline condition
Table No.22 Result of Alkaline degradation
|
Sr.No. |
Drug name |
Retention time of Degradation |
|
1 |
Apigenin 7-O-glucoside |
4.658 |
4) Neutral condition –
The neutral degradation study was carried out in room temperature for 1 hour with water.
Fig. No. 20 Degradation of drugs by neutral condition
Table No.23 Result of Neutral degradation
|
Sr. No. |
Drug name |
Retention time of Degradation |
|
1 |
Apigenin 7-O-glucoside |
4.838 |
5) Oxidative condition
Oxidation degradation study was performed by heating the drug content it’s in initial concentration carried out in 1% v/v hydrogen peroxide no significant changes then will increase into 6 % v/v hydrogen peroxide at 80 °C for 1 hours.
Fig .No. 31 Degradation of drugs by Oxidative condition
Table No.21 Result of oxidative degradation.
|
Sr. No. |
Drug name |
Retention time of Degradation |
|
1 |
Apigenin 7-O-glucoside |
4.899 |
6) Thermal condition
Thermal degraded samples wherever degradation possible from about 1% to 30%.Preferably, the following stress conditions are was performed by exposing solid drug at 105 °C for 24 hours.
|
Sr.No. |
Drug name |
Retention time of Degradation |
|
1 |
Apigenin 7-O-glucoside |
4.858 |
7) Photolytic condition
Drug content was found to be more stable than other stress condition stable in UV-light. Apigenin 7-O-glucoside is stable under UV light.
Fig .No. Degradation of drugs by photolysis condition
Table No.26 Result of photolytic condition
|
Sr.No. |
Drug name |
Retention time of Degradation |
|
1 |
Apigenin 7-O-glucoside |
8.854 |
|
9.857 |
Forced degradation study was performed by subjecting the analytes to acid, base, neutral hydrolysis, hydrogen peroxide mediated hydrolysis and photolytic conditions. The results of Stability Indicating Assay Method (percent degradation, peak area of degradation) of degradation studies are summarized.
The percentage degradation of Apigenin 7-O-glucoside is more in hydrogen peroxide mediated oxidative degradation condition and less in thermal hydrolysis. of
the method was demonstrated as no degradation products from different stress conditions affected the detection and quantification of Apigenin 7-O-glucoside.The acidic treated sample with various trace conditions had difference which was within acceptable limit. Thus the degradation amount was not exceeding the limit which indicates that method is stable even in all stress conditions of acid, base, neutral, peroxide, thermal, & photolysis.30
Table No.27 Result of Stability indicating assay methods.
|
Types of Degradation |
Peak area % of Degradation |
% of Degradation |
|
|
Apigenin 7-O-glucoside |
|||
|
Acidic |
6990 |
- |
4.58 |
|
Base |
19507 |
- |
9.78 |
|
Neutral |
2794 |
3772 |
17.21 |
|
Oxidative |
3199 |
- |
2.20 |
|
Photo |
8102 |
1274 |
8.70 |
|
Thermal |
3298 |
5124 |
8.71 |
|
Acidic |
6990 |
- |
4.58 |
CONCLUSION
In this present work RP-HPLC method development and validation as per regulatory requirements along with Stability Indicating Assay Methods is discussed.
HPLC method is available for simultaneous determination of Apigenin 7-O-glucoside in various plant like Chameli, Night Jasmine and various other plants but , No RP-HPLC method is available for simultaneous determination of Apigenin 7-O-glucoside from the flower part of echinopus echinatus roxob plant Similarly no studies have been carried out on Stability Indicating Assay methods for simultaneous determination of Apigenin 7-O-glucoside. This constituent is used as Anti-inflammatory, antioxidant, and anti-cancer agents. Hence this combination is selected for simultaneous estimation using HPLC method and Stability indicating assay method. HPLC remains the method of choice because it gives more sensitive results along with greater accuracy. It can be used both for qualitative as well as quantitative analysis. Isocratic method involves increase in solvent strength with time. This method is chosen since a sample containing compounds of a wide range of polarities can be separated by a isocratic elution in a shorter time period without a loss of resolution in the earlier peaks or excessive broadening of later peaks. Force degradation studies on Apigenin 7-O-glucoside were carried at different stress conditions like acid, base, oxidation, thermal, Photolysis degradation, to check the stability of the drugs. The percentage degradation of Apigenin 7-O-glucoside is more in hydrogen peroxide mediated oxidative degradation and less in thermal hydrolysis. The Apigenin 7-O-glucosid is degraded more in acid hydrolysis and less in photolytic condition. The stability indicating nature and specificity of the method was demonstrated as no degradation products from different stress conditions affected the detection and quantification of Apigenin 7-O-glucosid. The method was found to be stability indicating from the forced degradation studies which was found to be within limit and thus can be used for the simultaneous estimation of Apigenin 7-O-glucoside . The RP-HPLC method was validated and found to be specific, linear, accurate, precise and reproducible. Thus it is concluded that the developed method can be thus successfully applied to analyze various formulations containing Apigenin 7-O-glucoside
AKNOWLEGEMENT
The authors are grateful to the DJPS College of Pharmacy, Pathri for providing research facilities.
FUNDING
Nil
AUTHORS CONTRIBUTIONS
All the authors have contributed equally
CONFLICTS OF INTERESTS
Declare none
REFERENCES
Arora, D., et al. Validated RP-HPLC Method for Determination of Flavonoids in Traditional Medicinal Plants. Phytochemistry Letters, 2018; 25:45–52.
Arora, D., et al. Validated RP-HPLC Method for Determination of Flavonoids in Traditional Medicinal Plants. Phytochemistry Letters, 2018; 25:45–52.

Dhanshree Mule, Kanchan Jamkar, Ramesh Ingole, Stability-Indicating RP-HPLC Method Development and Validation with Forced Degradation Studies of Echinops echinatus Marker Compounds, Int. J. of Pharm. Sci., 2026, Vol 4, Issue 7, 4516-4530, https://doi.org/10.5281/zenodo.21491862
 10.5281/zenodo.21491862