
We use cookies to ensure our website works properly and to personalise your experience. Cookies policy
Mandesh Institute of Pharmaceutical Science and Research Center, Mhaswad, Maharashtra, India. 415509.
This study presents a systematic Analytical Quality by Design (AQbD) approach for the development and validation of a robust Reverse-Phase High-Performance Liquid Chromatography (RP-HPLC) method for the quantitative estimation of Rivaroxaban in tablet dosage forms. Utilizing a Central Composite Design (CCD), the study systematically investigated the influence of critical method parameters—specifically mobile phase composition and flow rate—on chromatographic responses, including retention time, peak area, and theoretical plates. The experimental design and optimization were undertaken using Design-Expert® software, with statistical significance evaluated via Analysis of Variance (ANOVA). A mobile phase of Methanol:0.1% Acetic Acid (83.4:16.6, v/v) at a flow rate of 0.93 mL/min and detection at 248 nm made up the ideal chromatographic conditions. Excellent specificity, linearity (10–50 µg/mL; R² > 0.999), accuracy, precision, and robustness were demonstrated by the method, which was verified in accordance with International Council for Harmonization (ICH) Q2(R2) requirements. The assay of marketed tablet formulations was successfully conducted using the validated method, producing results that were in line with label claims. This study confirms that the AQbD-based RP-HPLC method is a simple, reliable, and reproducible tool suitable for routine pharmaceutical quality control, offering enhanced regulatory compliance and process understanding compared to traditional empirical methods.
Rivaroxaban (RBN) is a novel, direct acting, target-specific, potent oral anticoagulant drug. By potentially reducing both free and clot-bound coagulation factor Xa (Vitamin K dependent plasma protein) and prothrombinase activity, it operates at a critical point in the blood-clotting process; hence, efficient inhibition of thrombin production results in an extension of the clotting time [1]. It is used to treat and prevent stroke in adult patients with atrial fibrillation, suppress cardiovascular events linked to acute coronary syndrome, and avoid venous thromboembolism in patients undergoing selected hip or knee replacement surgery [2]. RBN is a great substitute for low molecular weight heparins in the management and avoidance of pulmonary embolism and deep vein thrombosis linked to cancer [3].
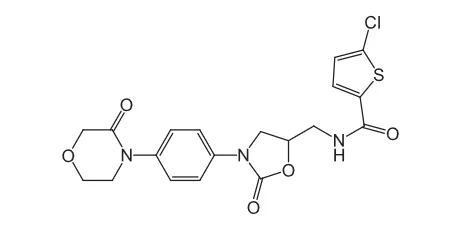
Figure 1. Chemical structure of rivaroxaban[23]
Selecting appropriate experimental circumstances to precisely quantify a medicine in the presence of excipients, contaminants, and degradation products is the main goal of analytical technique development. Robustness, reproducibility, accuracy, precision, and specificity are all desirable characteristics of an ideal analytical method [4]. The most used method for rivaroxaban analysis is reverse-phase high-performance liquid chromatography (RP-HPLC) because of its precision, accuracy, and repeatability [5]. For moderately polar medicinal compounds, RP-HPLC provides good separation, peak symmetry, and reproducibility [6].
Pharmaceutical QbD is a systematic approach to development that starts with predetermined goals and focuses on understanding and controlling products and processes using strong science and quality risk management [7].
The QbD approach must accurately map product attributes to process parameters by ensuring the product’s area of design ’, a space with several dimensions consisting of various qualities, is identified and explained.[8] Quality by design (QbD) in the production process can be linked to many concepts connected to similar notions in developing analytical methodologies [9]. The analytical target profile (ATP), which describes the goal of the measurement, is the first step in analytical QbD (AQbD). The crucial method parameters (CMPs), which are based on comprehensive analysis and evaluation of risk approaches, are then thoroughly examined to emphasize the significance of completely understanding the analytical system. The design space (DS) is the multidimensional area of the CMPs' successful operating ranges that generates the desired values for the critical method attributes (CMAs) [10].
2. MATERIALS AND METHODS
2.1 Materials
Rivaroxaban working standard was obtained as a gift sample from a prominent pharmaceutical producer and used without additional purification. Methanol (HPLC grade), acetic acid (analytical grade), and distilled water were employed throughout the investigation. For assay and validation investigations, commercially available rivaroxaban tablets with 20 mg of the medication were purchased from the neighborhood market.
2.2 Instrumentation
Chromatographic analysis was performed using an Agilent 1100 Series HPLC system equipped with a Diode Array Detector (DAD) and ChemStation software. Separation was achieved using an Agilent Eclipse XDB C18 column (250 mm × 4.6 mm, 5 µm particle size). A Shimadzu analytical balance was used for weighing, while sonication was carried out using an ultrasonic bath. All solutions were filtered through a 0.45 µm membrane filter prior to analysis [11].
Table 1. Instrumentation Used
|
Instrument |
Specification |
|
HPLC System |
Agilent 1100 Series |
|
Detector |
DAD |
|
Software |
ChemStation |
|
Column |
Agilent Eclipse XDB C18 |
|
Column Dimension |
250 × 4.6 mm |
|
Particle Size |
5 µm |
|
Analytical Balance |
Shimadzu |
|
Sonicator |
Ultrasonic Bath |
|
Filter |
0.45 µm Membrane Filter |
2.3 Chromatographic Conditions
Using a mobile phase made up of methanol and 0.1% acetic acid, chromatographic separation was carried out using an Agilent Eclipse XDB C18 column. The composition of the optimized mobile phase was kept at 83.4:16.6 (v/v). Using a DAD detector, the flow rate was adjusted to 0.93 mL/min and detection was done at 248 nm. Chromatographic analysis was carried out under isocratic elution at room temperature using a 20 µL injection volume. RP-HPLC techniques have been shown to effectively separate and estimate rivaroxaban under similar chromatographic circumstances [12].
Table 2. Optimized Chromatographic Conditions
|
Parameter |
Condition |
|
Column |
Agilent Eclipse XDB C18 (250 × 4.6 mm, 5 µm) |
|
Mobile Phase |
Methanol : 0.1% Acetic Acid (83.4 : 16.6 v/v) |
|
Flow Rate |
0.93 mL/min |
|
Detection Wavelength |
248 nm |
|
Injection Volume |
20 µL |
|
Detector |
DAD |
|
Temperature |
Ambient |
|
Elution Mode |
Isocratic |
2.4 Preparation of Standard Solution
A 10 mg working standard was precisely weighed and then transferred into a 10 mL volumetric flask to create a stock solution containing 1000 µg/mL of rivaroxaban. The medication was dissolved in methanol and the volume was adjusted to the mark with the same solvent. For linearity and optimization experiments, working standard solutions of 10, 20, 30, 40, and 50 µg/mL were created by appropriately diluting the stock solution with the mobile phase [13,14].
2.5 Preparation of Sample Solution
Twenty rivaroxaban tablets were precisely weighed and ground into a fine powder. To acquire a concentration of 1000 µg/mL, a quantity of powder equal to 10 mg of rivaroxaban was put into a 10 mL volumetric flask, dissolved in the mobile phase, sonicated for full extraction, and diluted to volume using the same solvent. Prior to analysis, the solution was passed through a 0.45 µm membrane filter. An aliquot of the filtered stock solution was further diluted with mobile phase to achieve a final concentration of 40 µg/mL for assay measurement [15,16].
3. SYSTEMATIC QBD APPROACH FOR METHOD DEVELOPMENT
3.1 Analytical Target Profile (ATP)
The Analytical Target Profile (ATP) was established to create an RP-HPLC approach for quantitatively estimating rivaroxaban in tablet dose forms that is straightforward, accurate, precise, robust, and dependable. Acceptable retention time, peak symmetry, column efficiency, and adherence to ICH validation standards were among the intended analytical outcomes. The AQbD architecture is based on ATP, which specifies the analytical method's performance standards and intended use [17].
Table 3. Analytical Target Profile
|
Parameter |
Target Criteria |
|
Retention Time |
< 10 min |
|
Tailing Factor |
≤ 2.0 |
|
Theoretical Plates |
> 2000 |
|
Precision (%RSD) |
< 2.0 |
|
Accuracy (% Recovery) |
98–102% |
3.2 Risk Assessment
Analytical variables that could have a substantial impact on chromatographic performance were identified through risk assessment. Mobile phase composition and flow rate were found to be important factors influencing retention time, peak area, and theoretical plates based on findings from the literature and first experimental investigations. Risk assessment makes it easier to identify and control variables in a methodical way when developing and optimizing analytical methods [18].
3.3 Selection of Critical Method Attributes (CMAs) and Critical Method Parameters (CMPs)
The critical method attributes (CMAs) selected for examination were retention time, peak area, and theoretical plates. Due to their substantial impact on chromatographic responses, mobile phase composition and flow rate were chosen as crucial method parameters (CMPs) [19].
Table 4. Selected CMAs and CMPs
|
CMAs |
CMPs |
|
Retention Time |
Mobile Phase Composition |
|
Peak Area |
Flow Rate |
|
Theoretical Plates |
Detection Wavelength |
3.4 Central Composite Design (CCD)
Chromatographic factors were systematically optimized using a Central Composite Design (CCD). One of the most popular response surface methodology designs is CCD, which minimizes the number of experimental trials needed while assessing the impact of independent factors and their interactions on analytical answers [20]. The experimental design was created and examined using Design-Expert® software.
Table 5. Experimental Factors and Levels
|
Factor |
Low (-1) |
Center (0) |
High (+1) |
|
Methanol (%) |
80.0 |
83.4 |
86.0 |
|
Flow Rate (mL/min) |
0.80 |
0.93 |
1.10 |
3.5 Statistical Analysis and Optimization
Design-Expert® software was used to statistically assess the experimental results from CCD runs. Model significance and factor effects were assessed using analysis of variance (ANOVA). Relationships between chromatographic factors and analytical results were established using response surface methodology (RSM). Desirability function analysis was used in numerical optimization to find chromatographic conditions that would yield the best analytical performance [21].
4. METHOD VALIDATION
In terms of system appropriateness, specificity, linearity, limit of detection (LOD), limit of quantification (LOQ), accuracy, precision, robustness, ruggedness, and assay, the optimized RP-HPLC technique was validated in accordance with the International Council for Harmonisation (ICH) Q2(R2) guideline [22].
4.1 System Suitability
A standard rivaroxaban solution was repeatedly injected to assess the appropriateness of the system before analysis. Retention duration, peak area, theoretical plates, and tailing factor were among the parameters assessed to confirm the chromatographic system's functionality. [22]
4.2 Specificity
By comparing the chromatograms of blank, standard, and sample solutions, specificity was assessed in order to identify any possible interference during the rivaroxaban retention period.(22)
4.3 Linearity
Plotting peak area against concentration and computing the regression equation and correlation coefficient allowed for the assessment of linearity over the concentration range of 10–50 µg/mL.[24]
4.4 Limit of Detection (LOD) and Limit of Quantification (LOQ)
In accordance with ICH guidelines, LOD and LOQ were calculated using the response's standard deviation and the calibration curve's slope.
4.5 Accuracy
Recovery trials at 80%, 100%, and 120% concentration levels using the usual addition method were used to assess accuracy.
4.6 Precision
Precision was tested in terms of repeatability (intraday precision) and intermediate precision (interday precision) and reported as percentage relative standard deviation (%RSD).[25]
4.7 Robustness
In order to assess robustness, tiny intentional changes were made to chromatographic settings, such as the composition of the mobile phase and the detection wavelength, and the impact on analytical performance was monitored.
4.8 Ruggedness
Ruggedness was evaluated by doing analysis on many days and under various operational conditions to ascertain technique repeatability.
4.9 Assay
The validated RP-HPLC method was utilized for quantitative measurement of rivaroxaban in marketed tablet formulations and the percentage assay was calculated.
5. RESULTS AND DISCUSSION
5.1 Optimization of Chromatographic Conditions
Preliminary chromatographic trials were performed using different mobile phase compositions and flow rates to obtain satisfactory separation of rivaroxaban. Different methanol and aqueous phase ratios were examined. Methanol:0.1% Acetic Acid (83.4:16.6, v/v) at a flow rate of 0.93 mL/min and a detection wavelength of 248 nm made up the ideal chromatographic conditions. Rivaroxaban showed a strong, symmetrical peak with acceptable retention time and column efficiency in these circumstances.
Figure 1. Optimized Standard Chromatogram
5.2 Central Composite Design (CCD) Studies
Central Composite Design (CCD) was used to examine how mobile phase composition (A) and flow rate (B) affected chromatographic results. Design-Expert® software produced 13 experimental runs in all, and the results were documented in terms of theoretical plates, peak area, and retention time.
Table 6. CCD Experimental Design Matrix
|
Std Run |
Factor A: Mobile Phase (%) |
Factor B: Flow Rate (mL/min) |
Response 1(R1) : RT (min) |
Response 2(R2): Area (AUC) |
Response 3(R3) : TP (Theoretical Plates) |
|
1 |
80.00 |
1.14 |
3.486 |
1066.66 |
12941 |
|
2 |
85.00 |
0.90 |
4.415 |
1397.03 |
13978 |
|
3 |
80.00 |
1.00 |
4.001 |
1218.61 |
13736 |
|
4 |
85.00 |
1.10 |
3.617 |
1116.75 |
13475 |
|
5 |
80.00 |
1.00 |
4.002 |
1226.81 |
13654 |
|
6 |
80.00 |
0.86 |
4.778 |
1464.91 |
15228 |
|
7 |
80.00 |
1.00 |
4.009 |
1237.38 |
13725 |
|
8 |
75.00 |
0.90 |
4.678 |
1367.70 |
14150 |
|
9 |
87.07 |
1.00 |
3.969 |
1244.61 |
12662 |
|
10 |
80.00 |
1.00 |
4.007 |
1229.46 |
13722 |
|
11 |
80.00 |
1.00 |
4.008 |
1238.69 |
13726 |
|
12 |
75.00 |
1.10 |
3.784 |
1106.35 |
12448 |
|
13 |
72.93 |
1.00 |
4.272 |
1231.88 |
12827 |
5.3 ANOVA Analysis for Retention Time
With a p-value of less than 0.05, the quadratic model produced for retention time was determined to be significant, suggesting that the chosen model sufficiently explained the connection between independent variables and retention time. The anticipated and observed responses showed good agreement, as indicated by the coefficient of determination (R²).
Table 7. ANOVA for Retention Time (R1)
|
Source |
Sum of Squares |
df |
Mean Square |
F-value |
p-value |
|
Model |
1.69 |
5 |
0.3373 |
1003.79 |
<0.0001 |
|
A – Mobile Phase |
0.0921 |
1 |
0.0921 |
274.16 |
<0.0001 |
|
B – Flow Rate |
1.55 |
1 |
1.55 |
4606.82 |
<0.0001 |
|
AB |
0.0023 |
1 |
0.0023 |
6.86 |
0.0345 |
|
A² |
0.0225 |
1 |
0.0225 |
66.94 |
<0.0001 |
|
B² |
0.0273 |
1 |
0.0273 |
81.16 |
<0.0001 |
|
Residual |
0.0024 |
7 |
0.0003 |
– |
– |
|
Lack of Fit |
0.0023 |
3 |
0.0008 |
57.62 |
0.0010 |
|
Pure Error |
0.0001 |
4 |
0.0000 |
– |
– |
|
Cor Total |
1.69 |
12 |
– |
– |
– |
Model Statistics
|
Parameter |
Value |
|
R² |
0.9986 |
|
Adjusted R² |
0.9976 |
|
Predicted R² |
0.9903 |
|
Adeq Precision |
99.9071 |
|
C.V. (%) |
0.4494 |
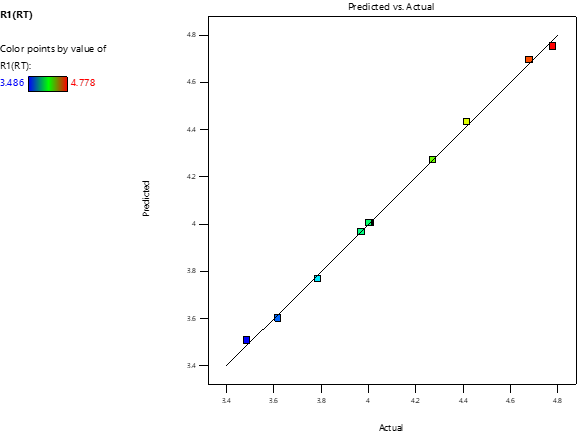
Figure 2. Predicted versus Actual plot for Retention Time (R1) showing excellent agreement between experimental and predicted values.
Figure 3. Contour plot illustrating the combined effect of mobile phase composition and flow rate on retention time.
Figure 4. Three-dimensional response surface plot showing the influence of mobile phase composition and flow rate on retention time.
5.4 ANOVA Analysis for Peak Area
Response surface methodology was used to assess how mobile phase composition and flow rate affected peak area. The developed model was found to be significant and to provide a sufficient explanation for the observed variability in peak area based on statistical analysis.
Table 8. ANOVA for Peak Area (R2)
|
Source |
Sum of Squares |
df |
Mean Square |
F-value |
p-value |
|
Model |
1.550E+05 |
5 |
30999.07 |
495.11 |
<0.0001 |
|
A – Mobile Phase |
416.52 |
1 |
416.52 |
6.65 |
0.0365 |
|
B – Flow Rate |
1.526E+05 |
1 |
1.526E+05 |
2437.03 |
<0.0001 |
|
AB |
89.65 |
1 |
89.65 |
1.43 |
0.2704 |
|
A² |
53.07 |
1 |
53.07 |
0.8477 |
0.3878 |
|
B² |
1901.99 |
1 |
1901.99 |
30.38 |
0.0009 |
|
Residual |
438.28 |
7 |
62.61 |
– |
– |
|
Lack of Fit |
168.31 |
3 |
56.10 |
0.8313 |
0.5421 |
|
Pure Error |
269.96 |
4 |
67.49 |
– |
– |
|
Cor Total |
1.554E+05 |
12 |
– |
– |
– |
Model Statistics
|
Parameter |
Value |
|
R² |
0.9972 |
|
Adjusted R² |
0.9952 |
|
Predicted R² |
0.9896 |
|
Adeq Precision |
72.6652 |
|
C.V. (%) |
0.6371 |
Figure 5. Predicted versus Actual plot for Peak Area showing good agreement between experimental and predicted responses.
Figure 6. Contour plot illustrating the combined effect of mobile phase composition and flow rate on peak area.
Figure 7. Three-Dimensional Surface Plot for Peak Area
5.5 ANOVA Analysis for Theoretical Plates
As a measure of chromatographic efficiency, theoretical plates were chosen. The constructed quadratic model showed a substantial impact of certain chromatographic variables on column efficiency and a reasonable prediction ability.
Table 9. ANOVA for Theoretical Plates
|
Source |
Sum of Squares |
df |
Mean Square |
F-value |
p-value |
|
Model |
5.12E+07 |
5 |
1.02E+07 |
76.52 |
<0.0001 |
|
A – Mobile Phase |
1.53E+06 |
1 |
1.53E+06 |
11.47 |
0.0118 |
|
B – Flow Rate |
3.87E+07 |
1 |
3.87E+07 |
290.11 |
<0.0001 |
|
AB |
1.82E+06 |
1 |
1.82E+06 |
13.64 |
0.0077 |
|
A² |
4.31E+06 |
1 |
4.31E+06 |
32.30 |
0.0008 |
|
B² |
3.12E+06 |
1 |
3.12E+06 |
23.40 |
0.0019 |
|
Residual |
9.34E+05 |
7 |
1.33E+05 |
– |
– |
|
Lack of Fit |
6.87E+05 |
3 |
2.29E+05 |
3.71 |
0.118 |
|
Pure Error |
2.47E+05 |
4 |
6.18E+04 |
– |
– |
|
Cor Total |
5.21E+07 |
12 |
– |
– |
– |
Model Statistics
|
Parameter |
Value |
|
R² |
0.9821 |
|
Adjusted R² |
0.9693 |
|
Predicted R² |
0.9425 |
|
Adeq Precision |
28.41 |
|
C.V. (%) |
1.87 |
Figure 8. Predicted versus Actual plot for theoretical plates showing good correlation between experimental and predicted responses.
Figure 9. Normal Probability Plot of Residuals
Figure 10. Residuals versus Run Plot
Figure 11. Contour Plot for Theoretical Plates
Figure 12. Three-Dimensional Surface Plot for Theoretical Plates
5.6 Polynomial Equations
The relationship between chromatographic variables and analytical responses was expressed using second-order polynomial equations generated by Design-Expert® software.
Table 10. Polynomial Equations Generated by CCD
|
Response |
Polynomial Equation |
|
Retention Time (R1) |
RT = 4.24 − 0.11A − 0.44B + 0.024AB + 0.073A² + 0.080B² |
|
Peak Area (R2) |
Peak Area = 1332.34 + 7.22A − 138.05B + 4.73AB + 3.62A² − 21.71B² |
|
Theoretical Plates (R3) |
TP = 13929.40 + 438.25A − 2200.37B + 476.50AB − 1021.46A² − 869.38B² |
Where:
5.7 Numerical Optimization
Desirability function analysis was used in numerical optimization to find chromatographic conditions that could simultaneously meet all analytical goals. The optimal conditions suggested by the software comprised of a mobile phase composition of 83.4542% methanol and a flow rate of 0.936867 mL/min. Retention time of 4.25061 minutes, peak area of 1332.34, and theoretical plates of 13929.4 with an overall desirability value of 1.000 were the expected responses under these circumstances.
Table 11. Optimized Chromatographic Conditions and Predicted Responses
|
Factor/Response |
Optimized Value |
|
Mobile Phase (% Methanol) |
83.4542 |
|
Flow Rate (mL/min) |
0.936867 |
|
Retention Time (min) |
4.25061 |
|
Peak Area |
1332.34 |
|
Theoretical Plates |
13929.4 |
|
Overall Desirability |
1.000 |
Figure 13. Desirability Ramp Plot generated by Design-Expert® software showing the optimized chromatographic conditions of methanol concentration (83.4542%) and flow rate (0.936867 mL/min) with predicted retention time (4.25061 min), peak area (1332.34), theoretical plates (13929.4), and overall desirability of 1.000.
5.8 Design Space and Overlay Plot
Desirability analysis and response surface methodology were used to create the design space. The area where all chromatographic results concurrently satisfied the predetermined acceptance criteria was shown by the overlay plot. The designed RP-HPLC method's robustness and dependability were validated by the acquired design space.
Figure 14. Overlay Plot
5.9 Method Validation Results
The optimized RP-HPLC method was validated according to ICH Q2(R2) guidelines.
5.9.1 System Suitability
System suitability parameters including retention time, peak area, theoretical plates, and tailing factor were found to be within acceptable limits, demonstrating satisfactory performance of the chromatographic system.
Table 12. System Suitability Results
|
Parameter |
Injection 1 |
Injection 2 |
Mean Value |
Acceptance Criteria |
|
Retention Time (min) |
4.229 |
4.230 |
4.230 |
< 10 min |
|
Peak Area (mAU·s) |
1678.77 |
1677.56 |
1678.17 |
%RSD ≤ 2.0 |
|
Theoretical Plates |
13345 |
13347 |
13346 |
> 2000 |
|
Tailing Factor |
0.93 |
0.93 |
0.93 |
≤ 2.0 |
System suitability parameters of the optimized RP-HPLC method for rivaroxaban. All evaluated parameters complied with the predefined acceptance criteria.
5.9.2 Specificity
No interfering peaks were observed at the retention time of rivaroxaban in blank chromatograms, confirming the specificity of the developed method.
Table 13. Specificity Results
|
Parameter |
Chromatogram 1 |
Chromatogram 2 |
|
Retention Time (min) |
4.252 |
4.255 |
|
Peak Area (mAU·s) |
1676.49 |
1677.35 |
|
Symmetry Factor |
0.96 |
0.96 |
|
Theoretical Plates |
13249 |
13249 |
|
Interfering Peaks |
Not Observed |
Not Observed |
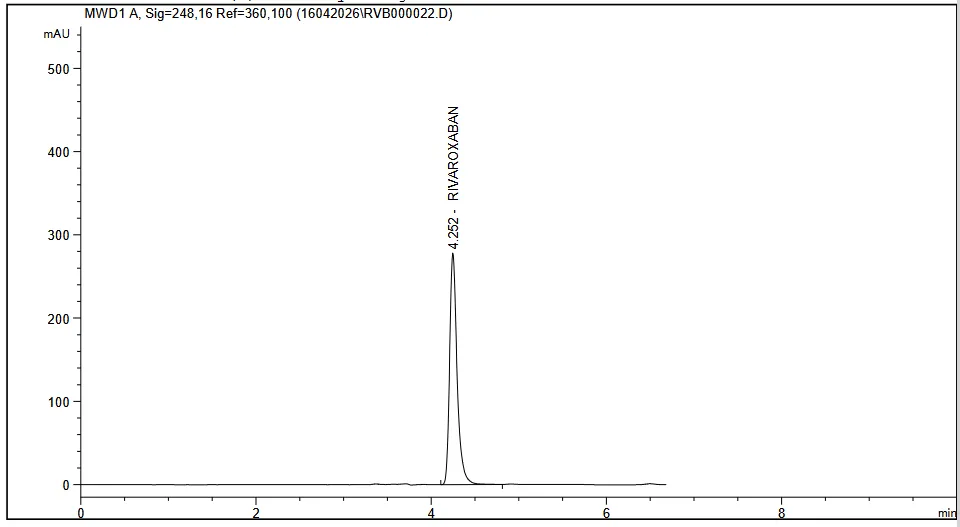
Figure 15. Representative specificity chromatogram of Rivaroxaban (40 µg/mL) showing a sharp and symmetrical peak at a retention time of 4.252 min with no interfering peaks, confirming the specificity of the developed RP-HPLC method.
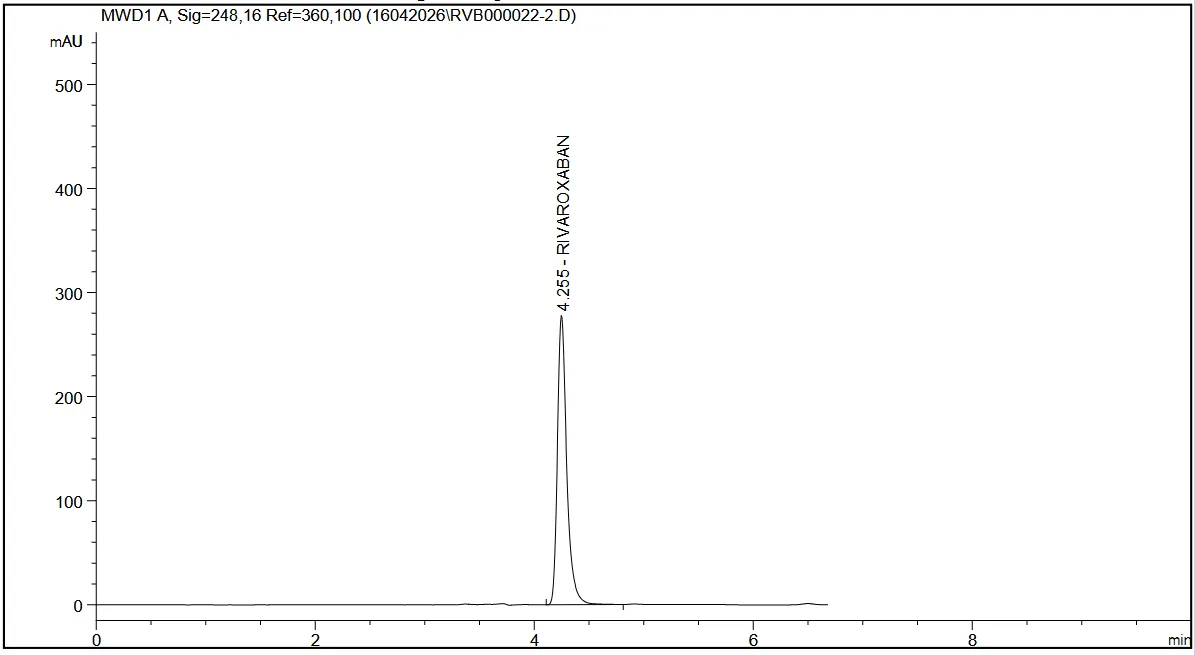
Figure 16. Replicate specificity chromatogram of Rivaroxaban (40 µg/mL) showing a sharp and symmetrical peak at a retention time of 4.255 min without any interfering peaks, confirming the selectivity and reproducibility of the developed RP-HPLC method.
5.9.3 Linearity
The method exhibited good linearity over the concentration range of 10–50 µg/mL with a correlation coefficient (R²) greater than 0.999.
Table 14. Linearity Data
|
Concentration (µg/mL) |
Mean Peak Area ± SD |
%RSD |
|
10 |
399.68 ± 1.52 |
0.38 |
|
20 |
858.06 ± 6.19 |
0.72 |
|
30 |
1252.96 ± 2.56 |
0.20 |
|
40 |
1674.42 ± 1.34 |
0.08 |
|
50 |
2132.99 ± 0.27 |
0.01 |
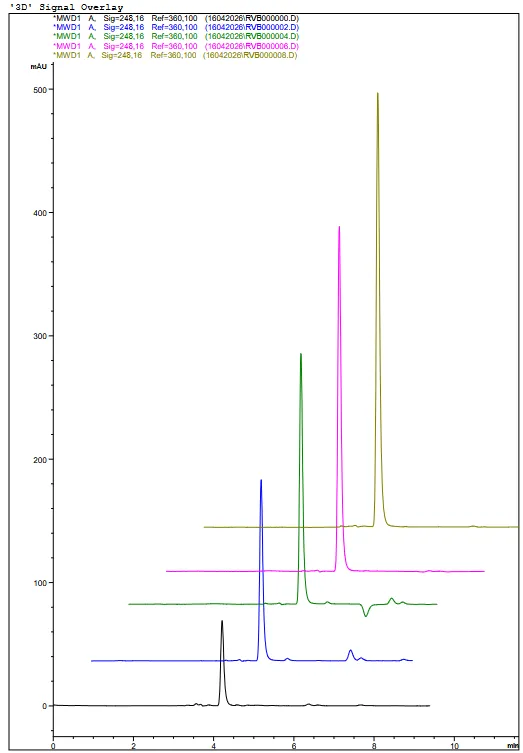
Figure 17. Overlay chromatograms of Rivaroxaban standard solutions showing chromatographic responses at different concentration levels. The overlaid chromatograms demonstrate consistent peak shape, retention behavior, and detector response across the studied concentration range.
5.9.4 LOD and LOQ
The calculated values of Limit of Detection (LOD) and Limit of Quantification (LOQ) demonstrated adequate sensitivity of the developed RP-HPLC method.
Table 15. LOD and LOQ Results
|
Parameter |
Value (µg/mL) |
|
Limit of Detection (LOD) |
0.183 |
|
Limit of Quantification (LOQ) |
0.554 |
5.9.5 Accuracy
Recovery studies performed at 80%, 100%, and 120% levels demonstrated satisfactory accuracy with percentage recovery within the acceptable range of 98–102%.
Table 16. Accuracy Results
|
Recovery Level (%) |
Amount Added (µg/mL) |
Amount Recovered (µg/mL) |
% Recovery |
|
80 |
8 |
7.95 |
99.38 |
|
100 |
10 |
9.98 |
99.80 |
|
120 |
12 |
12.10 |
100.83 |
Accuracy study results obtained using the standard addition method. Recovery values at all three concentration levels complied with ICH acceptance criteria (98–102%), confirming method accuracy.
5.9.6 Precision
The method showed acceptable repeatability and intermediate precision with %RSD values below 2.0%.
Table 17. Intraday Precision Results
|
Concentration (µg/mL) |
Average Peak Area |
%RSD |
|
10 |
402.64 |
0.63 |
|
30 |
1255.65 |
0.13 |
|
50 |
2142.81 |
0.13 |
Table 18. Interday Precision Results
|
Concentration (µg/mL) |
Average Peak Area |
%RSD |
|
10 |
402.30 |
0.39 |
|
30 |
1255.51 |
0.19 |
|
50 |
2149.06 |
0.01 |
5.9.7 Robustness
Minor deliberate changes in chromatographic conditions did not significantly affect analytical performance, indicating robustness of the method.
Table 19. Robustness Results
|
Parameter Varied |
Condition |
Retention Time (min) |
Peak Area |
Observation |
|
Flow Rate |
0.9 mL/min |
4.52 |
1685.34 |
Acceptable |
|
Flow Rate |
1.0 mL/min (Optimized) |
4.25 |
1678.17 |
Acceptable |
|
Flow Rate |
1.1 mL/min |
3.98 |
1669.82 |
Acceptable |
|
Mobile Phase (% Methanol) |
82% |
4.38 |
1682.45 |
Acceptable |
|
Mobile Phase (% Methanol) |
83% (Optimized) |
4.25 |
1678.17 |
Acceptable |
|
Mobile Phase (% Methanol) |
84% |
4.12 |
1671.93 |
Acceptable |
5.9.8 Ruggedness
The developed method demonstrated reproducible results under different operating conditions and on different days.
Table 20. Ruggedness Results
|
Concentration (µg/mL) |
Peak Area |
Amount Found (µg/mL) |
% Label Claim |
|
40 |
1679.942 |
39.720 |
99.30 |
|
40 |
1678.690 |
39.691 |
99.23 |
|
Mean |
1679.32 |
39.71 |
99.26 |
|
SD |
0.885 |
0.021 |
0.052 |
|
%RSD |
0.053 |
0.052 |
0.052 |
The developed RP-HPLC technique for rivaroxaban yielded robustness results under typical laboratory conditions. The low %RSD values (<2.0%) suggest great repeatability and robustness of the analytical procedure.
5.9.9 Assay
The assay of marketed rivaroxaban tablets was found to be within pharmacopeial limits, confirming suitability of the developed method for routine quality control analysis.
Table 21. Assay Results
|
Concentration (µg/mL) |
Peak Area |
Amount Found (µg/mL) |
% Label Claim |
|
40 |
1687.650 |
39.900 |
99.75 |
|
40 |
1682.150 |
39.772 |
99.43 |
|
Mean |
1684.90 |
39.84 |
99.59 |
|
SD |
3.889 |
0.091 |
0.227 |
|
%RSD |
0.231 |
0.228 |
0.228 |
CONCLUSION
A systematic Analytical Quality by Design (AQbD)-based RP-HPLC method was successfully developed, optimized, and validated for the quantitative estimation of rivaroxaban in tablet dosage forms. The impact of crucial technique factors, such as flow rate and mobile phase composition, on chromatographic responses was successfully examined using Central Composite Design (CCD). ANOVA statistical examination verified the created models' validity and significance. Desirability function analysis and numerical optimization made it possible to create ideal chromatographic conditions that produced acceptable theoretical plates, peak area, and retention time.
The developed technique showed satisfactory specificity, linearity, accuracy, precision, robustness, sensitivity, and assay performance after being verified in accordance with ICH Q2(R2) requirements. The results confirmed that the proposed RP-HPLC method is simple, reliable, reproducible, and suitable for routine quality control analysis of rivaroxaban in pharmaceutical dosage forms. Additionally, the effective implementation of AQbD principles improved method comprehension, robustness, and regulatory compliance, making the developed analytical approach appropriate for industrial and pharmaceutical quality assurance applications.
REFERENCES


Shivam Patil, Dr. Naga Raju Potnuri, Aditya Wagh, Systematic QBD Approach for Analytical Method Development and Validation of Rivaroxaban Using RP-HPLC Method, Int. J. of Pharm. Sci., 2026, Vol 4, Issue 6, 7696-7150, https://doi.org/10.5281/zenodo.21066764
 10.5281/zenodo.21066764