
We use cookies to ensure our website works properly and to personalise your experience. Cookies policy
P. R. Patil Institute of Pharmacy, Talegaon, Ashti, Wardha, 442202, Maharashtra, India.
Ibuprofen is non-steroidal anti-inflammatory drug (NSAID) drug which used for relief of symptoms of arthritis, primary dysmenorrhea, and fever and as an analgesic. The aim of this study was to develop highly sensitive, selective and rapid quantitative analytical method for estimation of ibuprofen as well as evaluation of marketed tablet of ibuprofen (Brufen400). The drug shows absorption maxima at 226nm. The liner dynamic response was found to be in the concentration of 2-10µg/ml. The slop, intercept and correlation coefficient were found to be 0.0389, -0.0454 and 0.977091 respectively. The estimated amount of ibuprofen in marketed tablets was found to be 99.80±0.12%. The marketed tablets evaluated for weight variation, hardness, friability, and disintegration time and dissolution study. The tablets show acceptable weight variation as per pharmacopeial specification. Friability shows below 1% indicating good mechanical resistance of tablets. The marketed tablet shows average 5.4 kg/cm² hardness which indicate good strength of tablets. The disintegration time varies from 5.53 min. to 7.34 min. and 97.16% drug release in 50 minutes. The newly developed method and the evaluation of marketed tablets can be used for analysis of ibuprofen of equal significant drug as well as evaluation parameters can be help for quality control and quality assurance of the drug.
Ibuprofen was discovered by Dr. Stewart Adams, a pharmacologist in the Research Department of The Boots Pure Drug company Ltd at Nottingham, UK. Dr. Stewart Adams' aim was to find an analgesic drug which has improved efficacy over aspirin. Dr John Nicholson was the first person to synthesize ibuprofen. When Stewart Adams started his research, at that time aspirin & Cortisone were the standard drugs for treating painful arthritic disease. On the basis of Ibuprofen safety record, The Boots company applied to the UK Department of Health & Social Security in August 1978 to allow Ibuprofen for nonprescription sale for the treatment of muscular and rheumatic pain, fever with Unit dose of 200mg and a maximum adult dose of 1200mg.
In 1974. Ibuprofen got FDA approval. Brufen ™ Motrin ™ were used as first line treatment of pain and inflammation. Clearance of both enantiomers of ibuprofen possess a relatively short, approximately 2hours.[2] Ibuprofen is R, S-2-(p-isobutylphenyl) propionic acid, its chemical formula is C13H18O2 and its molecular weight is 206.28. Ibuprofen contains carboxylic group and aromatic ring as shown in Fig No. 1. Its appearance is a white crystalline powder, which is freely soluble in organic solvents like ethanol and acetone.[1] For the administrating of ibuprofen, commonly the oral route is used.[2] Cyclooxygenase is required for the synthesis of prostaglandins through the arachidonic acid pathway. COX converts the arachidonic acid to prostaglandin H2 (PGH2) in the body. Ibuprofen is a nonselective inhibitor of COX, which results in a lower level of prostaglandins in the body. Prostaglandins are important mediators of sensations, such as fever, pain, and inflammation [2], Ibuprofen is used to treat pain and Inflammation which was first NSAID’S.[3]Method including titration[4], HPLC with combined drug studies[5,6,7], HPLC[8], UPLC[9,10], UV spectrophotometric[11,12], First- order Derivative and UV-spectrophotometric Methods[13], GC-MS[14,15] are widely used to determine ibuprofen in single and pharmaceutical dosage form. Bradycardia, hypotension and metabolic acidosis are the side effect of ibuprofen when dose is exceeding 300mg/Kg concentration. [17,18] In rheumatoid patient’s liver dysfunction is observed when treated with the lower homolog of ibuprofen; Ibufenac.[19] The objective of the present research work deals with simple, accurate, precise UV spectroscopic method using Absorption Maxima Spectroscopy method for estimation of Ibuprofen in bulk and validated as per ICH guideline.
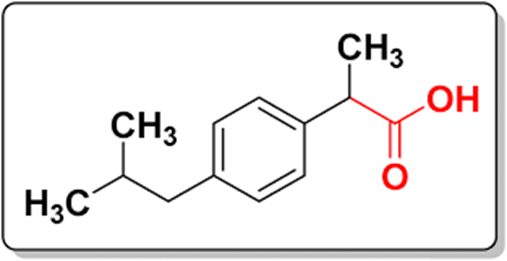
Figure no. 1 Chemical Structure of Ibuprofen
IUPAC Name: (RS)-2-(4-(2-Methylpropyl) phenyl) propanoic acid
Molecular Formula: C??H??O?.
Molecular Weight: 206.28 g/mol
Melting Point: 75-78 °C
Solubility: Practically insoluble in water, highly soluble in organic solvents (e.g., methanol, acetone, NaOH)
Category: Non-Steroidal Anti-Inflammatory Drug (NSAID)
Pharmacokinetics and Pharmacodynamics: Ibuprofen is given as a racemic combination of the R and S enantiomers; the majority of its pharmacologic action is attributed to S-ibuprofen. Alpha-methyl acyl-CoA-racemase, encoded by the gene AMACR, converts about 50–65% of R-ibuprofen to S-ibuprofen via an acyl-CoA thioester in the liver; however, it may also happen in the gut. Oral administration, Ibuprofen is quickly absorbed, reaching peak plasma levels within 1–2 h.. About 90–98% of ibuprofen binds to plasma.
UV – Spectrophotometry
Ultraviolet (UV) spectroscopy is one of the most widely employed analytical techniques in pharmaceutical sciences due to its simplicity, sensitivity, cost-effectiveness, and rapid applicability. The principle of UV spectroscopy is based on the absorption of ultraviolet radiation (200–400 nm) by molecules containing chromophores, leading to electronic transitions. The extent of absorption is directly proportional to the concentration of the absorbing species, as described by Beer–Lambert’s law, which forms the theoretical basis for quantitative analysis.
In pharmaceutical analysis, UV spectroscopy plays a crucial role in drug estimation, quality control, dissolution testing, and stability studies. It is particularly useful for the routine determination of active pharmaceutical ingredients (APIs) in bulk drug substances and finished formulations. Compared to other sophisticated techniques such as HPLC or LC-MS, UV spectroscopy offers the advantages of low operational cost, minimal sample preparation, shorter analysis time, and reproducibility, making it suitable for laboratories with limited resources.
Role of UV Spectrophotometry in Routine Quality Control
Analytical Method Validation
Analytical method validation is a documented process ensuring that an analytical procedure is suitable for its intended purpose, delivering reliable, accurate, and consistent results in pharmaceutical, chemical, or clinical laboratories.
Method validation confirms that the chosen analytical procedure can accurately and precisely measure the analyte in a sample without interference or error under actual conditions of use. It is fundamental for regulatory compliance, product safety, and quality assurance in pharmaceuticals and other fields.
Importance of Analytical Method Validation
AIM AND OBJECTIVE
AIM: To Validate on reported UV method used for estimation of ibuprofen from marketed tablet preparation.
OBJECTIVE:
MATERIALS AND METHODS
Drug Sample: Ibuprofen standard was obtained from a certified pharmaceutical supplier with a declared purity of ≥99%. The sample was stored in airtight containers at room temperature to prevent moisture absorption.
Chemicals and Reagents: All chemicals used were of analytical reagent (AR) grade. 0.1N NaOH, distilled water were used for preparation of solutions. All glassware was thoroughly cleaned, dried, and calibrated before use
Instrumentation
UV-Visible double beam Spectrophotometer (Shimadzu UV-1800), with matching pair of 1 cm quartz cuvettes. All weighing was done on Electronic Analytical Balance (Shimadzu AY-220). To degas the solution Ultrasonicator (Bio-Technics India) was used.
Selection of Solvent
Based on drug profile, the solubility of Ibuprofen was freely soluble in NaOH. So, 1 NaOH was selected as a solvent.
Preparation of Stock solution of Ibuprofen
Standard stock solution of Ibuprofen was prepared by accurately weighing 12mg of Ibuprofen and transferred to 100 ml volumetric flask and volume make up with methanol.
Preparation of sample solution
The equivalent weight of powdered tablets was found to be 12 mg, which was calculated by average weight of 20 tablet, cross multiplication of average weight and label Content of drug, equivalent weight was obtained. Now this 12 mg of powered tablet weighed and transferred to a 100 ml volumetric flask and NaOH was added and filtered with Whatman filter paper. After that volume was made up to mark to get concentration 100ug/ml.
Selection of analytical wavelength
The standard stock solution was taken and spectra was observed from 200 to 400nm in aUV-spectrophotometer.
Method Validation
The method was validated according to ICH Q2 (R1) guidelines for validation of analytical procedures for parameters like linearity, accuracy, precision, LOD, LOQ for the analyte.
Linearity
The Linearity of an analytical procedure is its ability (within a given range) to get test result which are directly proportional to the concentration of analyte within the sample. five different concentrations of ibuprofen covering from 2-10 ug/ml were prepared and analyzed. The linearity was accessed by plotting calibration curve of Ibuprofen.
Precision
The degree of agreement among individual test results when the method is applied repeatedly to multiple sampling of homogenous sample.
LOD and LOQ
The Limit of Detection (LOD) is the smallest concentration of the analyte that gives the measurable response. LOD was calculated using the following formula:
LOD = 3.3 σ /S
The limit of quantification (LOQ) is the smallest concentration of the analyte, which gives response that can be accurately quantified. LOQ was calculated using the following formula:
LOQ = 10 σ/S
Where, σ is standard deviation of the response and S is the slope of the calibration curve.
RESULT AND DISCUSSION
Selection of Analytical wavelength
he Spectra of Ibuprofen was observed and highest absorbance was seen at 226 nm.
Linearity
For preparation of dilution 0.2, 0.4, 0.6, 0.8, 1 ml stock solution was pipette out and was transferred to 10 ml Volumetric flask and volume make up with NaOH which results in 2, 4, 6, 8, 10 μg /ml concentration solution, absorbance was observed (Table No. 1) and the method was found linear with correlation coefficient r2 =0.9989. The calibration curve of Ibuprofen is shown in Fig. No. 3. The slope and intercept are 0.028314 and 0.009733 respectively as shown in Table No. 2.
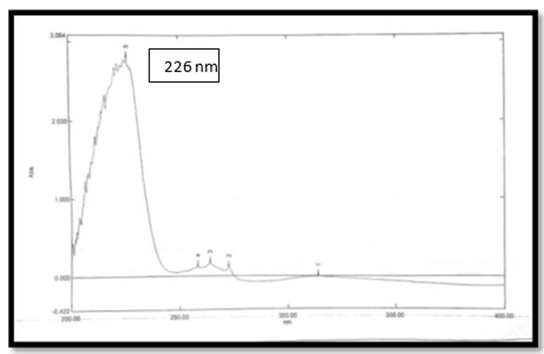
Figure 2 UV absorption spectra 0f IBU at λ-max=226nm
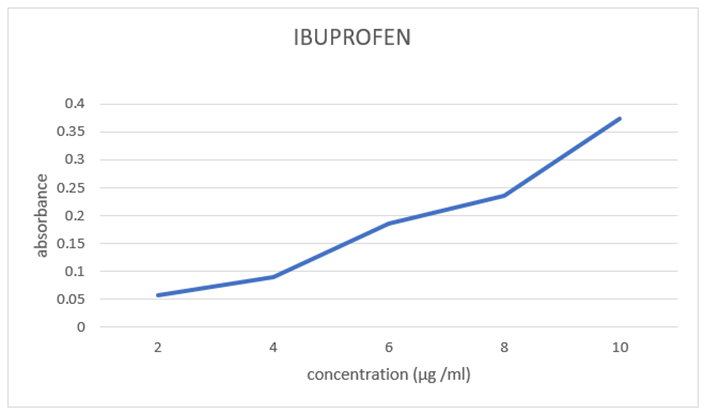
Figure 3 Calibration curve for Ibuprofen
Table no.1: Linearity
|
Sr. No. |
Conc. |
Absorbance |
|
1 |
2 |
0.057 |
|
2 |
4 |
0.089 |
|
3 |
6 |
0.186 |
|
4 |
8 |
0.235 |
|
5 |
10 |
0.373 |
Table No.2: Linear regression analysis by UV.
|
Sr. No. |
Parameters |
Absorption Maxima Spectroscopy Method |
|
1 |
λmax (nm) |
226nm |
|
2 |
Regression equation |
0.0389x-0.0454 |
|
3 |
Slope (m) |
0.0389 |
|
4 |
Intercept (c) |
-0.0454 |
|
5 |
Correlation Coefficient (r2) |
0.977091 |
|
6 |
Limit of detection (LOD) |
268.2652 |
Analysis of Tablet (marketed) Formulation
For analysis of tablet formulation BRUFEN® tablet was taken. The 36ug/ml dilution was prepared and amount of drug present in tablet and %RSD was calculated which is shown in Table No. 3.
Table No. 3: Result of Tablet analysis.
|
Drug Name |
Mean |
SD |
%RSD |
|
Brufen |
0.188 |
0.126 |
67.02% |
Accuracy
Accuracy was determined at 80%, 100% and 120% level by standard addition method and % recovery was evaluated which is shown in Table No. 4.
Table No.4: Result of Accuracy study.
|
Level addition |
Mean |
SD |
%RSD |
|
80 |
100.17 |
0.2322 |
0.2318 |
|
100 |
99.93 |
0.1394 |
0.1395 |
|
120 |
100.42 |
0.1743 |
0.1734 |
Precision
The results of intra-day precision were expressed as % RSD and it was found to be 1.72 and 0.27 for IBU. The % RSD value indicates the good precision of the method which is shown in Table no.5. The results of inter-day precision were expressed as % RSD. It was found to be 1.72 and 0.27 for IBU respectively. The % RSD value indicates the good precision of the method which is shown in Table No. 5.
Table No.5: Result of Intraday precision.
|
Sr. No. |
Conc. (ug/ml) |
Absorbance |
Mean |
SD |
%RSD |
|
1 |
2 |
0.057 |
|
|
|
|
2 |
2 |
0.059 |
0.058 |
0.0010 |
1.72% |
|
3 |
2 |
0.058 |
|
|
|
|
4 |
6 |
0.089 |
|
|
|
|
5 |
6 |
0.090 |
0.088 |
0.0017 |
1.96% |
|
6 |
6 |
0.087 |
|
|
|
|
7 |
10 |
0.0373 |
|
|
|
|
8 |
10 |
0.0374 |
0.0374 |
0.0001 |
0.27% |
|
9 |
10 |
0.0375 |
|
|
|
Inter-day precision were evaluated for 2 ,6 ,10 ug/ml for three consecutive days within same environment which is shown in Table No. 6.
Table no.6: Result of Inter-day precision.
|
Sr. No. |
Conc. (ug/ml) |
Absorbance |
Mean |
SD |
%RSD |
|
1 |
2 |
0.058 |
|
|
|
|
2 |
2 |
0.059 |
0.058 |
0.0010 |
1.72% |
|
3 |
2 |
0.057 |
|
|
|
|
4 |
6 |
0.090 |
|
|
|
|
5 |
6 |
0.091 |
0.089 |
0.0017 |
1.96% |
|
6 |
6 |
0.088 |
|
|
|
|
7 |
10 |
0.0375 |
|
|
|
|
8 |
10 |
0.0374 |
0.0375 |
0.0001 |
0.27% |
|
9 |
10 |
0.0376 |
|
|
|
LOD AND LOQ
Five sets of known concentrations (02-10 μg/ml) were prepared and scanned. By using these spectra, regression equations were obtained. By taking average of slopes and standard deviation of y-intercept, LOD and LOQ were calculated. The values of LOD and LOQ are given in Table 2.
LOD = 3.3 σ /S
LOD = 268.2652
LOD of Ibuprofen was found to be 268.2652 μg/ml.
LOQ = 10 σ/S
LOQ = 812.9248
LOQ of Ibuprofen was found to be 812.9248 μg/ml.
CONCLUSION
In Absorption maxima method methanol was used as solvent and detection was done at 226 nm. The % RSD for all parameters were found within 2%. The result showed that the proposed method was suitable for the accurate, precise and rapid determination of Ibuprofen in its bulk and tablet dosage form. The method was validated as per ICH guidelines.
Conflict Of Interest
There is no conflict of interest from all the authors.
AKNOWLEDGEMENT
We are thankful to the management of P. R. Patil Institute of Pharmacy, Talegaon (S.P.), Wardha for providing all the facilities for carrying out this review work.
REFERENCES


Pragati Ingale, Pratik Bargat*, Pratik Bhonde, Pratik Jadhav, Pratiksha Mahajan, Farah Khan, Validation Study on Reported UV Method Used for Estimation of Ibuprofen from Marketed Tablet Preparation, Int. J. of Pharm. Sci., 2025, Vol 3, Issue 11, 3302-3310 https://doi.org/10.5281/zenodo.17671895
 10.5281/zenodo.17671895