

We use cookies to ensure our website works properly and to personalise your experience. Cookies policy
Department of Pharmaceuical Chemistry, Amar Shaheed, Baba Ajit Singh Jujhar Singh Memorial Collage of Pharmacy (An Autonoumus College) BELA, Rupnagar, Punjab, India 140111.
Background: A straightforward, reliable, repeatable, and exact reverse phase high performance liquid chromatography technique was optimized and validated for simultaneous estimation of EGCG (epigallocatechin gallate) [(2R,3R)-5,7-dihydroxy-2-(3,4,5-trihydroxyphenyl)-3,4-dihydro-2H-chromen-3-yl] 3,4,5-trihydroxybenzoate and luteolin 2-(3,4-dihydroxyphenyl)-5,7-dihydroxy-4H-chromen-4-one. Methodology: A C18 (250 × 4.6) mm, 5 µm column with a mobile phase of 1% acetic acid: methanol was used for separation. Results and Discussion: The volume flow rate remained 1milliliter per minute, and the selected wavelength for the identification of compounds was 280 nm. The elution times for epigallocatechin gallate and luteolin were observed to be 2.587 and 3.148 min, respectively. The calibration curve was linear over 10-60 µg/ml for EGCG and 5-30 µg/ml for luteolin. Conclusion: The developed method was validated in accordance with ICH guidelines for various validation parameters fit well within their acceptable ranges. The suggested approach is suitable for routine quality control analysis.
EGCG (Epigallocatechin gallate) having chemical name [(2R,3R)-5,7-dihydroxy-2-(3,4,5-trihydroxyphenyl)-3,4-dihydro-2H-chromen-3-yl] 3,4,5-trihydroxybenzoate [Figure 1] belongs to the flavone, a polyphenol, and an ester of gallate.(1) It has antioxidant, HSP90 inhibitory, apoptosis-inducing, neuroprotective, geroprotective, and antineoplastic properties.(2)
Luteolin is chemically named as 2-(3,4-dihydroxyphenyl)-5,7-dihydroxy-4H-chromen-4-one [Figure 2] and a 3'-hydroxyflavonoid and a tetrahydroxyflavone.(3) As an antioxidant, free radical scavenger, anti-inflammatory agent, immune system modulator, and active against certain malignancies, it plays a significant function in the human body.(4)
The literature review revealed various techniques for estimation of epigallocatechin gallate enumerating spectrophotometric techniques,(5) reversed phase high performance liquid chromatography (RP-HPLC),(6) high performance thin-layer chromatography (HPTLC),(7) liquid chromatography-mass spectrometry (LC-MS/MS),(8) and capillary electrophoresis. Similarly, techniques for estimating luteolin reported in the literature include spectrophotometry,(9) reversed phase high performance liquid chromatography (RP-HPLC),(10) electrochemical analysis,(11) liquid chromatography-mass spectrometry LC-MS/MS.(12)RP-HPLC was chosen as an appropriate method of analysis for the estimation of EGCG and luteolin based on literature review. Following development, the approach was validated in compliance with ICH requirements.
Figure 1: Epigallocatechin gallate’s chemical structure
Figure 2: Luteolin’s chemical structure
RESULTS AND DISCUSSION
For the simultaneous measurement of epigallocatechin gallate and luteolin, a new RP-HPLC technique was developed and validated. For this calibration curves were generated, each for blank and standard EGCG and luteolin. The mobile phase used was 1% acetic acid: methanol. Determination of blank [Figure 3] and standard chromatogram [Figure 4] for EGCG and luteolin by HPLC and generation of calibration curve.
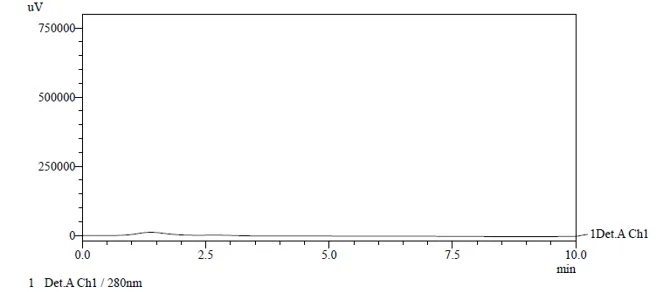
Figure 3: Blank chromatogram (control) for the determination of EGCG and luteolin
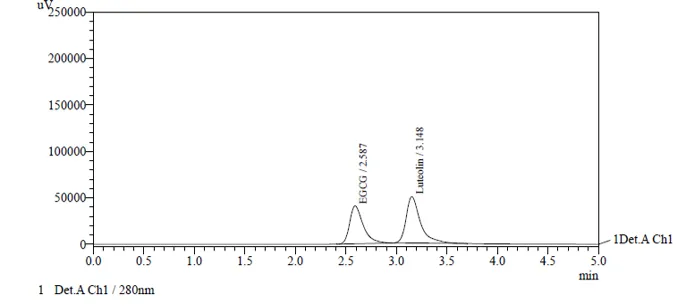
Figure 4: Standard chromatogram for the simultaneous determination of EGCG and luteolin
Calibration curve for EGCG and luteolin
The calibration curve for EGCG and luteolin was prepared ranging 10 to 60 µg/ml solution. The calibration curve indicated the regression equation Y=9784.8x-807.73 and Y=12455x-1002.21 for EGCG and luteolin, respectively and the R2 value was 0.999 for both drugs showed good linearity as shown in [Figure 5 and 6] and Tables 1-4.
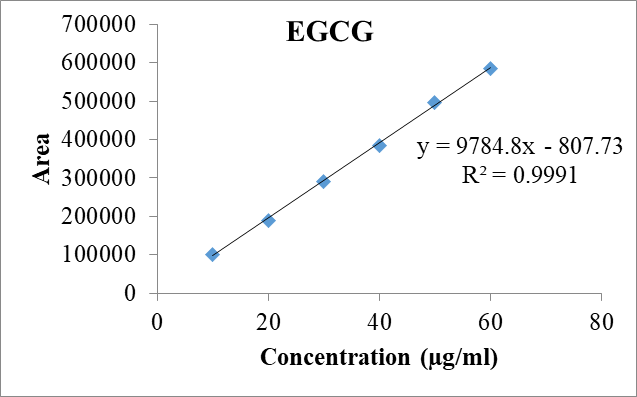
Figure 5: RP-HPLC standard calibration curve graph for EGCG
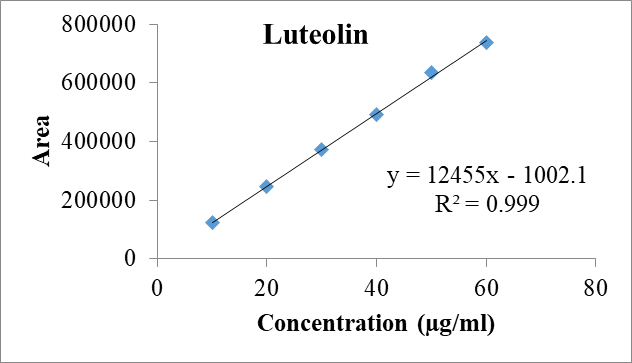
Figure 6: RP-HPLC standard calibration curve graph for luteolin
Table 1: RP-HPLC calibration curve for EGCG
|
Sr. No. |
Concentration (µg/ml) |
Area ± SD |
|
1 |
10 |
101984±3357.19 |
|
2 |
20 |
190687±1551.30 |
|
3 |
30 |
291252±2147.52 |
|
4 |
40 |
384765±2845.58 |
|
5 |
50 |
496602±8184.42 |
|
6 |
60 |
584667±1929.04 |
SD-Standard deviation
Table 2: Statistical parameters result for EGCG estimation
|
Statistical parameters |
Results |
|
Regression equation: y=mx+C |
Y=9784.8x-807.73 |
|
Slope (m) |
9784.8 |
|
Intercept (C) |
807.73 |
|
Correlation coefficient (R2) |
0.9991 |
Table 3: RP-HPLC calibration curve for luteolin
|
Sr. No. |
Concentration (µg/ml) |
Area ± SD |
|
1 |
10 |
124132±2460.82 |
|
2 |
20 |
245743±272.78 |
|
3 |
30 |
374123±1846.73 |
|
4 |
40 |
491624±4819.30 |
|
5 |
50 |
635092±3709.12 |
|
6 |
60 |
738897±2883.28 |
SD-Standard deviation
Table 4: Statistical parameters result for luteolin estimation
|
Statistical parameters |
Results |
|
Regression equation: y=mx+C |
Y=12455x-1002.21 |
|
Slope (m) |
12455 |
|
Intercept (C) |
1002.21 |
|
Correlation coefficient (R2) |
0.999 |
Linearity
A calibration graph was constructed for EGCG and luteolin at 280 nm at concentration ranges of 10 – 60 µg/ml. The working stock solution of EGCG and luteolin measured precisely at 280 nm. At the proper wavelength, the area under the curve (AUC) for every solution was measured. The linearity was recognized by graphing concentration versus AUC.
Accuracy
A percentage of standard recovery was used to evaluate the method’s accuracy. The table shows that the accuracy of the re-analysed radiographic test solutions was 98.93 – 101.68 % for EGCG and 98.92 – 100.06 % for luteolin. The recovery study findings indicate that the procedure is accurate, as shown in Tables 5 and 6.
Table 5: Accuracy for EGCG
|
S. No. |
Accuracy (%) |
Conc. (µg/ml) |
Amount recovered (µg/ml) |
% recovery |
Mean |
|
1 |
50 T1 T2 T3 |
20 |
20.05 |
100.25 |
100.90 |
|
2 |
20.34 |
101.68 |
|||
|
3 |
20.15 |
100.77 |
|||
|
4 |
100 T1 T2 T3 |
40 |
39.68 |
99.20 |
99.13 |
|
5 |
39.70 |
99.26 |
|||
|
6 |
39.57 |
98.93 |
|||
|
7 |
150 T1 T2 T3 |
60 |
59.65 |
99.42 |
99.58 |
|
8 |
59.60 |
99.33 |
|||
|
9 |
60.00 |
100.00 |
Table 6: Accuracy for luteolin
|
S. No. |
Accuracy (%) |
Conc. (µg/ml) |
Amount recovered (µg/ml) |
% recovery |
Mean |
|
1 |
50 T1 T2 T3 |
20 |
19.92 |
99.59 |
99.69 |
|
2 |
19.98 |
99.91 |
|||
|
3 |
19.91 |
99.57 |
|||
|
4 |
100 T1 T2 T3 |
40 |
39.59 |
98.98 |
99.42 |
|
5 |
39.82 |
99.55 |
|||
|
6 |
39.89 |
99.73 |
|||
|
7 |
150 T1 T2 T3 |
60 |
59.35 |
98.92 |
99.65 |
|
8 |
60.03 |
100.06 |
|||
|
9 |
59.98 |
99.97 |
Precision
Values of the relative standard deviation (RSD) for variability intraday and interday are frequently low, i.e., <1% in both situations, indicating that the suggested method for evaluating at all concentration points is the most accurate. The observations for both intra- and inter-day periods are shown in Tables 7 and 8.
Table 7: Repeatability and intra - interday precision for EGCG
|
S. No. |
Concentration |
Amount recovered (µg/ml) |
% recovery |
Mean |
% RSD |
|
1 |
Intraday ( 40 µg/ml) |
39.27 |
98.19 |
98.93 |
0.40 |
|
39.60 |
98.99 |
||||
|
39.71 |
99.27 |
||||
|
39.65 |
99.12 |
||||
|
39.53 |
98.82 |
||||
|
39.68 |
99.21 |
||||
|
2 |
Interday ( 40 µg/ml) |
40.21 |
100.52 |
101.00 |
0.68 |
|
39.93 |
99.83 |
||||
|
40.63 |
101.57 |
||||
|
40.49 |
101.23 |
||||
|
40.49 |
101.23 |
||||
|
40.63 |
101.59 |
||||
|
3 |
Repeatability ( 40 µg/ml) |
40.00 |
100.00 |
99.99 |
0.31 |
|
40.16 |
100.41 |
||||
|
40.12 |
100.30 |
||||
|
39.93 |
99.82 |
||||
|
39.92 |
99.80 |
||||
|
39.85 |
99.62 |
RSD: Relative standard deviation
Table 8: Repeatability and intra - interday precision for luteolin
|
S. No. |
Concentration |
Amount recovered (µg/ml) |
% recovery |
Mean |
% RSD |
|
1 |
Intraday ( 40 µg/ml) |
39.44 |
98.60 |
99.37 |
0.72 |
|
39.43 |
98.58 |
||||
|
39.77 |
99.43 |
||||
|
40.01 |
100.02 |
||||
|
39.70 |
99.25 |
||||
|
40.13 |
100.33 |
||||
|
2 |
Interday ( 40 µg/ml) |
39.65 |
99.14 |
99.21 |
0.35 |
|
39.67 |
99.18 |
||||
|
39.85 |
99.63 |
||||
|
39.45 |
98.63 |
||||
|
39.80 |
99.49 |
||||
|
39.67 |
99.17 |
||||
|
3 |
Repeatability ( 40 µg/ml) |
39.69 |
99.23 |
99.03 |
0.83 |
|
39.32 |
98.29 |
||||
|
40.06 |
100.15 |
||||
|
39.32 |
98.31 |
||||
|
39.92 |
99.81 |
||||
|
39.36 |
98.40 |
RSD: Relative standard deviation
LOD and LOQ
The LOD and LOQ standards utilized to control the recommended technique sensitivity were 0.14 and 0.42 for EGCG and 0.16 and 0.49 for luteolin, respectively, as shown in Table 9.
Table 9: EGCG and luteolin LOD and LOQ data
|
Sr. no. |
Name |
LOD (µg/ml) |
LOQ (µg/ml) |
|
1 |
EGCG |
0.14 |
0.42 |
|
2 |
Luteolin |
0.16 |
0.49 |
LOD: Limit of detection, LOQ: Limit of quantitation
Robustness
When the flow rate was changed within a range of ± 0.1ml/min, the results on the percentage of yield recovered had an acceptance interval of ±2%. The robustness data results are shown in Table 10.
A wavelength change limit of ± 2nm and an acceptability interval of ± 2% were used to calculate the recovery percentage. The robustness data results are shown in Table 11.
Table 10: EGCG and luteolin robustness data with slight variation in flow rate
|
S. No. |
Parameter |
EGCG |
Luteolin |
||
|
Robustness_ 0.9ml/min |
Robustness_ 1.1ml/min |
Robustness_ 0.9ml/min |
Robustness_ 1.1ml/min |
||
|
1 |
Mean recovery (%) |
100.86 |
100.48 |
100.32 |
99.43 |
|
2 |
% RSD |
0.04 |
0.36 |
0.27 |
0.44 |
RSD: Relative standard deviation
Table 11: EGCG and luteolin robustness data with slight variation in wavelength
|
S. No. |
Parameter |
EGCG |
Luteolin |
||
|
Robustness_ 278nm |
Robustness_ 282nm |
Robustness_ 278nm |
Robustness_ 282nm |
||
|
1 |
Mean recovery (%) |
100.45 |
99.78 |
100.59 |
99.47 |
|
2 |
% RSD |
0.93 |
0.08 |
0.21 |
0.13 |
RSD: Relative standard deviation
Ruggedness
The ruggedness was examined by using different analysts to look at the identical drug samples showed low %RSD values (<1%). Table 12 displayed drug reactions in terms of %RSD.
Table 12: Ruggedness data of EGCG and luteolin
|
S. No. |
Drug |
Analyst |
Sample 1 Recovery (%) |
Sample 2 Recovery (%) |
Mean Recovery (%) |
SD |
% RSD |
|
1 |
EGCG |
Analyst 1 |
100.27 |
99.86 |
100.07 |
0.29 |
0.29 |
|
2 |
Analyst 2 |
99.78 |
100.04 |
99.91 |
0.19 |
0.19 |
|
|
3 |
Luteolin |
Analyst 1 |
100.43 |
99.87 |
100.15 |
0.39 |
0.39 |
|
4 |
Analyst 2 |
100.43 |
101.67 |
101.05 |
0.88 |
0.87 |
SD: Standard deviation, RSD: Relative standard deviation
SUMMARY
According to the ICH guidelines, testing for system appropriateness, robustness, accuracy, repeatability, specificity, and linearity is a component of the RP-HPLC technology validation process. This method’s goal was to offer a rapid and simple way to determine the suggested stability analysis of EGCG and luteolin. Values for EGCG and luteolin for each validation parameter were noted and shown in Table 13, which is provided below.
Table 13: Validation parameters for EGCG and luteolin
|
Validation parameters |
EGCG |
Luteolin |
|
Absorption maxima (nm) |
280 |
280 |
|
Regression equation: y=mx+C |
Y=9784.8x-807.73 |
Y=12455x-1002.21 |
|
Slope (m) |
9784.8 |
12455 |
|
Intercept (C) |
807.73 |
1002.21 |
|
Correlation coefficient (R2) |
0.9991 |
0.999 |
|
Linearity range (µg/ml) |
10 - 60 |
10 - 60 |
|
Recovery (%) |
99.87 |
99.56 |
|
Inter-day |
0.68 |
0.35 |
|
Intra-day |
0.40 |
0.78 |
|
Value of LOD |
0.14 |
0.16 |
|
Value of LOQ |
0.42 |
0.49 |
|
Ruggedness (%) |
<1% |
<1% |
EXPERIMENTAL
Materials and methods
Chemicals
Oniosome Healthcare Pvt. Ltd. (Mohali) provided the drugs. Merck Lifesciences provided methanol, while Aventor Performance Material Pvt. Ltd. Supplied acetic acid. Analytical-grade chemicals and reagents were employed throughout. Water that had been double-distilled was used.
Method development
HPLC instrumentation
The technique was developed using HPLC system (Shimazdu LC2010CHT) with a UV visible detector. The HPLC system included an online degasser and a temperature-controlled column compartment. The chromatography software from Lab Solutions was used for data collection, processing, and reporting.
Standard stock solutions
10 mg of EGCG and 10 mg of luteolin reference standards were precisely weighed and placed into a 10 ml volumetric flask. The diluent (methanol) was added in about 6ml and sonicated until it was totally dissolved. To create a standard stock solution with 1000 µg/ml of each analyte, the volume was then adjusted with diluent. A 50 ml volumetric flask was filled with 5 ml of this solution, which was then diluted to volume with diluent to produce a stock solution of 100 µg/ml. A solution containing 40 µg/ml of each analyte was produced by removing precisely measured 0.4 ml of stock solution and diluting it with diluent to a final volume of 1 ml.
Selection of suitable wavelength
For the current study, a mobile phase solution containing 40 µg/ml of EGCG and luteolin each was prepared. To get a spectrum, this solution was further scanned in the 200 – 400 nm ultraviolet region.Optimized chromatographic conditions (Table 14).
Table 14: Chromatographic conditions for the determination of EGCG and luteolin
|
Stationary Phase |
250mm X 4.6, 5µm Shimadzu |
|
Elution mode |
Isocratic Mode |
|
Diluent |
Methanol |
|
Mobile phase |
Solvent A Was 1% Acetic Acid and solvent B was Methanol (5:95) |
|
Column temperature |
40 ᵒC |
|
Wavelength |
280 nm |
|
Flow rate |
1ml/min |
|
Injection volume |
5 µl |
|
Run time |
5 min |
Calibration curve
EGCG and luteolin calibration curves were plotted at 280 nm with concentration range of 10 – 60 µg/ml each. The precisely measured working stock solution of EGCG and luteolin at 280 nm was contained in a unique series flask. Every solution’s AUC was determined at every wavelength.
Validation for analytical methods
Specificity
Specificity refers to the analyte’s capacity to be reliably detected in the presence of potential constituents. Matrix, contaminants, and degradants are frequently among them. Other analytical methods can compensate for the lack of specificity of a particular method.(13)
Linearity
A method’s linearity is its capacity to generate observed analyte concentrations in tested samples that are proportionate to the theoretical analyte concentration in measured samples, either directly or by applying an appropriate mathematical modification. Plotting the dependent variable (area under curve Y) against the independent variable (concentration X) on the X-axis allowed for the display of calibration curve.(13)
Accuracy
Three distinct recovery studies were carried out utilizing cautious drug solution concentrations of 50%, 100%, and 150%. An analytical approach is considered accurate when its results closely resemble the theoretical values. The findings of the recovery research demonstrate that the technology is sensitive enough to detect analytes in samples if they are within 95-105% of the acceptance threshold.(13)Precision To ensure dependability, reproducibility, and repeatability when the same analytical procedure is applied to the same sample under standard experimental settings, the arrangement between different test findings is checked for precision.(14) To ascertain the levels of these two medications, intra-day and inter-day fluctuations were performed six times for particular concentrations—40 µg/ml of EGCG and luteolin for six consecutive days. The %RSD was calculated.
Detection limit and quantitation limit
The LOD is the lowest possible analyte concentration that is accurately and continuously detected in a certain sample and set of experimental conditions. The LOD values for a given sample are determined by a collection of experimental conditions and particular parameters. The method is quantitative, and the tool, technique, and other factors affect the result.(14)
The lowest analytical concentration of a tested chemical that can be found within a sample set is known as limit of quantification, or LOQ. Its value is around ten times more than the blank value.
Robustness
By deliberately changing the procedure parameters while analysing identical triplicate samples of EGCG and luteolin at concentration 40µg/ml, the resilience was investigated. The wavelength and flow rate were found to vary. By changing the wavelength by a range of ±2 nm, and ±0.1 mL/min flow rate the resilience of the approach was assessed.
Ruggedness
A different analyst tested the same EGCG and luteolin samples in triplicate at concentration of 40 µg/ml to assess their ruggedness. Changes in the retention time and peak area of EGCG and luteolin were observed in terms of percentage RSD.
CONCLUSION
This work developed and validated the RP-HPLC method for EGCG and luteolin, which may also be utilized for routine quality control analysis. It is straightforward, quick, accurate, precise, and linear. High resolution was achieved by the solvents usage in the mobile phase and the analytical technique's parameters. The distinctive method was fast; its run time and retention time were less than 20 minutes. The process was verified using ICH criteria. Under a variety of chromatographic settings, the method is reliable enough to replicate accurate results.
Conflict of Interest: No
Funding from any resource: No
Acknowledgement: We all authors are thankful to Director, Prof. (Dr.) Shailesh Sharma and members of management committee of college of Pharmacy, BELA (An Autonomous College), Rupnagar, Punjab.
REFERENCES

Bhanu Priya, Suman Lata, A New RP-HPLC Technique for Concurrent EGCG And Luteolin Estimation: Development and Validation, Int. J. of Pharm. Sci., 2026, Vol 4, Issue 8, 3745-3755, https://doi.org/10.5281/zenodo.22076077
 10.5281/zenodo.22076077