

We use cookies to ensure our website works properly and to personalise your experience. Cookies policy
D.Y. Patil School of Pharmacy, Ambi, Talegaon Dabhade- 410507 Pune, India.
Metabolic dysfunction-associated steatotic liver disease (MASLD) is the most common chronic liver disease worldwide, and its progressive form, metabolic dysfunction-associated steatohepatitis (MASH), now has approved drug treatments. Several circulating biomarkers are measured by enzyme-linked immunosorbent assay (ELISA), including the N-terminal pro-peptide of type III collagen (PRO-C3) and cytokeratin-18 (CK-18) fragments. In this narrative review we ask whether artificial intelligence (AI) can help interpret these ELISA-derived profiles well enough to improve detection of MASLD, fibrosis risk stratification and treatment monitoring beyond what is possible today. We keep the established and the speculative apart. On the established side are the fibrosis-4 (FIB-4) index and the ADAPT score, which combines ELISA-measured PRO-C3 with age, diabetes status and platelet count. On the speculative side are machine learning (ML) models for multi-biomarker panels, ML correction of assay artefacts and biomarker-guided choice of drug. CK-18, Fetuin-A and fibroblast growth factor 21 (FGF21) track with disease activity, but none is a validated stand-alone test for MASH. The resmetirom, semaglutide and emricasan trials also remind us that a biomarker moving in the right direction does not prove a patient is better off. We conclude that combining ELISA, AI and precision pharmacotherapy is a reasonable research agenda but not yet a clinical standard, and we set out the validation it still needs.
Roughly one adult in three has fatty liver disease1. For these patients, fibrosis is what matters most: its stage is the strongest histological predictor of liver-related outcomes and death2. Biopsy is still the reference standard for diagnosing metabolic dysfunction-associated steatohepatitis (MASH) and staging fibrosis, yet it is invasive, samples only a small fraction of the organ3, and pathologists do not always agree on the reading4. Interest in non-invasive testing has sharpened now that two drugs are approved for non-cirrhotic MASH with moderate to advanced fibrosis: resmetirom (accelerated approval from the US Food and Drug Administration [FDA], March 2024)5 and semaglutide (August 2025)6. Clinicians need ways to find patients who might qualify and to follow them once treatment starts.
Central research question
The question we address is whether AI-assisted interpretation of ELISA-derived biomarker profiles can improve detection of MASLD-related steatohepatitis, fibrosis risk stratification and treatment monitoring beyond current practice, meaning liver enzymes, the FIB-4 index and PRO-C3-based scores such as ADAPT.
Contribution of this review
Existing work on AI in MASLD leans heavily on imaging, health records and omics data, while reviews of biomarkers mostly focus on diagnostic accuracy. We try to join up three things that are usually discussed apart. The first is ELISA analytics: how assay performance and quality control shape the numbers a model receives. The second is interpretation: what each marker can and cannot tell us. The third is pharmacotherapy: what trials of approved and failed drugs show about whether a change in a biomarker means real clinical benefit. Established tools are kept separate from proposed ML extensions throughout, and each claim carries its level of evidence.
Scope and evidence framework
This is a narrative review, not a systematic one. Where sources differed, we gave most weight to guidelines, randomized trials and regulatory documents, then to original diagnostic-accuracy and validation studies, then to systematic reviews, and we used narrative reviews only for background. Trial and regulatory status reflects sources we accessed in October 2026.
We rely on two distinctions throughout. The first is the task a marker or model is meant to do: diagnosis (is steatohepatitis present now?), fibrosis staging (how likely is advanced fibrosis now?), prognosis (what will happen later?), prediction of treatment response (who will benefit from a given drug?) and monitoring (how is the patient changing?). Each is a different statistical problem with its own study design and reference standard. The second distinction is between three levels of support. Association means the marker correlates with histology or severity. Diagnostic performance means sensitivity, specificity, predictive values and calibration have been measured against a reference standard in the intended population, ideally with external validation. Clinical utility means using the marker changes decisions and improves outcomes. A marker can be associated with disease without performing well as a test, and a model that is very accurate in one dataset may never have shown clinical utility.
In the tables we grade evidence maturity as Established (guideline-endorsed, or backed by randomized trials or regulatory approval), Validated (accurate against histology in a derivation cohort and at least one independent cohort, but not widely endorsed), Associative (correlated with disease, with limited or inconsistent accuracy) or Proposed (conceptual, with no supporting data in MASLD).
MASLD: Nomenclature and Pathophysiology
In 2023 an international multisociety Delphi consensus renamed non-alcoholic fatty liver disease (NAFLD) as MASLD, and non-alcoholic steatohepatitis (NASH) as MASH7. The new names put systemic metabolic dysfunction at the center and drop wording that many patients found stigmatising. MASLD is diagnosed when there is hepatic steatosis plus at least one of five cardiometabolic criteria (overweight or obesity, impaired glucose regulation or type 2 diabetes, raised blood pressure, raised triglycerides, or low HDL cholesterol) and no other predominant cause7. MASH is the progressive, inflammatory form, defined on histology by steatosis, lobular inflammation and hepatocyte ballooning (Table 1).
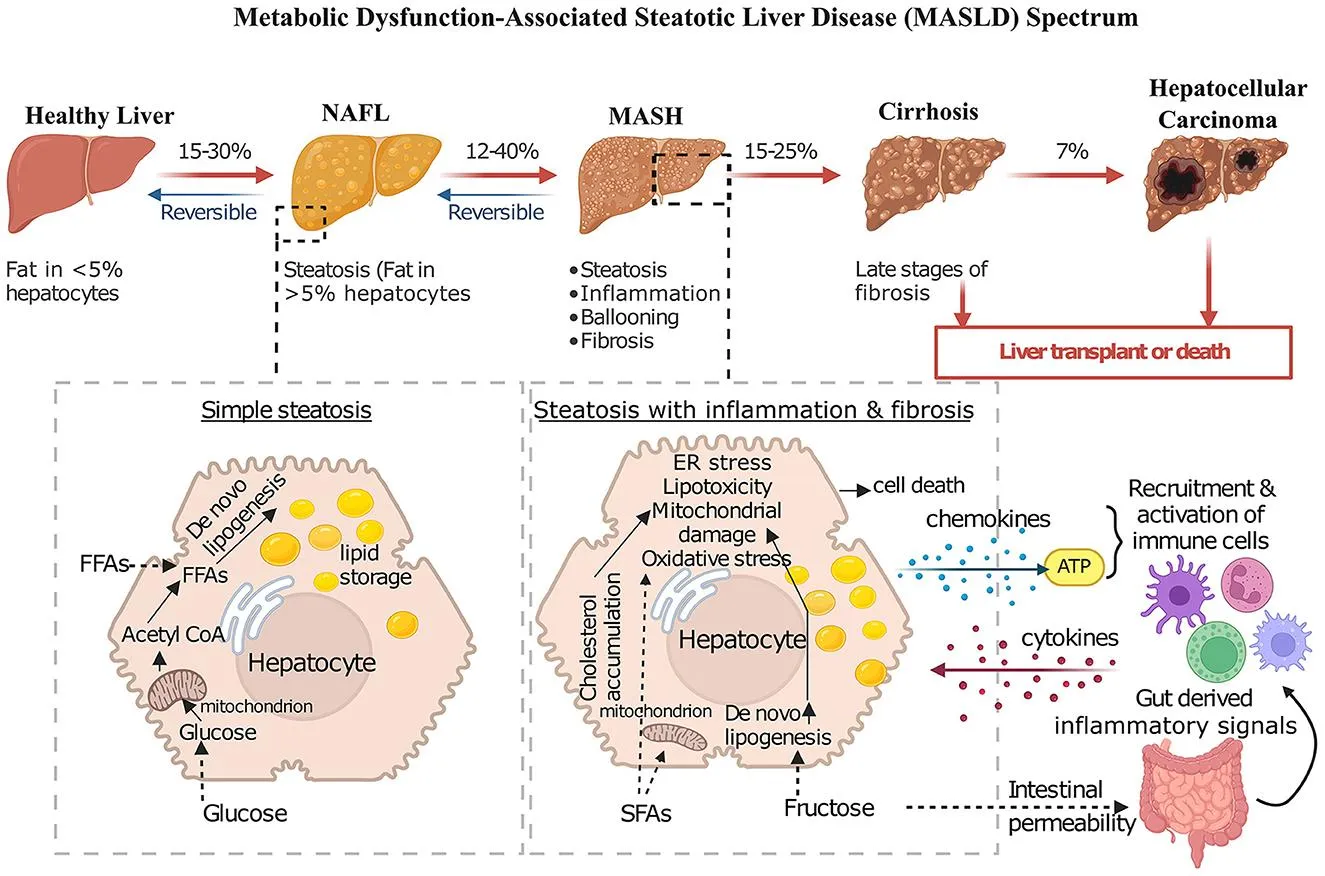
Figure 1: Pathophysiological Progression of MASLD and Development of Liver Fibrosis [30], [31], [32], [33]
The usual explanation of pathogenesis is a multiple-hit model8. Insulin resistance and the resulting hyperinsulinaemia drive adipose lipolysis and hepatic de novo lipogenesis. Fat accumulating in the liver then causes lipotoxicity, mitochondrial dysfunction and excess reactive oxygen species. These injure and kill hepatocytes, provoke inflammation, activate hepatic stellate cells and lead to deposition of extracellular matrix (ECM)8. Each step has a biomarker counterpart: CK-18 fragments reflect hepatocyte death, PRO-C3 reflects collagen formation, and hepatokines such as Fetuin-A and FGF21 reflect metabolic state.
Table 1: Nomenclature of Steatotic Liver Disease (SLD) After the 2023 Consensus7.
| Component | Previous term | Current term (2023) | Key diagnostic requirements |
|---|---|---|---|
| Overarching category | Fatty liver disease | Steatotic liver disease (SLD) | Hepatic steatosis on imaging or histology (more than 5% of hepatocytes on biopsy) |
| Primary condition | NAFLD | MASLD | Steatosis plus at least one cardiometabolic risk criterion; no other predominant cause |
| Progressive inflammatory form | NASH | MASH | Steatosis, lobular inflammation and hepatocyte ballooning on histology |
| Overlap with alcohol | None | MetALD | MASLD criteria with alcohol intake above MASLD limits but below the threshold for alcohol-related liver disease (about 140–350 g/week in women and 210–420 g/week in men) |
MASLD, metabolic dysfunction-associated steatotic liver disease; MASH, metabolic dysfunction-associated steatohepatitis; NAFLD, non-alcoholic fatty liver disease; NASH, non-alcoholic steatohepatitis; MetALD, MASLD with increased alcohol intake.
ELISA as the Analytical Foundation
ELISA underlies most of the biomarkers we discuss. In the sandwich format the analyte is trapped between a capture antibody fixed to the plate and an enzyme-linked detection antibody, and the signal is converted to a concentration through a calibration curve9. The ADAPT derivation and validation cohorts measured PRO-C3, a neo-epitope released during type III collagen formation, by ELISA10. In 269 healthy volunteers the reported reference range was 6.1–14.7 ng/mL, unrelated to sex, age, body mass index or ethnicity, and the assay held up under routine hospital sample handling11. CK-18 fragments (M30) have been measured with a commercial ELISA in multicenter studies12,13. Whatever model sits downstream can only be as good as these concentrations, so four analytical problems need attention.
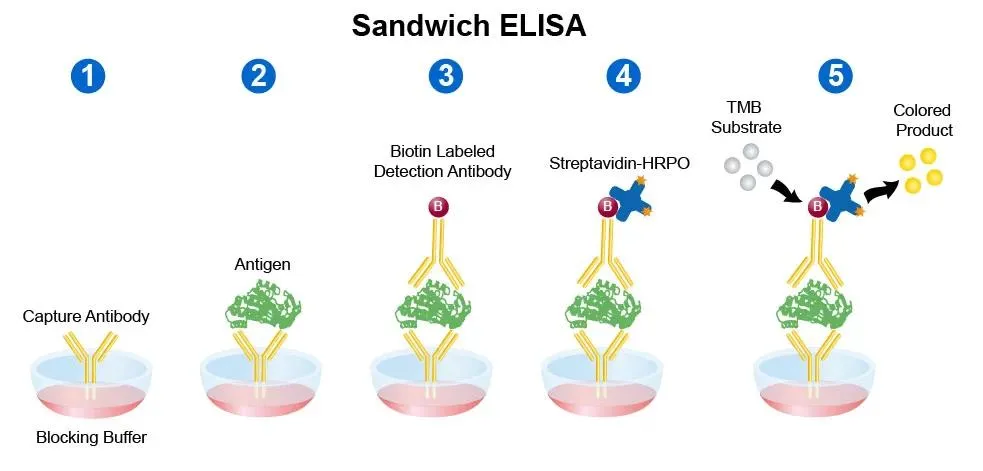
Figure 2: Principle of Sandwich ELISA for Quantitative Detection of Circulating Biomarkers. [9], [10], [12], [13], [14].
Pre-analytical variability.
Fasting state, time of collection, processing delay, storage temperature and repeated freeze–thaw cycles can all shift results. They should be recorded and standardised14.
Matrix interference. Serum and plasma contain lipids, haemoglobin, binding proteins and heterophilic antibodies, any of which can distort a signal. Lipaemia and haemolysis are routine selectivity checks when ligand-binding assays are validated9,14. Many people with MASLD have dyslipidaemia, so selectivity and parallelism should be shown in patients, not assumed from healthy volunteers.
High-dose hook effect.
In one-step sandwich formats, a large excess of analyte can saturate both antibodies and give a falsely low reading14. The usual remedies are dilutional linearity testing, two-step formats with a wash, and reflex dilution14. Whether the effect matters for a particular MASLD marker depends on the assay's dynamic range, which is something to test during validation rather than take for granted.
Calibration and batch effects.
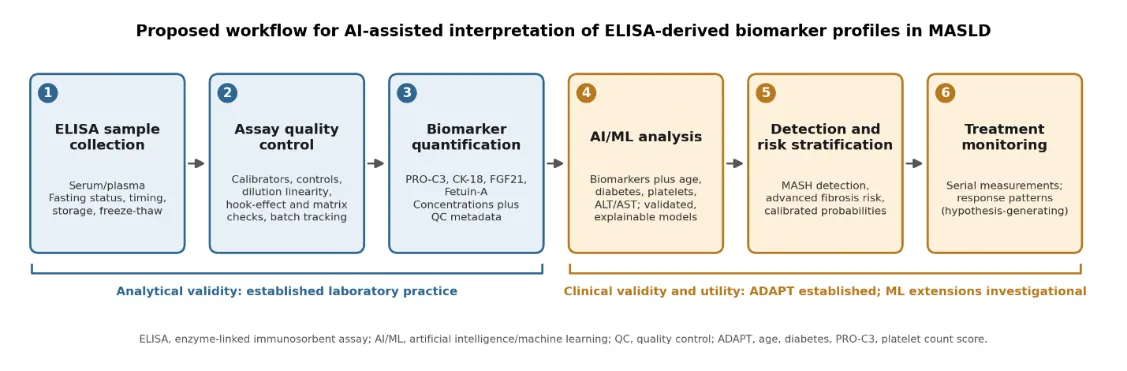
Figure 3: Proposed Workflow for AI-assisted Interpretation of ELISA-derived Biomarker Profiles in MASLD (Original Figure). Steps 1–3 Are Standard Laboratory Practice; Steps 4–6 Are Established Only for Fixed Scores Such as ADAPT, While ml Extensions Remain Investigational.
Standard curves are normally fitted with four- or five-parameter logistic models15. Kit lots, plates, operators and laboratories all add variation, and the regulatory status and standardization of kits differ between manufacturers, so each kit has to be checked individually.
AI and Machine Learning: What Is Demonstrated and What Is Proposed
Evidence status of AI applications along the ELISA workflow
AI could be applied at two levels: the assay (data quality) and the clinic (interpretation of results). The evidence at these levels is very different. Nothing we cite supports calling AI-based correction of assay artefacts a validated clinical standard (Table 2). Machine learning has been used to optimize a paper-based immunoassay for SARS-CoV-2 antibodies16, which shows the idea is technically feasible in another format, but none of the studies we cite validates ML correction of drift, matrix interference or hook effect in ELISAs for MASLD.
Table 2: Status of AI/ml Applications Relevant to ELISA-based MASLD Profiling.
| Application | Evidence status | Comment |
|---|---|---|
| Calibration curve fitting (four/five-parameter logistic regression) | Established (not AI) | Standard practice in ligand-binding assays15. Any ML alternative must outperform this baseline. |
| ML correction of assay drift, plate or batch effects | Proposed | Feasibility shown for other immunoassay formats16; no validated application to MASLD ELISAs in the cited literature. |
| ML flagging of hook effect or matrix interference | Proposed | The established approach is laboratory validation: dilutional linearity, parallelism and spike-recovery14. An ML flag could supplement but not replace these checks. |
| ML models for MASLD detection using routine clinical and laboratory variables | Demonstrated in retrospective datasets | Gradient-boosting models reached AUROC above 0.8 across five cohorts for steatosis screening17. These models use routine data rather than ELISA biomarker panels. |
| Composite blood scores that include an ELISA marker (e.g. MACK-3: HOMA-IR, AST, CK-18) | Validated in cohorts | Derived for fibrotic MASH18. This is a fixed composite score rather than an adaptive ML model. |
| ML models applied to multi-ELISA panels to improve MASH detection or fibrosis staging over ADAPT or FIB-4 | Proposed | Requires biopsy-labelled data with assay metadata, external validation and demonstration of incremental value. |
| Baseline ELISA panels to predict response to a specific drug | Proposed | Requires randomised data showing a biomarker-by-treatment interaction; not shown in the cited literature (Section 7). |
AUROC - area under the receiver operating characteristic curve; ML- machine learning; MACK-3, combination of HOMA-IR, AST and CK-18; HOMA-IR - homeostasis model assessment of insulin resistance; AST- aspartate aminotransferase.
Candidate models, data requirements, outputs and evaluation
Three model families are most often proposed for tabular biomarker data (Table 3). Random forests average many decision trees grown on bootstrap samples and cope well with non-linear effects and interactions19. Gradient-boosted trees such as XGBoost build trees one after another, each correcting the last; they usually do well on structured data but need regularization and careful tuning when samples are small20. Neural networks can model more complex signals, such as raw optical-density curves or serial measurements, but they need more data and are harder to interpret. Whatever is tried, a regularized logistic regression belongs in the comparison as a transparent baseline. ADAPT itself is a fixed published score, not an ML model retrained on local data.
The prediction target decides what data are needed. A diagnostic model needs a histological reference standard, ideally read centrally. A prognostic model needs follow-up for clinical events. A model that predicts treatment response needs randomized data from treated and control patients, because only a treatment-by-biomarker interaction can tell a predictive marker from one that is simply prognostic.
Table 3: Candidate ml Approaches for ELISA-derived Biomarker Data.
| Model | Potential use | Typical inputs | Typical outputs | Evaluation and main risks |
|---|---|---|---|---|
| Regularised logistic regression (baseline) | Transparent combination of markers; benchmark for any ML claim | Biomarker concentrations, age, diabetes status, platelets, ALT/AST, BMI | Probability of MASH or of advanced fibrosis | Calibration and discrimination; lowest overfitting risk; may miss non-linear effects |
| Random forest | Non-linear and interaction effects; feature importance | As above, plus assay metadata (plate, lot, dilution) | Class probability; variable importance | Nested cross-validation; probabilities often poorly calibrated without recalibration |
| Gradient boosting (XGBoost) | Tabular prediction with missing values | As above | Class probability or time-to-event risk | External validation; sensitive to tuning; high overfitting risk with a few hundred patients |
| Neural network | Curve-shape quality control; serial-measurement trajectories | Raw plate signals; repeated measures | Quality flag; trajectory forecast | Needs large datasets; difficult to interpret; limited MASLD evidence |
ALT: alanine aminotransferase; BMI: body mass index.
A single AUROC is not enough. Discrimination should come with sensitivity, specificity and predictive values at pre-specified thresholds, in a population with the prevalence of the intended setting. Calibration, meaning how closely predicted risks match observed ones, needs separate assessment, since a model can rank patients well and still give misleading absolute risks21. Decision-curve analysis can show whether a model would help clinical decisions22. New models should be compared directly with ADAPT or FIB-4 to show what they add, and reported following TRIPOD+AI for prediction models23 and STARD for diagnostic accuracy studies24.
Explainable AI
Explainable AI (XAI) methods such as SHapley Additive exPlanations (SHAP) estimate how much each input contributed to an individual prediction25. That can show a clinician whether a result was driven by PRO-C3, platelet count or something else. But SHAP describes what the model does, not what the biology does. Attributions say nothing about causation and can be unstable when inputs are correlated, as CK-18, ALT and AST often are. XAI is a supplement to external validation, not a substitute.
Limitations of model validation
Overfitting and small datasets.
Biopsy-labelled cohorts with ELISA data tend to be small. The ADAPT derivation and validation cohorts together had 431 patients10. A flexible model fitted to a few hundred patients with many candidate inputs can easily learn noise. Sample size should be calculated before data collection starts26.
Missing data and selection.
Only patients who have a biopsy get a reference label, so training data lean towards people clinicians already suspected of advanced disease. In the CK-18 registry, 85% of patients had MASH, a good example of how spectrum can change apparent performance13. Missing biomarker values are seldom random, and the choice of imputation can bias results.
Label noise.
The histological reference is itself imperfect, with sampling variability and observer disagreement3,4. That puts a ceiling on how accurate any model can appear.
External validation and population differences.
A model nearly always performs worse outside its derivation cohort. Age, diabetes, degree of obesity, ethnicity and setting (primary care versus specialist clinic) change both biomarker distributions and prevalence. Geographic and temporal validation should come before any clinical use.
Generalization across laboratories.
A model trained on one laboratory's concentrations can fail in another because of differences in kit lot, calibrators, platform or operator. In the CK-18 registry the best cut-off ranged from about 79 to 458 U/L between centres13. Unless calibration and reference materials are harmonized, models built on absolute concentrations are unlikely to transfer well.
Interpretability and drift.
A model in routine use needs locked versions, change control, monitoring for drift and outputs that clinicians can interpret.
Early Detection of MASH (Diagnosis)
By early detection we mean finding steatohepatitis, ideally at-risk MASH, in patients who already have steatosis. This is a diagnostic task with histology as the reference. Liver enzymes are a poor guide, because many patients with biopsy-proven steatohepatitis have normal ALT27. That is the reason to look at markers of the underlying biology (Table 4).
CK-18.
Caspases cleave CK-18 during hepatocyte apoptosis, and the fragments enter the blood. The M30 ELISA detects the caspase-cleaved form; M65 detects total CK-18 and so reflects cell death more broadly. An early multicenter study found higher fragment levels in NASH, an association that survived adjustment for covariates12. Later work was less encouraging. One study concluded that plasma CK-18 had limited value for identifying NASH or fibrosis28, and a systematic review and meta-analysis has since examined the accuracy of M30 and M6529. The largest registry so far enrolled 1,008 biopsy-proven patients from 14 centers. At its best cut-off of 275.7 U/L, M30 gave an AUROC of 0.750, sensitivity 55%, specificity 87%, positive predictive value 59% and negative predictive value 85%13. The authors judged M30 alone to be of limited diagnostic value, though it may help within combination tests13. We therefore treat CK-18 as a marker associated with steatohepatitis, not as an established stand-alone screening test.
Fetuin-A.
This hepatokines is linked to liver fat and insulin resistance in humans30 and has been implicated in lipid-induced insulin resistance31. Its levels mostly mirror general metabolic state and are not specific to steatohepatitis. We found no validated diagnostic thresholds for MASH in the sources we cite.
FGF21
FGF21 is raised in obesity and fatty liver disease32, in keeping with a stress-response hormone and the idea of FGF21 resistance. Nutritional and metabolic state influence its levels, which limits its specificity as a diagnostic marker. Its clinical relevance today is mainly therapeutic: an FGF21 analogue showed histological activity in a randomized phase 2b MASH trial33. That is a separate matter from, and does not validate, FGF21 as a diagnostic test.
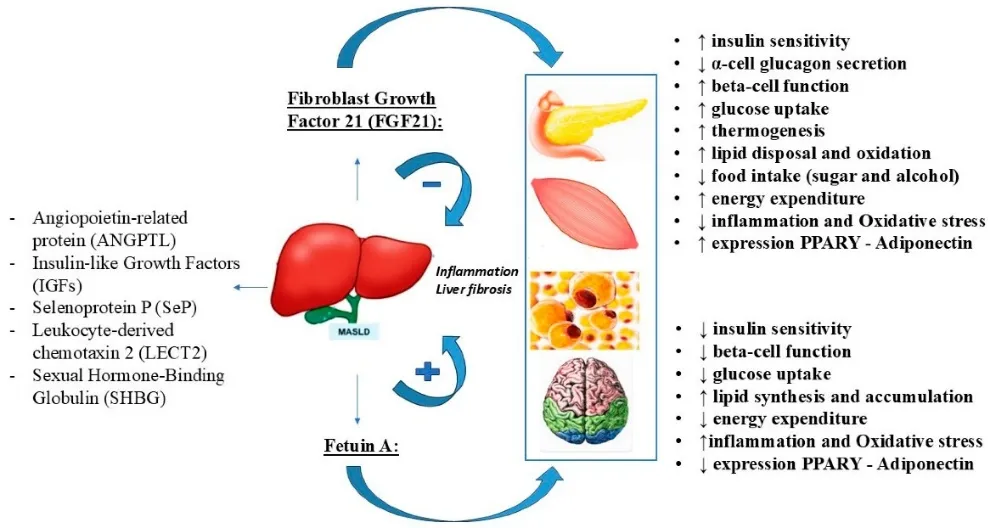
Figure 4: Biological Significance of Selected ELISA-measurable Biomarkers in MASLD. [12], [13], [28], [29], [30], [31], [32], [33]
Table 4: Comparison of Selected ELISA-measurable Biomarkers in MASLD.
| Biomarker | Biological role | Potential application (task) | Main limitations | Evidence level |
|---|---|---|---|---|
| CK-18 (M30/M65) | Caspase-cleaved (M30) and total (M65) cytokeratin-18 released from dying hepatocytes | Diagnosis of steatohepatitis; component of composite scores18; pharmacodynamic marker of anti-apoptotic drugs | Alone: AUROC 0.750, sensitivity 55%, PPV 59% in 1,008 patients13; inconsistent between studies28; cut-offs vary between centres | Associative as a stand-alone test; used within composite scores |
| PRO-C3 | Neo-epitope released during type III collagen formation; reflects ECM turnover and fibrogenesis | Staging of advanced fibrosis, alone or within ADAPT10 | AUC 0.79 for advanced fibrosis alone11; performance depends on population and setting; type III collagen is not liver-specific | Validated (derivation plus validation cohort) |
| FGF21 | Hepatokine and stress-response hormone; analogues are therapeutic agents | Possible marker of metabolic stress; therapeutic target33 | Elevated in obesity and NAFLD32; influenced by metabolic state; no validated diagnostic cut-off | Associative (diagnosis); therapeutic target studied in trials |
| Fetuin-A | Hepatokine linked to liver fat and insulin resistance | Possible marker of hepatic insulin resistance | Associated with liver fat and insulin resistance30; not specific to steatohepatitis; no validated cut-off | Associative |
PPV, positive predictive value; AUC, area under the curve; ECM, extracellular matrix.
Where AI might help.
Combining markers with clinical variables is sensible, and composite scores that include CK-18 already exist18. Whether ML adds accuracy over such regression-based composites in an independent population has not been shown in the studies we cite. A model claiming to find patterns before symptoms appear would need testing in prospective, biopsy-controlled cohorts. Biological plausibility from association studies is not enough.
Fibrosis Risk Stratification
Fibrosis stage is the main determinant of liver-related outcomes2. Here the task is mostly fibrosis staging, estimating the probability of advanced fibrosis (F3 or above) now, which is different from prognosis of future events. Guidelines recommend FIB-4 as the first-line test, followed by a second-line test such as an enhanced liver fibrosis (ELF) panel or transient elastography for patients at indeterminate or higher risk34,35. FIB-4 combines age, AST, ALT and platelet count36. It is good for ruling out advanced fibrosis but has a low positive predictive value, and its performance varies with age37.
PRO-C3.
The N-terminal propeptide of type III collagen is cleaved off as collagen is formed, so PRO-C3 reflects active-matrix formation rather than accumulated scar. That is a statement about biology; whether it works as a diagnostic test depends on the population, the clinical setting and the validation evidence. In 222 patients with NAFLD, PRO-C3 alone had an AUC of 0.83 for clinically significant fibrosis and 0.79 for advanced fibrosis11. Type III collagen is made in other tissues too, so levels may also be affected by extrahepatic fibrosis or inflammation.
ADAPT.
The ADAPT score combines PRO-C3 with age, diabetes status and platelet count to estimate the probability of advanced fibrosis10. It is a published, fixed scoring algorithm. It is not an AI model, and it is not retrained on local data. In two biopsy-proven cohorts (150 derivation and 281 validation patients) its AUROCs for advanced fibrosis were 0.86 and 0.87, and it beat APRI, FIB-4 and the NAFLD fibrosis score in most comparisons10. Note the word “most”: the advantage was not uniform. With only 431 patients in total, performance in primary care, community settings and more ethnically diverse populations still needs confirming, as do the best cut-offs for ruling advanced fibrosis in and out.
A possible role for ML.
ML could extend ADAPT by adding covariates, modelling non-linear effects or using serial PRO-C3 values, but the studies we cite do not show that such models beat ADAPT in independent cohorts. Forecasting fibrosis trajectories or decompensation from serial ELISA data is likewise only proposed. It would need longitudinal cohorts with adjudicated clinical outcomes, because prognosis cannot be inferred from the diagnostic accuracy of a single measurement.
Table 5: Existing and Proposed Approaches to Detection and Risk Stratification.
| Approach | Intended purpose | Advantages | Limitations | Evidence maturity |
|---|---|---|---|---|
| ALT and AST | General marker of hepatocellular injury | Cheap, universally available | Normal in a substantial proportion of patients with steatohepatitis27; poor for staging fibrosis | Established (limited accuracy) |
| FIB-4 | First-line rule-out of advanced fibrosis34,35 | Uses routine variables; guideline-endorsed | Low positive predictive value; age-dependent performance37; indeterminate range needs second-line tests | Established |
| PRO-C3 and ADAPT | Estimation of probability of advanced fibrosis10 | Reflects fibrogenesis; outperformed FIB-4 in most comparisons in two cohorts | Small validation set (431 patients in total); needs ELISA; wider validation needed | Validated (limited cohorts) |
| AI-enhanced multi-biomarker models | Possible improvement of detection, staging or prognosis | Can capture non-linear effects and combine many inputs | Overfitting, calibration and generalisation risks; incremental value over ADAPT or FIB-4 not shown | Proposed |
Treatment Monitoring and Response Prediction
Four different roles for a biomarker
A biomarker can play four roles. It can be pharmacodynamic (it changes when a drug hits its target), a surrogate endpoint (its change predicts clinical benefit), prognostic (it predicts outcome regardless of treatment) or predictive (its baseline value identifies who will benefit from a particular treatment). The last three need evidence linking the marker to outcomes or to treatment effect. The studies below show why the difference matters.
Approved therapies and current evidence
Resmetirom.
Resmetirom is an oral, liver-directed agonist selective for thyroid hormone receptor beta (THR-β). In the phase 3 MAESTRO-NASH trial, in patients with NASH and fibrosis stage F1B to F3, both primary histological endpoints were met at week 52. MASH resolution without worsening of fibrosis occurred in 25.9% (80 mg) and 29.9% (100 mg) of patients, against 9.7% on placebo. Fibrosis improved by at least one stage without worsening of the NAFLD activity score in 24.2% and 25.9%, against 14.2%38. The FDA granted accelerated approval for non-cirrhotic MASH with moderate to advanced fibrosis on 14 March 20245. Accelerated approval rests on histological surrogate endpoints, and follow-up for clinical outcomes continues.
Semaglutide.
Part 1 of the phase 3 ESSENCE trial has now been published39. In 800 patients with MASH and fibrosis stage F2 or F3, once-weekly subcutaneous semaglutide 2.4 mg for 72 weeks gave MASH resolution without worsening of fibrosis in 62.9% versus 34.3% on placebo, fibrosis improvement without worsening of steatohepatitis in 36.8% versus 22.4%, and both together in 32.7% versus 16.1%39. Mean weight loss was about 10.5%, but these endpoints cannot separate the contribution of weight loss from other mechanisms. The FDA granted accelerated approval for adults with non-cirrhotic MASH and moderate to advanced fibrosis in August 20256. Part 2, which looks at long-term clinical outcomes, is continuing and has not reported in the sources we reviewed.
Can baseline ELISA panels predict who responds to which drug?
For now, this is a hypothesis, not a capability. Drug choice today rests on clinical features such as cirrhosis status, coexisting obesity or diabetes, and tolerability, not on ELISA panels. It is biologically plausible that a patient whose disease is driven mainly by obesity and insulin resistance would do better on a GLP-1 receptor agonist, and another on a liver-directed THR-β agonist. But no randomized comparison or validated predictive model in the studies we cite supports this. The two pivotal trials enrolled different populations and ran for different durations, so cross-trial comparisons are confounded. Showing predictive value would take pre-specified analyses of baseline biomarker-by-treatment interactions in randomized trials with histological outcomes, then validation in an independent trial.
Monitoring response
Serial blood tests are an attractive, non-invasive alternative to repeat biopsy. Changes in PRO-C3 have been reported to track antifibrotic drug response in some studies11, but we found no validated threshold of change that predicts histological response or clinical outcome. A monitoring marker also needs known within-person variability and analytical imprecision, so that a real change can be told apart from assay noise.
Lessons from emricasan
Emricasan, an oral pan-caspase inhibitor, shows why a biomarker change cannot be equated with benefit. In an open-label study it lowered serum caspase activity and cleaved CK-18 in patients with cirrhosis40. ENCORE-NF was a randomized phase 2 trial in 318 patients with NASH and F1 to F3 fibrosis. After 72 weeks, fibrosis had not improved without worsening of NASH (11.2% and 12.3% with 5 mg and 50 mg, against 19.0% on placebo), NASH resolution was not increased, and the authors noted evidence of target engagement and a possible worsening of fibrosis and ballooning41. ENCORE-PH was a randomised phase 2b trial in 263 patients with NASH cirrhosis and severe portal hypertension. Emricasan did not improve the hepatic venous pressure gradient or clinical outcomes despite reductions in biomarkers of target engagement, and those reductions, present at week 24, had faded back to baseline by week 4842.
So lowering an apoptosis biomarker showed that the drug was acting, but this did not turn into histological or hemodynamic benefit. The trials do not point to one explanation for the failure. Possibilities include the wrong target or incomplete coverage of it, the stage of disease (cirrhosis versus earlier disease), dose and duration, and possible harm from caspase inhibition in some settings. For AI-assisted monitoring the lesson is practical: a model should not treat a drug's own pharmacodynamic marker as a stand-in for efficacy unless the link has been shown.
Table 6: Selected Clinical Trials Relevant to Biomarker-Guided Treatment in MASH.
| Trial (agent) | Phase | Population | Primary endpoint | Key findings | Status and source |
|---|---|---|---|---|---|
| MAESTRO-NASH (resmetirom) | 3 | NASH with fibrosis F1B–F3 | At week 52: MASH resolution without worsening of fibrosis; fibrosis improvement ≥1 stage without worsening NAS | Resolution 25.9% (80 mg), 29.9% (100 mg) vs 9.7% placebo; fibrosis improvement 24.2%, 25.9% vs 14.2%38 | FDA accelerated approval 14 Mar 20245 |
| ESSENCE part 1 (semaglutide 2.4 mg) | 3 | MASH with fibrosis F2–F3; 800 patients in part 1 | At week 72: MASH resolution without worsening of fibrosis; fibrosis improvement without worsening of steatohepatitis | Resolution 62.9% vs 34.3%; fibrosis improvement 36.8% vs 22.4%; both 32.7% vs 16.1%39 | Part 1 published 202539; FDA accelerated approval Aug 20256; part 2 (outcomes) ongoing |
| ENCORE-NF (emricasan) | 2 | NASH with fibrosis F1–F3; 318 patients | At week 72: fibrosis improvement without worsening of NASH | Not met: 11.2% and 12.3% vs 19.0% placebo; NASH resolution not improved; target engagement shown41 | Primary endpoint not met; not approved |
| ENCORE-PH (emricasan) | 2b | NASH cirrhosis with HVPG ≥12 mmHg; 263 patients | Change in hepatic venous pressure gradient at week 24 | No significant difference vs placebo; biomarkers fell at week 24 but returned to baseline by week 4842 | Primary endpoint not met; not approved |
NAS, NAFLD activity score; HVPG, hepatic venous pressure gradient. Percentages are as reported in the primary publications.
Research Gaps and Challenges
Assay standardization
Absolute concentrations transfer between laboratories only if calibration is harmonized. The spread of best CK-18 cut-offs across centers in the registry13 shows the problem. Reference materials, harmonized calibrators and proficiency testing are prerequisites for any model built on absolute concentrations, and consortium efforts such as NIMBLE aim to tackle this.
Biomarker reproducibility
Within-person variability, fasting state, comorbidity and sample handling all affect measured values14. For monitoring in particular, the smallest change that exceeds biological and analytical variation has to be defined for each marker.
Clinical validation
Most evidence comes from cross-sectional diagnostic studies in specialist cohorts with histology. What is missing is prospective validation in the intended population, including primary care and diabetes clinics, linked to outcomes and compared with FIB-4, ADAPT and elastography.
Cost and access
ELISA kits are fairly cheap per test, but cost-effectiveness against FIB-4 plus elastography has not been established. Batch-based ELISA workflows, staff time and turnaround also differ from random-access automated analyzers.
Data availability
Biopsy-labelled datasets with harmonized ELISA data are small and scattered. Training and testing models will need multicenter data sharing, common data standards and routine recording of assay metadata such as kit lot, plate, dilution and quality-control results.
Privacy and governance
Training on patient-level data requires compliance with data-protection law, proper consent and secure storage. Federated learning, where models are trained across sites without moving patient data, has been proposed as a solution but is not yet established for MASLD biomarker models.
Regulation and implementation
An ML model that influences clinical decisions may count as medical software. Routine use would need locked algorithm versions, documented change control, links to laboratory information systems, drift monitoring and clear clinical-governance responsibility. Equity matters too, because a model validated in one population may perform worse in another.
CONCLUSION
The recognition of metabolic dysfunction-associated steatotic liver disease (MASLD) as a systemic metabolic condition, together with approved treatments for metabolic dysfunction-associated steatohepatitis (MASH), has increased the need for non-invasive methods of detection, fibrosis assessment and treatment monitoring. ELISA-based biomarkers provide a useful foundation for measuring processes associated with hepatocyte injury and extracellular matrix formation. PRO-C3 has demonstrated value when combined with age, diabetes status and platelet count in the established ADAPT score for identifying advanced fibrosis. However, CK-18, Fetuin-A and FGF21 remain insufficiently validated as stand-alone diagnostic tests.
Artificial intelligence (AI), particularly machine learning, may improve interpretation of multiple biomarkers alongside clinical variables, identify complex patterns and support longitudinal assessment. Nevertheless, current evidence does not establish AI-assisted ELISA profiling as a routine clinical tool. Proposed applications, including correction of assay variability, prediction of drug response and forecasting of fibrosis progression, require further investigation. The experience with emricasan also demonstrates that changes in pharmacodynamic biomarkers cannot automatically be considered evidence of histological improvement or clinical benefit.
Future progress will depend on standardized ELISA methods, larger multicenter datasets, prospective studies with histological and clinical outcomes, and independent validation across diverse populations. New models must demonstrate calibration, explainability, clinical utility and additional value over established approaches such as FIB-4 and ADAPT. Cost-effectiveness, data privacy, regulatory oversight and equitable implementation must be addressed. Overall, integrating ELISA-derived biomarkers with AI represents a promising research direction for precision assessment and management of MASLD, but clinical adoption should await robust validation and evidence of improved patient care.
Abbreviations
ADAPT, age, diabetes, PRO-C3, platelet count score; AI, artificial intelligence; ALT, alanine aminotransferase; AST, aspartate aminotransferase; AUC, area under the curve; AUROC, area under the receiver operating characteristic curve; CK-18, cytokeratin-18; ECM, extracellular matrix; ELF, enhanced liver fibrosis; ELISA, enzyme-linked immunosorbent assay; FDA, US Food and Drug Administration; FGF21, fibroblast growth factor 21; FIB-4, fibrosis-4 index; HVPG, hepatic venous pressure gradient; MASH, metabolic dysfunction-associated steatohepatitis; MASLD, metabolic dysfunction-associated steatotic liver disease; MetALD, MASLD with increased alcohol intake; ML, machine learning; NAFLD, non-alcoholic fatty liver disease; NAS, NAFLD activity score; NASH, non-alcoholic steatohepatitis; PRO-C3, N-terminal pro-peptide of type III collagen; SHAP, SHapley Additive exPlanations; SLD, steatotic liver disease; THR-β, thyroid hormone receptor beta; XAI, explainable artificial intelligence.
REFERENCES




Namita Kamble, Shubhangi Lal, Aastha Patel, Tushar Ingle, Hemant Gupta, Rohan Mane, Kesar Bankar, Atish Pathak, AI-Assisted ELISA Biomarker Profiling in MASLD: Integrating Early Detection, Risk Stratification, and Treatment Monitoring, Int. J. of Pharm. Sci., 2026, Vol 4, Issue 11, 2882-2895. https://doi.org/10.5281/zenodo.24332563
 10.5281/zenodo.24332563