

We use cookies to ensure our website works properly and to personalise your experience. Cookies policy
1Department of Pharmaceutical Analysis, Teegala Krishna Reddy College of Pharmacy, Medbowli, Meerpet (V), Balapur (M), Ranga Reddy (Dist), Hyderabad – 500097, Telangana.
2Department of Pharmaceutical Chemistry, Associate Professor, Teegala Krishna Reddy College of Pharmacy, Medbowli, Meerpet (V), Balapur (M), Ranga Reddy (Dist), Hyderabad – 500097, Telangana.
3Department of Pharmaceutical Chemistry, Principal and Professor, Teegala Krishna Reddy College of Pharmacy, Medbowli, Meerpet (V), Balapur (M), Ranga Reddy (Dist), Hyderabad – 500097, Telangana.
4Department of Pharmaceutical Analysis, Associate Professor, Teegala Krishna Reddy College of Pharmacy, Medbowli, Meerpet (V), Balapur (M), Ranga Reddy (Dist), Hyderabad – 500097, Telangana.
A simple, rapid, specific and accurate reverse phase high performance liquid chromatographic method has been developed for the validated of Tucatinib in bulk as well as in marketed pharmaceutical dosage form. This separation was performed on a Symmetry ODS C18 (4.6×250mm, 5µm) column with Methanol: Phosphate Buffer (35:65%) v/v as mobile phase at a flow rate of 1.0 mL min?1 with UV detection at 235 nm; the constant column temperature was Ambient. The run time under these chromatographic conditions was less than 8 min. The retention time of Tucatinib was found to be 2.257min. The calibration plot was linear over the concentration range of 6–14 ?g mL?1 with limits of detection and quantification values of 1.2 and 3.6 ng mL?1 respectively. The mean % assay of marketed formulation was found to be 99.86%, and % recovery was observed in the range of 98-102%. Relative standard deviation for the precision study was found <2%.The developed method is simple, precise, specific, accurate and rapid, making it suitable for estimation of Tucatinib in bulk and marketed pharmaceutical dosage form dosage form.
Tucatinib is a kinase inhibitor used to treat certain types of unresectable/metastatic HER-2 positive breast cancer. Tucatinib is a kinase inhibitor drug used with Trastuzumab and Capecitabine in the treatment of unresectable or metastatic HER-2 positive breast cancer1. It was developed by Seattle Genetics and approved by the FDA on April 17, 2020. Tucatinib (Tukysa) is a targeted tyrosine kinase inhibitor used to treat HER2-positive breast and colorectal cancers by blocking abnormal protein signals that cause cancer growth. By inhibiting tyrosine kinase, Tucatinib exerts anti-tumor activity, reducing the size of HER-2 positive breast cancer tumors2. In clinical trials, the regimen of Tucatinib and Trastuzumab showed enhanced activity both in vitro and in vivo when compared to either drug administered by it. It is primarily used in combination with Trastuzumab and Capecitabine for advanced, metastatic, or unresectable cancers, and is noted for its ability to treat tumors that have spread to the brain3. The IUPAC Name of Tucatinib is 6-N-(4, 4-dimethyl-5H-1, 3-oxazol-2-yl)-4-N-[3-methyl-4-([1, 2, 4] triazolo [1, 5-a] pyridin-7-yloxy) phenyl] quinazoline-4, 6-diamine. The Chemical Structure of Tucatinib is shown in follows
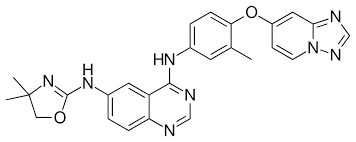
Figure None: 1: Chemical Structure of Tucatinib
The considerable literature survey disclose that the analytical methods reported for estimation of Tucatinib alone and in combination with other drug, but no analytical methods was reported for estimation of Tucatinib. So, it was thought of interest to develop simple, accurate, precise and reproducible RP-HPLC method for estimation of Tucatinib in their bulk form and Marketed Pharmaceutical Dosage forms28-31. Methods were validated as per ICH guidelines27 [Q2 (R1)].
MATERIALS AND METHODS
Table None: 1: Instruments Used
| S.No. | Instruments and Glass wares | Model |
|---|---|---|
| 1 | HPLC | WATERS Alliance 2695 separation module, Software: Empower 2, 996 PDA detector. |
| 2 | pH meter | Lab India |
| 3 | Weighing machine | Sartorius |
| 4 | Volumetric flasks | Borosil |
| 5 | Pipettes and Burettes | Borosil |
| 6 | Beakers | Borosil |
| 7 | Digital ultra sonicator | Labman |
Table None: 2: Chemicals Used
| S.No. | Chemical | Brand Names |
|---|---|---|
| 1 | Tucatinib | Synpharma Research Lab, Hyderabad |
| 2 | Water and Methanol for HPLC | LICHROSOLV (MERCK) |
| 3 | Acetonitrile for HPLC | Merck |
HPLC Method Development:
Preparation of Standard Solution:
Accurately weigh and transfer 10 mg of Tucatinib working standard into a 10ml of clean dry volumetric flasks add about 7ml of Methanol and sonicate to dissolve and removal of air completely and make volume up to the mark with the same Methanol.
Further pipette 0.1ml of the above Tucatinib stock solutions into a 10ml volumetric flask and dilute up to the mark with Methanol.
Procedure:
Inject the samples by changing the chromatographic conditions and record the chromatograms, note the conditions of proper peak elution for performing validation parameters as per ICH guidelines27.
Mobile Phase Optimization:
Initially the mobile phase tried was Methanol and Methanol: Water with varying proportions. Finally, the mobile phase was optimized to Methanol: Phosphate Buffer in proportion 35:65% v/v.
Optimization of Column:
The method was performed with various C18 columns like, X- bridge column, Xterra, and C18 column. Symmetry ODS C18 (4.6mm x 250mm, 5μm) was found to be ideal as it gave good peak shape and resolution at 1.0ml/min flow.
Preparation of Potassium dihydrogen Phosphate (KH2PO4) buffer (pH-3.6):
Dissolve 6.8043 of potassium dihydrogen phosphate in 1000 ml HPLC water and adjust the pH 3.6 with diluted orthophosphoric acid. Filter and sonicate the solution by vacuum filtration and ultra-sonication4.
Preparation of Mobile Phase:
Accurately measured 350 ml (35%) of Methanol, 650 ml of Phosphate buffer (65%) were mixed and degassed in digital ultra sonicater for 15 minutes and then filtered through 0.45 µ filter under vacuum filtration.
Diluent Preparation:
The Mobile phase was used as the diluent5.
Method Validation Parameters
System Suitability
Accurately weigh and transfer 10 mg of Tucatinib working standard into a 10ml of clean dry volumetric flasks add about 7mL of Diluents and sonicate to dissolve it completely and make volume up to the mark with the same solvent. (Stock solution)
Further pipette 0.1ml of the above Tucatinib stock solution into a 10ml volumetric flask and dilute up to the mark with diluents.
Procedure:
The standard solution was injected for five times and measured the area for all five injections in HPLC. The %RSD for the area of five replicate injections was found to be within the specified limits.
Specificity:
Preparation of Standard Solution:
Accurately weigh and transfer 10 mg of Tucatinib working standard into a 10ml of clean dry volumetric flasks add about 7ml of Diluents and sonicate to dissolve it completely and make volume up to the mark with the same solvent. (Stock solution)
Further pipette 0.1ml of the above Tucatinib stock solutions into a 10ml volumetric flask and dilute up to the mark with diluents.
Preparation of Sample Solution:
Weight 10 mg equivalent weight of Tucatinib sample into a 10mL clean dry volumetric flask and add about 7mL of Diluent and sonicate to dissolve it completely and make volume up to the mark with the same solvent.
Further pipette 0.1ml of Tucatinib above stock solution into a 10ml volumetric flask and dilute up to the mark with diluent.
Procedure:
Inject the three replicate injections of standard and sample solutions and calculate the assay by using formula:
%ASSAY =
Sample area Weight of standard Dilution of sample Purity Weight of tablet
___________ × ________________ × _______________×_______×______________×100
Standard area Dilution of standard Weight of sample 100 Label claim
Linearity and Range:
Accurately weigh and transfer 10 mg of Tucatinib working standard into a 10ml of clean dry volumetric flasks add about 7ml of Diluents and sonicate to dissolve it completely and make volume up to the mark with the same solvent. (Stock solution)
Preparation of Level – I (6ppm of Tucatinib):
Take 0.6ml of stock solution in to 10ml of volumetric flask and make up the volume up to mark with diluents and sonicate the solution for bubble entrapment using ultrasonicator.
Preparation of Level – II (8ppm of Tucatinib):
Take 0.8ml of stock solution in to 10ml of volumetric flask and make up the volume up to mark with diluents and sonicate the solution for bubble entrapment using ultrasonicator.
Preparation of Level – III (10ppm of Tucatinib):
Take 0.1ml of stock solution in to 10ml of volumetric flask and make up the volume up to mark with diluents and sonicate the solution for bubble entrapment using ultrasonicator.
Preparation of Level – IV (12ppm of Tucatinib):
Take 0.12ml of stock solution in to 10ml of volumetric flask and make up the volume up to mark with diluents and sonicate the solution for bubble entrapment using ultrasonicator.
Preparation of Level – V (14ppm of Tucatinib):
Take 0.14ml of stock solution in to 10ml of volumetric flask and make up the volume up to mark with diluents and sonicate the solution for bubble entrapment using ultrasonicator.
Procedure:
Inject each level into the chromatographic system and measure the peak area.
Plot a graph of peak area versus concentration (on X-axis concentration and on Y-axis Peak area) and calculate the correlation coefficient6.
Precision
Repeatability
Preparation of Tucatinib Product Solution for Precision:
Accurately weigh and transfer 10 mg of Tucatinib working standard into a 10ml of clean dry volumetric flasks add about 7ml of Diluents and sonicate to dissolve it completely and make volume up to the mark with the same solvent. (Stock solution)
Further pipette 0.1ml of the above Tucatinib stock solutions into a 10ml volumetric flask and dilute up to the mark with diluents.
Procedure:
The standard solution was injected for six times and measured the area for all six injections in HPLC. The %RSD for the area of six replicate injections was found to be within the specified limits.
Intermediate Precision:
To evaluate the intermediate precision (also known as Ruggedness) of the method, Precision was performed on different days by maintaining same conditions.
Procedure:
Analyst 1:
The standard solution was injected for six times and measured the area for all six injections in HPLC. The %RSD for the area of six replicate injections was found to be within the specified limits.
Analyst 2:
The standard solution was injected for six times and measured the area for all six injections in HPLC. The %RSD for the area of six replicate injections was found to be within the specified limits.
Accuracy:
For preparation of 50% Standard Stock Solution:
Accurately weigh and transfer 10 mg of Tucatinib working standard into a 10ml of clean dry volumetric flasks add about 7mL of Diluents and sonicate to dissolve it completely and make volume up to the mark with the same solvent. (Stock solution)
Further pipette 0.05ml of the above Tucatinib stock solution into a 10ml volumetric flask and dilute up to the mark with diluents.
For preparation of 100% Standard Stock Solution:
Accurately weigh and transfer 10 mg of Tucatinib working standard into a 10ml of clean dry volumetric flasks add about 7mL of Diluents and sonicate to dissolve it completely and make volume up to the mark with the same solvent. (Stock solution)
Further pipette 0.1ml of the above Tucatinib stock solution into a 10ml volumetric flask and dilute up to the mark with diluents.
For preparation of 150% Standard Stock Solution:
Accurately weigh and transfer 10 mg of Tucatinib working standard into a 10ml of clean dry volumetric flasks add about 7mL of Diluents and sonicate to dissolve it completely and make volume up to the mark with the same solvent. (Stock solution)
Further pipette 0.15ml of the above Tucatinib stock solution into a 10ml volumetric flask and dilute up to the mark with diluents.
Procedure:
Inject the Three replicate injections of individual concentrations (50%, 100%, 150%) were made under the optimized conditions. Recorded the chromatograms and measured the peak responses. Calculate the Amount found and Amount added for Tucatinib and calculate the individual recovery and mean recovery values.
Limit of Detection and Limit of Quantification (LOD & LOQ):
Preparation of 0.95µg/ml Solution (For LOD):
Accurately weigh and transfer 10 mg of Tucatinib working standard into a 10ml of clean dry volumetric flasks add about 7ml of Diluents and sonicate to dissolve it completely and make volume up to the mark with the same solvent. (Stock solution)
Further pipette 0.0095ml of the above Tucatinib stock solutions into a 10ml volumetric flask and dilute up to the mark with diluents.
Preparation of 2.9µg/ml Solution (For LOQ):
Accurately weigh and transfer 10 mg of Tucatinib working standard into a 10ml of clean dry volumetric flasks add about 7ml of Diluents and sonicate to dissolve it completely and make volume up to the mark with the same solvent. (Stock solution)
Further pipette 0.029ml of the above Tucatinib stock solutions into a 10ml volumetric flask and dilute up to the mark with diluents.
Robustness:
The analysis was performed in different conditions to find the variability of test results. The following conditions are checked for variation of results. .
For preparation of Standard solution:
Accurately weigh and transfer 10 mg of Tucatinib working standard into a 10ml of clean dry volumetric flasks add about 7mL of Diluents and sonicate to dissolve it completely and make volume up to the mark with the same solvent. (Stock solution)
Further pipette 0.1ml of the above Tucatinib stock solution into a 10ml volumetric flask and dilute up to the mark with diluents.
Effect of Variation of Flow Conditions:
The sample was analyzed at 0.9 ml/min and 1.1 ml/min instead of 1ml/min, remaining conditions are same. 10µl of the above sample was injected and chromatograms were recorded.
Effect of Variation of Mobile Phase Organic Composition:
The sample was analyzed by variation of mobile phase i.e. Methanol: Phosphate Buffer was taken in the ratio and 40:60, 30:70 instead (35:65), remaining conditions are same. 10µl of the above sample was injected and chromatograms were recorded.
RESULTS AND DISCUSSION
Analytical Method Development:
Sample & Standard Preparation for the UV-Spectrophotometer Analysis:
25 mg of Tucatinib standard was transferred into 25 ml volumetric flask, dissolved & make up to volume with mobile phase. Further dilution was done by transferring 0.1 ml of the above solution into a 10ml volumetric flask and make up to volume with mobile phase.
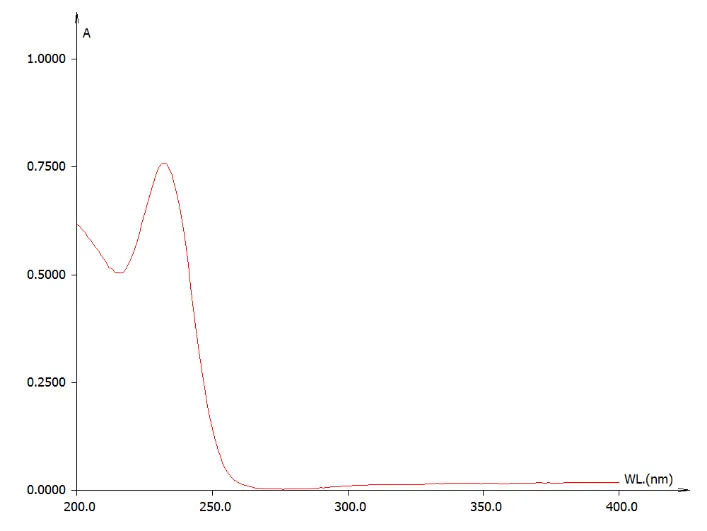
Figure None: 2: UV Spectrum for Tucatinib (235nm)
Observation: While scanning the Tucatinib solution we observed the maxima at 235nm. The UV spectrum has been recorded on T60-LAB INDIA make UV – Vis spectrophotometer model UV-2450.
Optimized Chromatographic Conditions:
Mobile phase ratio : Methanol: Phosphate Buffer (35:65%) v/v
Column : Symmetry ODS C18 (4.6mm×250mm, 5µm)
Column temperature : Ambient
Wavelength : 235 nm
Flow rate : 1.0 mL/min
Injection volume : 10.0µl
Run time : 8.0 min
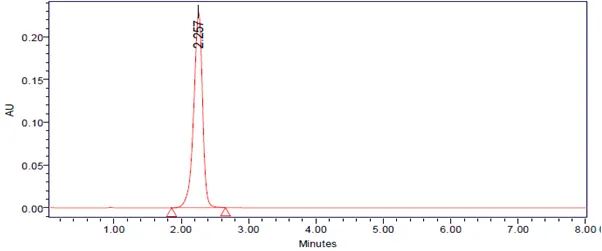
Figure None: 3: Optimized Chromatographic Condition
Validation of Analytical Method
System Suitability:
The test was carried out by making five replicate injections of a standard solution containing 10μg/ml of Tucatinib and analyzing each solute for their peak area, theoretical plates (N), tailing factor (T) and asymmetric factors (As). The results of System Suitability test7 were shown in table-3.
Table None: 3: Results of System Suitability for Tucatinib
| S.No. | Peak Name | RT | Area (µV*sec) | Height (µV) | USP Plate Count | USP Tailing |
|---|---|---|---|---|---|---|
| 1 | Tucatinib | 2.277 | 1652847 | 185647 | 6589 | 1.24 |
| 2 | Tucatinib | 2.277 | 1653658 | 186254 | 6587 | 1.26 |
| 3 | Tucatinib | 2.267 | 1654521 | 185475 | 6584 | 1.28 |
| 4 | Tucatinib | 2.265 | 1653564 | 186594 | 6582 | 1.29 |
| 5 | Tucatinib | 2.277 | 1658745 | 185684 | 6895 | 1.24 |
| Mean | 1654667 | |||||
| Std. Dev. | 2355.764 | |||||
| % RSD | 0.142371 |
Specificity
The ICH documents define specificity as the ability to assess unequivocally the analyte in the presence of components that may be expected to be present, such as impurities, degradation products, and matrix components8. Analytical method was tested for specificity to measure accurately quantitates Tucatinib in drug product.
%ASSAY =
Sample area Weight of standard Dilution of sample Purity Weight of tablet
___________ × ________________ × _______________×_______×______________×100
Standard area Dilution of standard Weight of sample 100 Label claim
= 99.40%
CONCLUSION:
The % purity of Tucatinib in pharmaceutical dosage form was found to be 99.40%9.
Linearity
The linearity of the developed method was evaluated by processing five different concentration levels of Tucatinib over the concentration of 6 to 14μg/mL. The linearity plots were acquired by plotting peak response (on X-axis) vs. concentration (on Y-axis)10-11. The results of the linearity and calibration curve were represented in Table 4, and Fig-4.
Table None: 4: Data for Linearity of Tucatinib
| Concentration (μg/ml) | Average Peak Area |
|---|---|
| 6 | 1078475 |
| 8 | 1461129 |
| 10 | 1808358 |
| 12 | 2211573 |
| 14 | 2593778 |
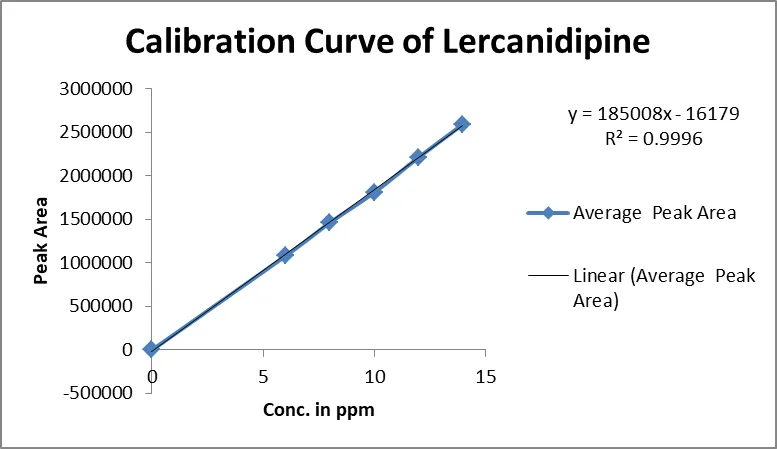
Figure None: 4: Linearity Curve of Tucatinib
Linearity Plot: The plot of Concentration (x) versus the Average Peak Area (y) data of Tucatinib is a straight line.
Y = mx + c
Slope (m) = 18500
Intercept (c) = 16179
Correlation Coefficient (r) = 0.999
Validation Criteria: The response linearity is verified if the Correlation Coefficient is 0.99 or greater.
CONCLUSION:
Correlation Coefficient (r) is 0.99, and the intercept is 0.16179. These values meet the validation criteria.
Precision:
The precision of an analytical procedure expresses the closeness of agreement (degree of scatter) between a series of measurements obtained from multiple sampling of the same homogeneous sample under the prescribed conditions12.
Repeatability: Obtained Six (6) replicates of 100% accuracy solution as per experimental conditions13. Recorded the peak areas and calculated % RSD and results were shown in table-5.
Table None: 5: Results of Repeatability for Tucatinib:
| S. No. | Peak name | Retention time | Area(µV*sec) | Height (µV) |
USP Plate Count | USP Tailing |
|---|---|---|---|---|---|---|
| 1 | Tucatinib | 2.293 | 1658954 | 186958 | 1.26 | 6785 |
| 2 | Tucatinib | 2.276 | 1658745 | 187548 | 1.27 | 6854 |
| 3 | Tucatinib | 2.286 | 1659865 | 189854 | 1.26 | 6852 |
| 4 | Tucatinib | 2.277 | 1653254 | 186985 | 1.25 | 6784 |
| 5 | Tucatinib | 2.280 | 1654781 | 189542 | 1.24 | 6895 |
| 6 | Tucatinib | 2.293 | 1661324 | 187586 | 1.28 | 6965 |
| Mean | 1657821 | |||||
| Std. Dev | 3120.433 | |||||
| %RSD | 0.188225 |
Intermediate Precision14:
Analyst1:
Table None: 6: Results of Intermediate Precision Analyst 1 for Tucatinib
| S.No. | Peak Name | RT | Area (µV*sec) | Height (µV) | USP Plate Count | USPTailing |
|---|---|---|---|---|---|---|
| 1 | Tucatinib | 2.274 | 1678541 | 186589 | 6587 | 1.26 |
| 2 | Tucatinib | 2.258 | 1685985 | 186598 | 6321 | 1.26 |
| 3 | Tucatinib | 2.267 | 1685745 | 186985 | 6385 | 1.25 |
| 4 | Tucatinib | 2.270 | 1685987 | 187854 | 6580 | 1.26 |
| 5 | Tucatinib | 2.264 | 1698526 | 187549 | 6721 | 1.27 |
| 6 | Tucatinib | 2.265 | 1685943 | 186598 | 6637 | 1.26 |
| Mean | 1686788 | |||||
| Std. Dev. | 6463.466 | |||||
| % RSD | 0.383182 |
Analyst 2:
Table None: 7: Results of Intermediate Precision Analyst 2 for Tucatinib
| S.No. | Peak Name | RT | Area (µV*sec) | Height (µV) | USPPlate count | USPTailing |
|---|---|---|---|---|---|---|
| 1 | Tucatinib | 2.277 | 1665847 | 167481 | 6854 | 1.25 |
| 2 | Tucatinib | 2.255 | 1658989 | 167854 | 6785 | 1.26 |
| 3 | Tucatinib | 2.265 | 1659845 | 167895 | 6854 | 1.24 |
| 4 | Tucatinib | 2.255 | 1665964 | 167854 | 6895 | 1.26 |
| 5 | Tucatinib | 2.253 | 1659863 | 168585 | 6459 | 1.25 |
| 6 | Tucatinib | 2.252 | 1665986 | 167859 | 6456 | 1.26 |
| Mean | 1662749 | |||||
| Std. Dev. | 3501.766 | |||||
| % RSD | 0.210601 |
Accuracy
Method accuracy15 was estimated at three variable concentrations of 50%, 100%, and 150% levels by spiking the known amount of the drug analytes. The % recovery16-18 at each level was calculated, and the findings were represented in Table 8.
Table None: 8: The Accuracy Results for Tucatinib
| %Concentration (at specification Level) |
Area | Amount Added (ppm) |
Amount Found (ppm) |
% Recovery | Mean Recovery |
|---|---|---|---|---|---|
| 50% | 109068.3 | 5 | 5.021 | 100.420% | 100.72% |
| 100% | 202187 | 10 | 10.054 | 100.540% | |
| 150% | 297032.3 | 15 | 15.181 | 101.206% |
Limit of Detection
The detection limit of an individual analytical procedure is the lowest amount of analyte in a sample which can be detected but not necessarily quantitated as an exact value19.
LOD= 3.3 × σ / s
Where
σ = Standard deviation20 of the response
S = Slope of the calibration curve
RESULT:
= 0.95µg/ml
Quantitation Limit
The quantitation limit of an individual analytical procedure is the lowest amount of analyte in a sample which can be quantitatively determined21.
LOQ=10×σ/S
Where
σ = Standard deviation of the response
S = Slope of the calibration curve22
RESULT:
= 2.9µg/ml
Robustness:
The robustness was performed for the flow rate variations from 0.9 ml/min to 1.1ml/min and mobile phase ratio variation from more organic phase to less organic phase ratio for Tucatinib23. The method is robust only in less flow condition. The standard of Tucatinib was injected by changing the conditions of chromatography. There was no significant change in the parameters like resolution, tailing factor, asymmetric factor, and plate count24.
Table None: 9: Results for Robustness of Tucatinib
| Parameter Used for Sample Analysis | Peak Area | Retention Time | Theoretical Plates | Tailing Factor |
|---|---|---|---|---|
| Actual Flow rate of 1.0 mL/min | 1658242 | 2.312 | 6569 | 1.24 |
| Less Flow rate of 0.9 mL/min | 1854215 | 2.458 | 6865 | 1.35 |
| More Flow rate of 1.1 mL/min | 1758468 | 2.032 | 6254 | 1.32 |
Stability Studies
The specificity of the method can be demonstrated by applying stress conditions using acid, alkaline, peroxide, thermal, UV, water degradations. The sample was exposed to these conditions the main peak of the drug was studied for peak purity that indicating the method effectively separated the degradation products from the pure active ingredient25-26. The results of Forced Degradation Studies for Tucatinib were shown in Table-10.
Table None: 10: Results of Forced Degradation Studies for Tucatinib
| S.No. | Stress Condition | Peak Area | % of Degraded Amount | % of Active Amount | Total % of Amount |
|---|---|---|---|---|---|
| 1 | Standard | 1658242 | 0 | 100% | 100% |
| 2 | Acidic | 1331734.15 | 19.69 | 80.31 | 100% |
| 3 | Basic | 1594233.85 | 3.86 | 96.14 | 100% |
| 4 | Oxidative | 1394747.34 | 15.89 | 84.11 | 100% |
| 5 | Thermal | 1575827.37 | 4.97 | 95.03 | 100% |
| 6 | Photolytic | 1345331.73 | 18.87 | 81.13 | 100% |
| 7 | Water | 1360090.08 | 17.98 | 82.02 | 100% |
SUMMARY AND CONCLUSION
The analytical method was developed by studying different parameters. First of all, maximum absorbance was found to be at 235nm and the peak purity was excellent. Injection volume was selected to be 10µl which gave a good peak area. The column used for study was Symmetry ODS C18 (4.6mm×250mm, 5µm) because it was giving good peak. Ambient temperature was found to be suitable for the nature of drug solution. The flow rate was fixed at 1.0ml/min because of good peak area and satisfactory retention time. Mobile phase is Methanol: Phosphate Buffer pH-3.6 in the ratio of 35:65% v/v was fixed due to good symmetrical peak. So this mobile phase was used for the proposed study. Methanol was selected because of maximum extraction sonication time was fixed to be 10.0min at which all the drug particles were completely soluble and showed good recovery. Run time was selected to be 8min because analyze gave peak around 2.257min and also to reduce the total run time. The percent recovery was found to be 98.0-102% was linear and precise over the same range. Both system and method precision was found to be accurate and well within range. The analytical method was found linearity over the range of 6-14ppm of the Tucatinib target concentration. The analytical passed both robustness and ruggedness tests. On both cases, relative standard deviation was well satisfactory.
REFERENCES

Nakerekanti Geetha, G. Kalyani, Vijaya Kuchana, Pasupuleti Sunitha, Analytical Method Development and Validation of a Stability Indicating RP-HPLC Method for the Determination of Tucatinib in Bulk Drug and Pharmaceutical Dosage Forms, Int. J. of Pharm. Sci., 2026, Vol 4, Issue 11, 3447-3457. https://doi.org/10.5281/zenodo.24387367
 10.5281/zenodo.24387367