
We use cookies to ensure our website works properly and to personalise your experience. Cookies policy
Department of Pharmaceutical Quality Assurance, Vidyabharati College of Pharmacy, Amravati, Maharashtra, India
An easy, fast, and reliable RP-HPLC method has been developed and validated for the quantitative estimation of Rimegepant in pharmaceutical dosage forms. The sample was separated through a C18 column (250 mm x 4.6 mm, 5 µm) at a flow rate of 1.0 ml/min, with a mobile phase consisting of methanol and 0.1% formic acid (75:25 v/v). The detection was done at a wavelength of 280 nm, while retention time was approximately 4.25 min. The developed method was validated as per ICH criteria of accuracy, precision, linearity, specificity, robustness, LOD, and LOQ. Good linearity was achieved by the method with respect to concentration range of 5-25 µg/mL with correlation coefficient (R²) value of 0.9999. Recovery percentage obtained from the method was between 98%-102%, while for precision studies %RSD values were less than 2%. Values of LOD and LOQ obtained were 1.53 µg/mL and 4.63 µg/mL, respectively. The method was found to be specific, robust, and suitable for routine quality control analysis of Rimegepant in pharmaceutical formulations.
Recurrent headache attacks are the hallmark of migraine, the most prevalent interdisciplinary and complex neurologic condition. There are two types of migraine: episodic and chronic, with or without aura. A typical migraine attack includes four phases: premonitory, aura, headache, and postdrome.[1,2] Symptoms commonly include unilateral throbbing pain, nausea, and sensitivity to light and sound. Diagnosis is typically based on medical history and clinical examination. Migraine affects about 15% of the general population, with a higher prevalence in women.[3,4,5]
Management involves both non-pharmacological and pharmacological approaches. Lifestyle modifications such as regular sleep, hydration, stress management, and exercise play a key preventive role. Acute treatment includes NSAIDs and triptans, while antiemetics are used as adjuncts. Preventive therapy is considered in frequent or severe cases. [6,7]
Calcitonin gene-related peptide (CGRP) is a 37-amino acid neuromodulating vasodilator that was first discovered in the trigeminovascular system in 1985. CGRP is produced in both peripheral and central neurons and is released during severe migraine episodes [8]. Calcitonin gene-related peptide (CGRP) has been shown to play a pivotal role in the pathophysiology of migraine and therefore offers a novel targeted approach for both the acute and preventive treatment of migraine [9]. Rimegepant is an oral CGRP receptor antagonist created by Biohaven Pharmaceuticals. It received FDA approval on February 27, 2020 for the acute treatment migraine headache, and was subsequently approved by the European Commission in April 2022 for both the treatment and prevention of migraines.[10,11,12] Recently it received CDSCO approval on February 27, 2025 for Acute treatment of migraine with or without aura in adults with a previous insufficient response to triptans.[13] Rimegepant is a small molecule calcitonin gene-related peptide (CGRP) receptor antagonist.[14] IUPAC name of Rimegepant is :- (5S,6S,9R)-5-amino-6-(2,3-difluorophenyl)-5H,6H,7H,8H,9H-cyclohepta[b]pyridin-9-yl4-{2-oxo-1H,2H,3H-imidazo[4,5-b]pyridine-1yl}piperidine-1carboxylate.[15]
The Chemical Structure of Rimegepant is as shown in fig 1.
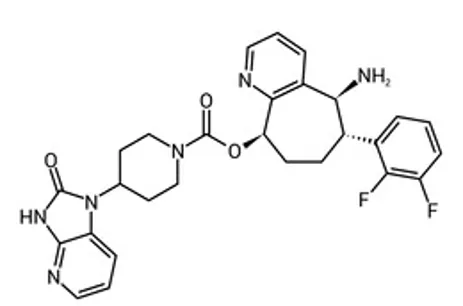
Figure 1:- Chemical Structure of Rimegepant
2. MATERIAL AND METHODS
2.1 Reagent and chemicals
Rimegepant API (purity>99.99%) was received as gift sample from Reliable’s Shree Industrial Training Centre and research labolatory, Jalgaon (MH). Other reagent such as Methanol[CH3OH], Formic acid [CH2O2], Water [HPLC grade] were purchased from the Merck life science pvt ltd [INDIA]. All reagent used for analysis were analytical grade.
2.2 Instruments
Table 1 : Instruments Used In Method Development
|
Sr. No. |
Name of Instrument |
Model |
|
1. |
HPLC System |
AGILENT (1100) |
|
2. |
Detector System |
Deuterium lamp (UV Detector) |
|
3. |
Analytical Column |
C18 (4.6 x250 mm, 5um) |
|
4. |
Software |
CHEMSTATION-32 |
|
5. |
pH Meter |
VSI pH meter |
|
6. |
Injector |
Auto Injector |
|
7. |
Analytical Balance |
WENSARTM High Resolution Balance |
|
8. |
UV Spectrophotometer |
Analytical Technology (2080) |
2.3 preparation of 0.1% formic acid
A 0.1% formic acid solution was prepared by accurately measuring 1.0 mL of formic acid and transferring it into a 1000 mL volumetric flask. The volume was then made up to the mark with HPLC-grade water
2.4 preparation of standard solution
Accurately weighed 5 mg of Rimegepant was transferred to a 50 ml volumetric flask, dissolved in 10ml methanol to obtain a concentration of 500 µg/ml, and sonicated for 2 minutes to ensure complete dissolution.
2.5 sample preparation
Accurately weighed 5 mg of Rimegepant was transferred to a 50 ml volumetric flask, dissolved in 10ml methanol to obtain a concentration of 500 µg/ml, and sonicated for 2 minutes to ensure complete dissolution. From this solution 0.1, 0.2, 0.3, 0.4 & 0.5 ml was taken and transfer to 10 ml of volumetric flask and make up the volume by methanol (mobile phase) to get 5, 10, 15, 20 & 25 µg/ml concentration respectively. These solutions were used for calibration curve preparation.
2.6 marketed tablet preparation
for marketed tablet preparation we prepare lab solution. We get estimate weight of tablet (ie. 95 mg weight for 1 tablet). Twenty tablets were weighed and average weight was calculated. Powder equivalent to 6.33 mg of Rimegepant was transferred into a 50 ml volumetric flask, dissolved in 10 ml methanol, (ie. 600 µg/ ml Rimegepant stock II) and sonicated for 15 minutes to ensure complete extraction of drug.
2.7 assay preparation
An aliquot of 0.3 ml from stock solution II was diluted up to 10 ml with mobile phase for assay determination. The prepared solutions were filtered before injection to avoid particulate interference.
2.8 Chromatographic condition
The following chromatographic conditions were established by trial and error and were kept constant throughout the experimentation
Table 2: Chromatographic Condition
|
HPLC |
AGILENT (1100) with auto sampler |
|
Software |
CHEMSTATION-32 |
|
Column |
id 4.6 X 250 mm length |
|
Particle size packing |
5 mm |
|
Stationary phase |
C-18 (AGILENT) |
|
Mobile Phase |
Methanol : 0.1 % Formic Acid (ph 2.8) 75 : 25 |
|
Detection Wavelength |
280nm |
|
Flow rate |
1.0 ml/min |
|
Temperature |
250C |
|
Sample size |
20 ml |
3. VALIDATION OF DEVELOPED METHOD
After developing the RP-HPLC method, validation was carried out to confirm the suitability of the method for its intended purpose. The validation of the developed method for Rimegepant was performed as per ICH guidelines.
The following parameters were evaluated:
A. Accuracy
Accuracy is defined as the closeness of agreement between the true value and the value found. It is also referred to as trueness. In this study, accuracy was determined by injecting known
concentrations of the drug at different levels and calculating the mean peak area. The standard deviation and %RSD were calculated.
Acceptance Criteria: The percentage relative standard deviation (%RSD) should be not more than 2%.
B. Precision
Precision of the method was evaluated by intraday and interlay studies. In intraday precision, the sample solution was injected multiple times within the same day, while interday precision was performed on different days. The peak areas were recorded and %RSD was calculated.
Acceptance Criteria: RSD of the mean concentration of replicate readings should be NMT 2%.
C. Recovery Studies:
Recovery studies were carried out by spiking known amounts of standard drug into the pre-analysed sample. The concentration obtained was compared with the added amount to calculate % recovery.
Acceptance Criteria: For assay method, mean recovery should be in the range of 98–102%.
D. Linearity
Linearity was established by preparing standard solutions of Rimegepant in the concentration range of 5–25 µg/ml. A calibration curve was plotted between concentration (x-axis) and peak area (y-axis).
Acceptance Criteria: The correlation coefficient (r²) should be not less than 0.995.
E. Limit of Quantification (LOQ)
LOQ is the lowest concentration of analyte that can be quantitatively determined with acceptable precision and accuracy.
LOQ = 10 × SD / Slope
Acceptance Criteria: Signal-to-noise ratio should be approximately 10:1.
F. Limit of Detection (LOD)
LOD is the lowest concentration of analyte that can be detected but not necessarily quantified.
LOD = 3.3 × SD / Slope
Acceptance Criteria: Signal-to-noise ratio should be approximately 3:1.
G. Specificity
Specificity of the method was evaluated by comparing chromatograms of standard and sample. No interference was observed at the retention time of Rimegepant, confirming specificity of the method
Acceptance Criteria: No interference at retention time and peak purity should be acceptable.
H. Robustness
Robustness was studied by making small deliberate changes in chromatographic conditions such as: Flow rate (±1%) ,Wavelength (±1 nm). The effect on peak area and retention time was observed.
Acceptance Criteria: Deviation in results should be less than 2%.
I. System Suitability Studies:
System suitability studies were performed to confirm the adequacy and reliability of the chromatographic system prior to analysis. Various parameters, including column efficiency (theoretical plates), resolution, capacity factor, tailing factor, and repeatability (%RSD), were evaluated by repeated injections of standard solutions. The results obtained were compared with established acceptance criteria to ensure consistent system performance. These studies were conducted in compliance with USP guidelines.
4. RESULTS AND DISCUSSION
4.1 HIGH PERFORMANCE LIQUID CHROMATOGRAPHY:
A reverse-phase high-performance liquid chromatographic (RP-HPLC) method was developed and validated for the estimation of Rimegepant. Various chromatographic parameters were systematically optimized to obtain a sharp, well-resolved peak with good symmetry and reproducibility. The standard solution was prepared and analyse under optimized conditions, and the chromatograms were recorded. The developed method was found to be simple, precise, and suitable for the quantitative analysis of Rimegepant.
4.2 OPTIMIZATION OF CHROMATOGRAPHIC CONDITIONS
1. Selection of Wavelength:
The selection of detection wavelength plays a significant role in determining the sensitivity of the analytical method. The UV spectrum of Rimegepant was scanned over a suitable wavelength range to identify the wavelength of maximum absorbance. Based on the spectral analysis, 280 nm was selected as the detection wavelength, as the drug exhibited adequate absorbance at this wavelength. This ensured reliable detection and consistent analytical performance.
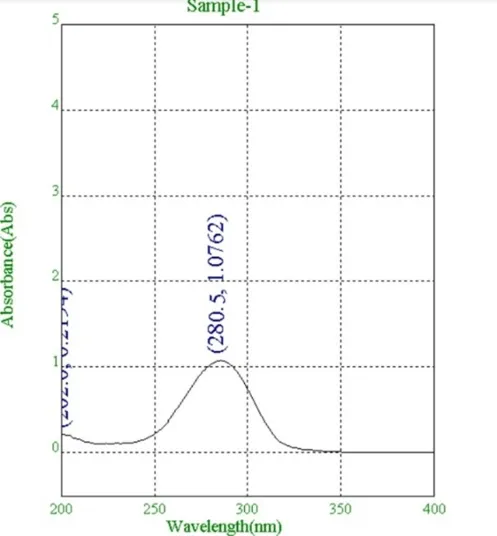
Figure 2: UV Spectrum of Rimegepant
2. Method development
Various combinations of methanol and 0.1% Formic Acid (ph 2.8) were evaluated in different ratios. Such as (90:10), (85:15), (80:20), (75:25) (70:30) and (60:40). Among these, Methanol : 0.1% Formic Acid (ph 2.8) (75:25 v/v) was found to be most suitable at flow rate 1.0 ml/min as it produced a sharp, symmetrical peak with good resolution and acceptable retention time. The selected mobile phase also minimized peak tailing and improved system performance.
Chromatogram:
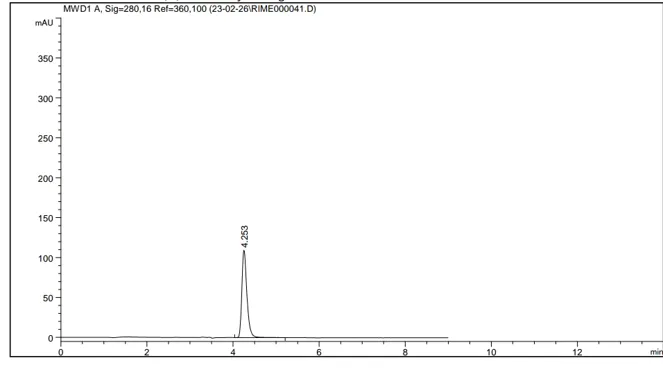
Figure 3: Chromatogram for Rimegepant
4.3 METHOD VALIDATION:
1. ACCURANCY:
For the accuracy studies, samples were created at three different concentration levels: Low (80%), Medium (100%) and High (120%). The concentration of each injection was determined, and the standard deviation among the measurements was computed. (16)
Chromatogram:
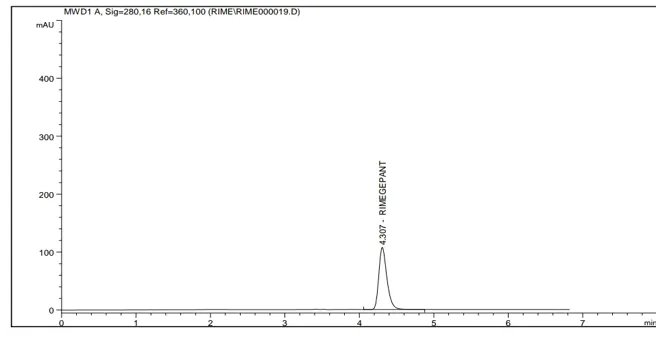
Figure 4 : Chromatogram Of Rimegepant Accuracy At 80%
Table 3: Drug Accuracy Studies of Rimegepant (80%)
|
Sr. No. |
Concentration (µg/ml) |
Amount added |
Area |
Amount found |
Amount recovered |
% Recovery |
|
1 |
5 |
4 |
853.49 |
9.00 |
4.00 |
99.90 |
|
2 |
5 |
4 |
854.50 |
9.01 |
4.01 |
100.16 |
|
|
|
|
Mean |
9.00 |
4.00 |
100.03 |
|
|
|
|
SD |
0.007 |
0.007 |
0.19 |
|
|
|
|
%RSD |
0.083 |
0.186 |
0.19 |
Chromatogram:

Figure 5: Chromatogram Of Rimegepant Accuracy At 100%
Table 4: Drug Accuracy Studies of Rimegepant (100%)
|
Sr. No. |
Concentration (µg/ml) |
Amount added |
Area |
Amount found |
Amount recovered |
% Recovery |
|
1 |
5 |
5 |
946.86 |
9.960 |
4.960 |
99.21 |
|
2 |
5 |
5 |
950.63 |
9.999 |
4.999 |
99.99 |
|
|
|
|
Mean |
9.98 |
4.98 |
99.60 |
|
|
|
|
SD |
0.028 |
0.028 |
0.55 |
|
|
|
|
%RSD |
0.277 |
0.554 |
0.55 |
Chromatogram:
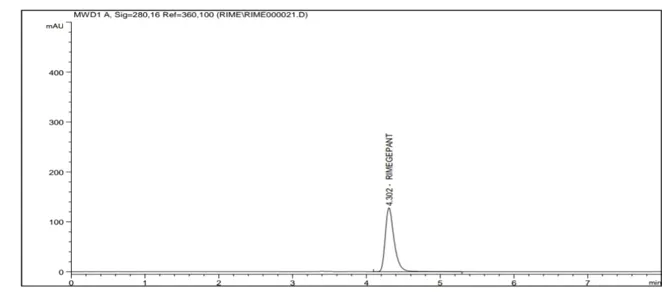
Figure 6: Chromatogram of Rimegepant Accuracy At 120%
Table 5 : Drug Accuracy Studies of Rimegepant (120%)
|
Sr. No. |
Concentration (µg/ml) |
Amount added |
Area |
Amount found |
Amount recovered |
% Recovery |
|
1 |
5 |
6 |
1086.074 |
11.038 |
6.038 |
100.64 |
|
2 |
5 |
6 |
1084.54 |
11.022 |
6.022 |
100.38 |
|
|
|
|
Mean |
11.03 |
6.03 |
100.51 |
|
|
|
|
SD |
0.011 |
0.011 |
0.19 |
|
|
|
|
%RSD |
0.102 |
0.186 |
0.19 |
Remark: % Mean recovery of Rimegepant observed within acceptance criteria, also % RSD of recovery observed within acceptance criteria; hence accuracy is justified.
2. PRECISION:
Precision can be determined by two types:
1. Intraday precision
2. Interday precision
The preparation was injected into HPLC three times and mean peak area was calculated separately for each concentration and from that precision percentage RSD values were calculated and shown in tables.
Chromatogram:
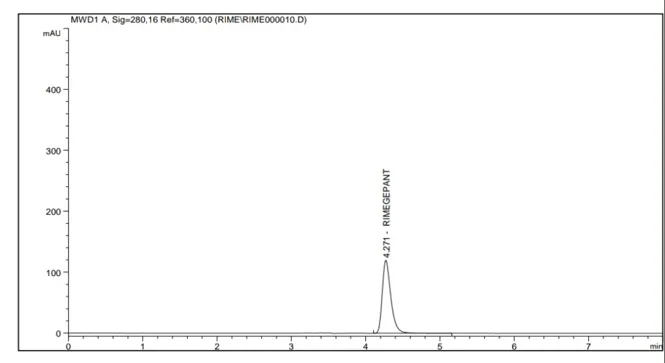
Figure 7 : chromatogram of Rimegepant intra-day precision
Table 7 : Intra-day Precision Data of Rimegepant
|
Drug name: Rimegepant |
|||||
|
Sr. No. |
Concentration (µg) |
Area |
Average |
SD |
%RSD |
|
1 |
10 |
963.2721 |
966.32 |
4.31 |
0.45 |
|
10 |
969.3697 |
||||
|
2 |
15 |
1437.757 |
1440.84 |
4.36 |
0.30 |
|
15 |
1443.742 |
||||
|
3 |
20 |
1950.536 |
1947.14 |
4.80 |
0.25 |
|
20 |
1943.742 |
||||
|
|
Range of %RSD |
0.25 - 0.45 |
|||
Chromatogram:
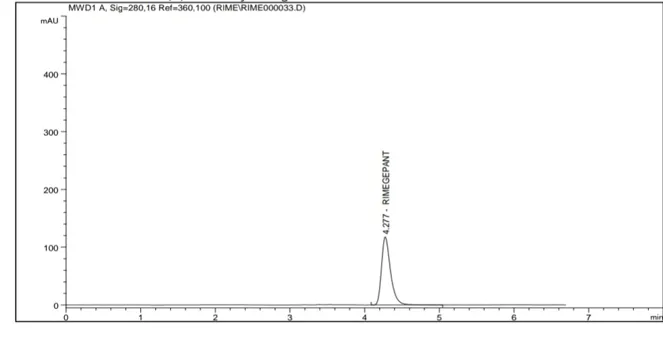
Figure 8: chromatogram of Rimegepant inter-day precision
Table 8 : Inter-day Precision Data of Rimegepant
|
Drug name: Rimegepant |
|||||
|
Sr. No. |
Concentration |
Area |
Average |
SD |
%RSD |
|
DAY 1 |
10 |
969.271 |
966.01 |
4.61 |
0.48 |
|
10 |
962.756 |
||||
|
DAY 2 |
15 |
1439.307 |
1454.681 |
21.75 |
1.49 |
|
15 |
1470.055 |
||||
|
DAY 3 |
20 |
1953.917 |
1954.01 |
0.14 |
0.01 |
|
20 |
1954.11 |
||||
|
|
Range of %RSD |
0.01 – 1.49 |
|||
Remark:
Overall %RSD for result of repeated analysis was found within acceptance criteria. Hence, the developed method is precise in terms of intraday and inter-day analysis.
3. LINEARITY
The drug's peak regions were identified in the chromatograms of linearity standards with concentrations of 5, 10, 15, 20, and 25 µg ml, which were recorded. Peak Area vs. concentration of the Rimegepant Linearity standards was used to plot the linearity curve for the drug. Figure 9 displayed the Rimegepant Linearity standards chromatogram. (16)
Figure 9 : Linearity Curve Of Rimegepant
The correlation coefficient of Rimegepant was found to be 0.9999, which was within acceptable limits. The calibration curve plotted was found to be linear and showed that the method has adequate sensitivity to the concentration (5-25 µg/ml) of the drug. Finally, the data obtained in this study was within limits. The coefficient of correlation of Rimegepant was found to be 0.9999.
Table 9 : Linearity Standard Peak
|
Level |
Conc.(ppm or ug/ml) |
Area |
|
1 |
5 |
466.42 |
|
2 |
10 |
941.96 |
|
3 |
15 |
1439.37 |
|
4 |
20 |
1923.179 |
|
5 |
25 |
2409.80 |
|
|
Correlation coefficient (NLT 0.995) |
R2=0.9999 |
|
|
intercept |
24.04c |
|
|
slope |
53.05m |
Remark: Correlation coefficient observed within acceptance criteria; hence method is linear and linearity is justified.
4. ROBUSTNESS
Robustness was performed by making deliberate changes in chromatographic conditions to evaluate the effect of variations in mobile phase composition and wavelength. In this study, the mobile phase composition was varied slightly, and wavelength was changed by ±1 nm. These variations were evaluated to observe their effect on the chromatographic response. No significant changes were observed in the results due to these variations. However, slight changes were noticed in some system suitability parameters.
Table 10 : Robustness Change In Parameter For Rimegepant
|
Mobile phase |
|
Mobile phase |
||||
|
74+26 |
|
76+24 |
||||
|
Sr No. |
Concentration (µgm/ml) |
Area |
|
Sr No. |
Concentration (µgm/ml) |
Area |
|
1 |
10 |
956.72 |
|
1 |
10 |
920.89 |
|
2 |
10 |
957.5 |
|
2 |
10 |
920.12 |
|
|
Mean |
957.1 |
|
|
Mean |
920.51 |
|
|
SD |
0.55 |
|
|
SD |
0.54 |
|
|
%RSD |
0.06 |
|
|
%RSD |
0.06 |
|
|
|
|
|
|
|
|
|
Wave length change |
|
Wave length change |
||||
|
297 |
|
281 |
||||
|
Sr No. |
Concentration (µgm/ml) |
Area |
|
Sr No. |
Concentration (µgm/ml) |
Area |
|
1 |
10 |
1010.4 |
|
1 |
10 |
952.64 |
|
2 |
10 |
1016.23 |
|
2 |
10 |
962.43 |
|
|
Mean |
1013.3 |
|
|
Mean |
957.54 |
|
|
SD |
4.13 |
|
|
SD |
6.92 |
|
|
%RSD |
0.4 |
|
|
%RSD |
0.72 |
Remark: The robustness study results showed that the %RSD values for all variations in mobile phase composition and wavelength were found to be within acceptable limits (NMT 2%). No significant variation in peak area was observed due to these small deliberate changes, indicating that the developed method is robust and reliable.
5. RUGGEDNESS:
Ruggedness of the analytical method was evaluated by making small variations in different conditions such as analyst and instrument to study their effect on the method performance.
Ruggedness was studied for Rimegepant and the results obtained are presented in the following table 11.
In this study, the analysis was carried out by different analysts and/or using different instruments. The effect of these variations was evaluated on the chromatographic response. No significant changes were observed in the results due to these variations.
Table 11 : Ruggedness Change In Parameter For Rimegepant
|
Sr. No. |
Analyst |
Conc (ug/ml) |
Peak Area |
|
1 |
Analyst 1 |
10ml |
949.18 |
|
2 |
Analyst 2 |
10m1 |
951.51 |
|
|
Mean |
|
950.35 |
|
|
SD |
|
1.648 |
|
|
%RSD |
|
0.173 |
Remark: The %RSD values for peak area, amount found, and % label claim were found to be within acceptable limits (NMT 2%), indicating that the method is reproducible and rugged under different conditions such as change in analyst.
6. LOWER LIMIT OF DETECTION (LOD) AND LOWER LIMIT OF QUANTIFICATION (LLOQ):
The LOD is defined as the lowest concentration of the analyte (Rimegepant) that produces a measurable response, whereas the LLOQ is the lowest concentration of Rimegepant that can be quantitatively determined with acceptable accuracy and precision.
In the present study, the LOD and LLOQ for Rimegepant were determined based on the calibration curve using the standard deviation of the response and the slope of the regression line.
The formula used are:
LOD = 3.3 × (σ / S)
LOQ = 10 × (σ / S)
Where,
σ = standard deviation (Average SD)
S = slope of the calibration curve
The regression equation obtained for Rimegepant was Y = 96.81X -17.42 − 0.9999 with a correlation coefficient (R²) of 0.9999, indicating excellent linearity.
The signal-to-noise ratio was also evaluated using low concentration samples of Rimegepant by comparing the analytical signal with the baseline noise.
The LOD and LLOQ values for were found to be 1.53 µg/ml and 4.63 µg/ml, respectively, indicating that the developed method is sensitive enough for the detection and quantification of Rimegepant at low concentration levels.
7. SPECIFICITY
Specificity is the ability of an analytical method to accurately measure the analyte in the presence of other components such as impurities, degradation products, excipients, and matrix components without any interference. It ensures that the response obtained is solely due to the analyte of interest.
In chromatographic techniques like RP-HPLC, specificity is demonstrated by analysing blank, standard, placebo, and sample solutions to confirm that there are no interfering peaks at the retention time of the analyte. A specific method provides reliable and accurate results, making it suitable for the quantitative analysis of pharmaceutical formulations and ensuring the purity and identity of the analyte.
Table 12: Specificity Data of standard solution
|
Sr. No |
Concentration (µg/ml) |
Area |
Rt (Min) |
|
1 |
10 |
950.567 |
4.254 |
|
2 |
10 |
948.246 |
4.254 |
8. SYSTEM SUITABILITY:
It was concluded that the parameters fall within the prescribed limits. The system suitability (performance) was checked by parameters like the number of theoretical plates (column efficiency), resolution factor, tailing factor, peak asymmetry factor, and % R.S.D (relative standard deviation). The parameters of the optimized method were found to be well within limits. The suitability of system was checked by injecting standard Rimegepant repeatedly (trial injections). This study gave the reproducible results with an effective chromatographic separation. The system suitability parameters have been tabulated (Table 13). This parameter were found to be well within the prescribed limits. (17)
Chromatogram:
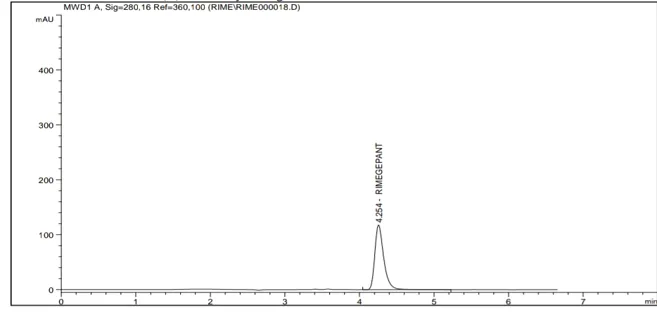
Figure 10: chromatogram of system suitability of Rimegepant
Table 13: System Suitability of Rimegepant
|
Sr no |
Parameter |
Injection 1 |
Injection 2 |
Mean |
SD |
%RSD |
Acceptance Criteria |
|
1 |
Retention time(time) |
4.254 |
4.254 |
4.254 |
- |
- |
consistent |
|
2 |
Peak area (mAUs) |
950.25 |
958.24 |
954.24 |
5.65 |
0.59 |
NMT 2% |
|
3 |
Peak height (mAU) |
117.90 |
117.90 |
- |
- |
- |
- |
|
4 |
Theoretical plates (N) |
6662 |
5972 |
- |
- |
- |
NLT 2000 |
|
5 |
Tailling factors (T) |
0.99 |
0.99 |
0.99 |
- |
- |
NMT 2.0 |
Remark: Theoretical plates and tailing factor were observed within the acceptance criteria, and the %RSD of replicate injections for area and retention time was found to be within the acceptable limit, indicating good system suitability and precision.
9. MARKETED SAMPLE ANALYSIS:
Trade Name: Nurtec ODT(USA), Vydura (oral lyophilizate)(EU)
Manufacturer: Pfizer pvt. ltd
Content: 75 mg
Average Tablet Weight: 6.33mg
The RP-HPLC method was developed successfully apply for the analysis of marketed pharmaceutical dosage form as shown in fig 11 & 12.
Chromatogram:
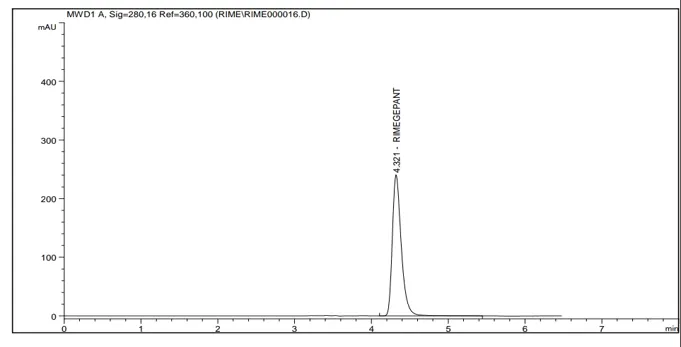
Figure 11:- Test Solution 1 (Marketed Prep.) Chromatogram
Chromatogram:
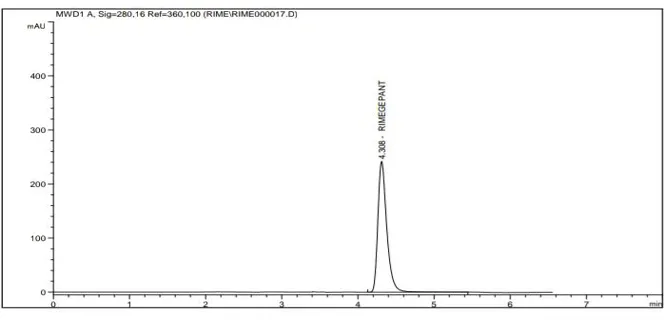
Figure 12:- Test Solution 2 (Marketed Prep.) Chromatogram
Table 14: Marketed Test Sample Result
|
Name |
Area |
RT(min) |
Rimegepant in mg |
% Lable claim |
|
Test solution 1 |
1924.622 |
4.321 |
20mg |
100.30 |
|
Test solution 2 |
1924.825 |
4.308 |
20mg |
100.75 |
|
Mean |
1924.72 |
- |
- |
100.53 |
|
SD |
0.144 |
- |
- |
0.319 |
|
%RSD |
0.007 |
- |
- |
0.317 |
5. CONCLUSION:
A rapid, simple, and user-friendly RP-HPLC method was developed and validated for the determination of Rimegepant in pharmaceutical dosage form. All the validation parameters such as accuracy, precision (intra-day and inter-day), linearity, robustness, LOD, and LOQ were found to be within acceptable limits as per ICH guidelines. The method showed good linearity over the selected concentration range with a high correlation coefficient (r² = 0.9999), indicating reliable performance for quantitative analysis. The developed method also demonstrated good reproducibility and precision. Hence, the method is suitable for routine estimation of Rimegepant in pharmaceutical dosage forms.
6. ACKNOWLEDGEMENT
We are thankful to Reliable’s Shree Industrial Training Centre and research laboratory , Jalgaon (MH) for providing gift sample of Rimegepant API. We are also thankful for Vidyabharati College of Pharmacy, Amravati, for providing infrastructure and facility to carry out present work.
REFERENCES


Bhashkar Ingle, Vijay Waghulkar, Monika Jadhao, S. G. Jawarkar, Analytical Method Development and Validation of Rimegepant by Using RP-HPLC, Int. J. of Pharm. Sci., 2026, Vol 4, Issue 6, 5744-5758. https://doi.org/10.5281/zenodo.20801294
 10.5281/zenodo.20801294