
We use cookies to ensure our website works properly and to personalise your experience. Cookies policy
R.G Sapkal College of Pharmacy, Sapkal Knowledge Hub, Kalyani Hills, Anjaneri, Trimbakeshwar Rd, Nashik, 422213, Maharashtra, India
Continuous Process Verification (CPV) represents a paradigm shift in pharmaceutical manufacturing quality assurance, transitioning the industry from traditional retrospective end-product testing towards prospective, real-time process monitoring and control throughout the entire product lifecycle. This comprehensive review examines the conceptual foundations, regulatory underpinnings, and practical implementation of CPV within the three-stage lifecycle validation model as articulated in the United States Food and Drug Administration (FDA) Process Validation Guidance (2011) and aligned with the International Council for Harmonisation of Technical Requirements for Pharmaceuticals for Human Use (ICH) guidelines Q8, Q9, Q10, and Q11.The review systematically addresses the identification and monitoring of Critical Quality Attributes (CQAs) and Critical Process Parameters (CPPs), the development and deployment of scientifically sound control strategies, and the application of advanced statistical methodologies including Statistical Process Control (SPC), process capability analysis, and multivariate data analysis. The integration of Process Analytical Technology (PAT) as an enabling platform for real-time release testing and enhanced process understanding is discussed in depth, along with the growing role of digital transformation, artificial intelligence, and machine learning in augmenting CPV capabilities.Dosage form-specific CPV considerations are examined across oral solid dosage forms, sterile and parenteral products, biologics, and continuous manufacturing platforms. The review also addresses significant organisational, technical, and regulatory challenges that impede effective CPV implementation, drawing upon published industry case studies and regulatory inspection findings. The paper concludes with a forward-looking perspective on harmonised global regulatory standards, adaptive manufacturing, and the evolving role of CPV in supporting personalised medicine and novel therapeutic modalities. Collectively, the evidence underscores CPV as an indispensable pillar of modern pharmaceutical quality systems, enabling proactive risk management, sustained product quality, and ultimate protection of patient safety.
The pharmaceutical manufacturing sector has undergone a profound quality revolution over the past two decades, driven by regulatory imperatives, technological advances, and an ever-deepening scientific understanding of complex manufacturing processes.1,2
Historically, quality assurance in pharmaceutical manufacturing was anchored in end-product testing a retrospective paradigm in which batches were released or rejected based on the outcomes of analytical tests conducted after manufacture was complete. This approach, while providing a degree of quality gatekeeping, offered limited insight into the manufacturing process itself and was inherently reactive, unable to prevent the generation of non-conforming product.3,4
The conceptual shift towards process understanding and control was catalysed by the FDA's landmark 2004 initiative, 'Pharmaceutical CGMPs for the 21st Century: A Risk-Based Approach,' which called upon the industry to adopt modern science and engineering tools to improve manufacturing processes and quality systems.5
Continuous Process Verification (CPV), also referred to as Continued Process Verification in the FDA context, emerged as the third and ongoing stage of the process validation lifecycle a stage dedicated to the continuous collection and evaluation of process and product data during routine commercial manufacturing. The overarching goal of CPV is to provide scientific evidence that the manufacturing process remains in a state of control throughout the commercial lifecycle of the product.6,7
ICH Q10 defines the Pharmaceutical Quality System (PQS) as a comprehensive management system for the pharmaceutical industry that incorporates Good Manufacturing Practice (GMP) concepts and includes a commitment to product lifecycle management, continuous improvement, and knowledge management.8
CPV is distinct from traditional Process Validation in that it is not a finite activity with a defined start and end point, but rather a sustained, systemic effort that persists throughout the commercial life of the product. While Process Performance Qualification (PPQ) provides initial evidence of process consistency, CPV furnishes continued assurance by monitoring a defined set of parameters and attributes over time, enabling the early detection of process drift, identification of trends, and facilitation of continuous improvement initiatives.9,10
The present review aims to provide a comprehensive synthesis of the scientific literature, regulatory guidance, and industry practice pertaining to CPV in pharmaceutical manufacturing. The scope encompasses the regulatory framework, the three-stage lifecycle approach, statistical and analytical tools, dosage-form-specific considerations, challenges, and future perspectives. This paper is intended to serve as a reference resource for pharmaceutical scientists, quality professionals, and regulatory affairs practitioners seeking a rigorous understanding of CPV theory and application.11
2. REGULATORY FRAMEWORK AND GUIDANCE DOCUMENTS:
2.1 International Guidelines
The ICH guidelines form the foundational scaffold upon which modern CPV programmes are constructed. ICH Q8(R2) introduced the concept of pharmaceutical development as a systematic approach to designing products and manufacturing processes to consistently deliver the intended performance.12
ICH Q8 also formalised the concept of the Design Space the multidimensional combination and interaction of input variables and process parameters that have been demonstrated to provide assurance of quality. Operations within the design space are not considered changes and do not require regulatory notification; this latitude provides the manufacturer with operational flexibility underpinned by demonstrated process understanding.12,13
ICH Q9 introduced a structured Quality Risk Management (QRM) framework, providing tools and methodologies for the systematic assessment, control, communication, and review of risks to the quality of drug substances and drug products. QRM principles are integral to CPV programme design, informing decisions about which parameters to monitor, at what frequency, and to what degree of statistical rigour.14
ICH Q10 provides the conceptual framework for the Pharmaceutical Quality System (PQS), emphasising lifecycle management, knowledge management, and continuous improvement. It explicitly identifies CPV as one of the key elements of the PQS, alongside pharmaceutical development, technology transfer, manufacturing, and product discontinuation.8
ICH Q11 extends the lifecycle approach to drug substances, addressing the development and manufacture of active pharmaceutical ingredients with a focus on identifying sources of variability, establishing control strategies, and defining the scope of process validation activities.15
2.2 Regional Regulatory Requirements
The FDA's 2011 Process Validation Guidance represented a watershed moment in pharmaceutical regulatory practice, replacing the decades-old three-batch validation paradigm with a scientifically rigorous, lifecycle-based model comprising three stages: Process Design (Stage 1), Process Performance Qualification (Stage 2), and Continued Process Verification (Stage 3).6
The European Medicines Agency (EMA) guideline on process validation for finished products similarly embraces the lifecycle concept, requiring manufacturers to implement an ongoing programme for the collection and evaluation of process and product data to demonstrate that the process remains in a state of control. The EMA guidance additionally emphasises the use of statistical tools for trend analysis and the integration of CPV data into annual product quality reviews.16
The World Health Organisation (WHO) technical guidelines on pharmaceutical process validation also align with the lifecycle approach, extending these principles to manufacturers in lower-income countries operating within the context of WHO prequalification programmes.17
Table 1: Comparison of Major Regulatory Guidance Documents for CPV
|
Regulatory Body |
Document |
Year |
Key CPV Requirements |
|
FDA (USA) |
Process Validation Guidance |
2011 |
Three-stage lifecycle model; Stage 3 CPV mandatory; statistical approach required |
|
EMA (Europe) |
Guideline on Process Validation |
2014 |
Ongoing verification programme; integration with APQR; statistical trending |
|
ICH |
Q8, Q9, Q10, Q11 |
2005–2012 |
Design space; risk management; PQS lifecycle; CPV as PQS element |
|
WHO |
Technical Report Series No. 992 |
2016 |
Lifecycle approach; risk-based monitoring; knowledge management |
|
Health Canada |
Guidance on Process Validation |
2012 |
Aligned with FDA/EMA; lifecycle approach; statistical tools required |
2.3 Regulatory Expectations for CPV
Regulatory agencies expect CPV programmes to be scientifically justified, risk-based, and capable of providing objective statistical evidence of a state of control. A robust CPV programme must include a clearly defined monitoring strategy with pre-specified acceptance criteria, documented procedures for data collection and analysis, and a defined escalation pathway for out-of-trend or out-of-specification results.6,18
During regulatory inspections, auditors routinely evaluate the maturity and effectiveness of CPV programmes. Common deficiencies identified in Form 483 observations and warning letters include the absence of a formal CPV programme, reliance on subjective trending without statistical foundations, failure to investigate signals identified through monitoring, and inadequate integration of CPV findings into the quality management system.19,20
3. The Pharmaceutical Lifecycle Approach to Process Validation
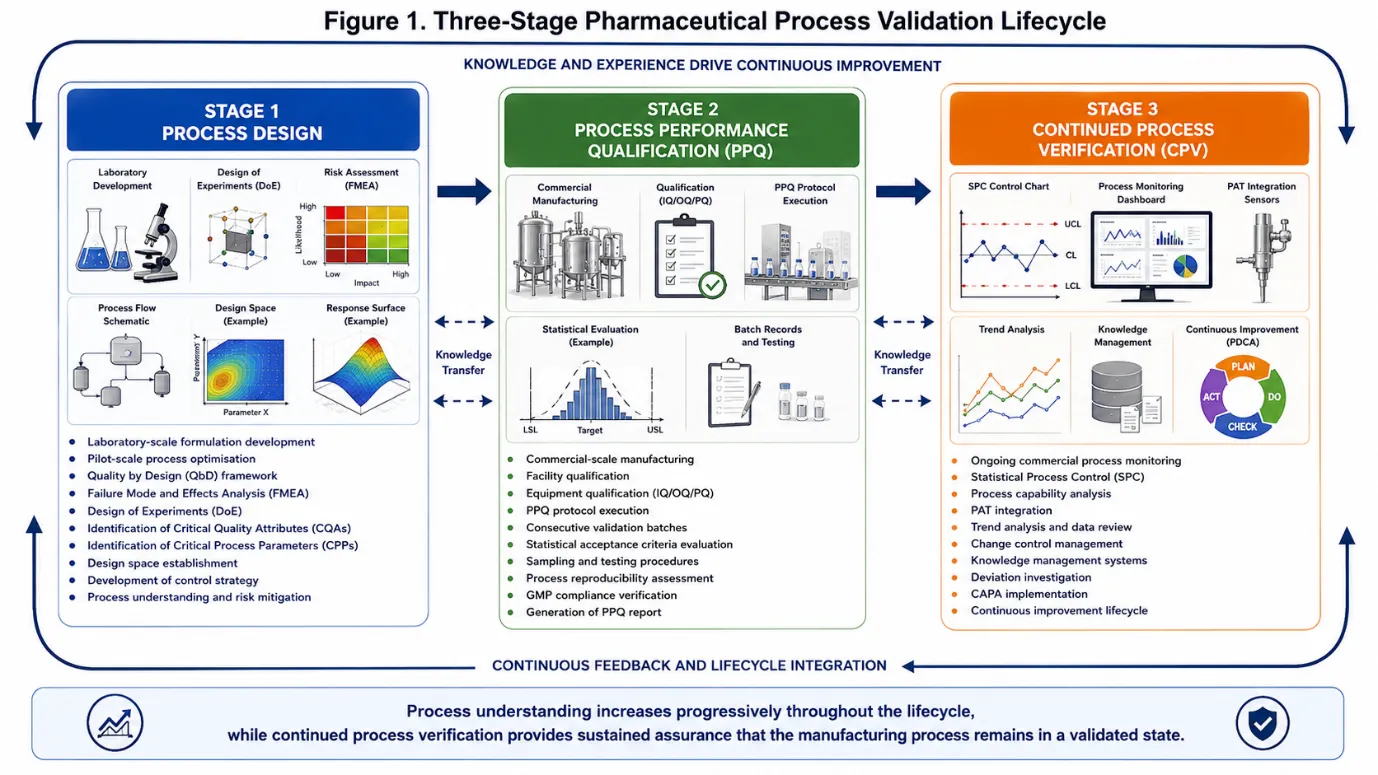
Figure 1: Three-Stage Pharmaceutical Process Validation Lifecycle
3.1Stage 1: Process Design
Stage 1 constitutes the knowledge-generation phase of the validation lifecycle. During this stage, process knowledge is accumulated through a systematic programme of development studies, risk assessments, and multivariate experiments designed to elucidate the relationships between material attributes, process parameters, and product quality.21
Quality by Design (QbD), as codified in ICH Q8, provides the overarching scientific framework for Stage 1 activities. The QbD approach begins with the definition of a Quality Target Product Profile (QTPP) a prospective summary of the quality characteristics of a drug product that ideally will be achieved to ensure the desired quality, taking into account safety and efficacy. The QTPP informs the identification of CQAs and, subsequently, CPPs.12,22
Risk assessment tools, including Failure Mode and Effects Analysis (FMEA), fishbone (Ishikawa) diagrams, and risk ranking and filtering, are employed to systematically evaluate the potential impact of process variability on product quality. Design of Experiments (DoE) methodologies including full factorial, fractional factorial, central composite, and Box-Behnken designs are utilised to characterise the design space and establish Proven Acceptable Ranges (PARs) for critical and key process parameters.23,24
3.2 Stage 2: Process Performance Qualification
Stage 2 provides confirmation that the process design established in Stage 1 can be reproducibly executed at commercial manufacturing scale. The PPQ protocol must be approved prior to manufacturing the PPQ batches and must specify the process parameter ranges to be used, the sampling plan, the analytical methods to be employed, and the pre-defined acceptance criteria against which the data will be evaluated.6,25
The number of PPQ batches required should be justified statistically; regulatory guidance indicates that the number should be sufficient to demonstrate process consistency and to enable meaningful statistical analysis. A minimum of three batches has historically been cited, but this may be insufficient for processes with inherent high variability or limited development data. Bayesian approaches and confidence interval analyses are increasingly employed to justify batch numbers on scientific rather than historical grounds.26,27
3.3 Stage 3: Continued Process Verification
Stage 3 CPV is the sustained, lifecycle-long phase during which routine commercial manufacturing data are collected, statistically analysed, and reviewed to confirm that the process remains in a validated state. CPV encompasses a broader scope than conventional Periodic Product Review (PPR) or Annual Product Quality Review (APQR), in that it is prospective, statistically rigorous, and directly linked to the manufacturing control strategy.7,28
A robust CPV programme typically includes: identification of the CQAs and CPPs to be monitored; specification of sampling frequency and sample size; selection of appropriate statistical tools; pre-defined action and alert limits; documented procedures for signal investigation and escalation; periodic management review of CPV outcomes; and a formal linkage to the change control and continuous improvement systems.29,30
4. CRITICAL QUALITY ATTRIBUTES AND CRITICAL PROCESS PARAMETERS:
4.1 Identification and Classification
Critical Quality Attributes are physical, chemical, biological, or microbiological properties or characteristics that must be controlled within an appropriate limit, range, or distribution to ensure the desired product quality. The identification of CQAs is grounded in an assessment of their potential impact on patient safety and product performance, with risk ranking performed using tools such as FMEA and quality risk matrices.12,31
Process parameters are classified into three categories: Critical Process Parameters (CPPs), whose variation has a direct and significant impact on CQAs and which must therefore be monitored and controlled; Key Process Parameters (KPPs), which are important for maintaining product quality but whose impact is less direct or less severe; and Non-Critical Process Parameters (NCPPs), which have been demonstrated through development studies and risk assessment to have minimal impact on CQAs.32,33
4.2 Control Strategy Development
A control strategy is a planned set of controls, derived from current product and process understanding, that assures process performance and product quality. The control strategy may include controls relating to drug substance and drug product material attributes, equipment and facility operating conditions, in-process controls, finished product specifications, and the associated methods and frequency of monitoring and control.8,34
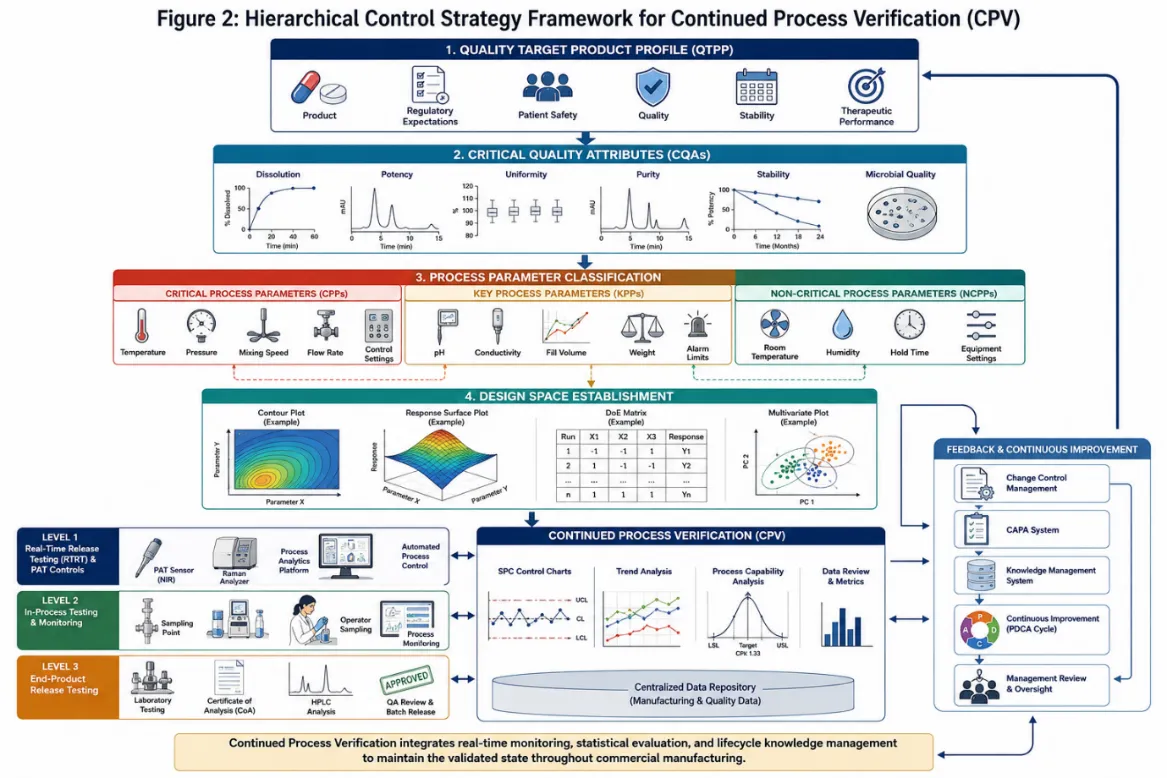
Figure 2: Hierarchical Control Strategy Framework for CPV
4. Monitoring CQAs and CPPs in CPV
The selection of CQAs and CPPs for inclusion in the CPV monitoring programme should be risk-based. Parameters with high criticality ratings and/or high historical variability warrant priority inclusion and more intensive monitoring. As process understanding matures and a track record of consistent performance is established, the monitoring programme may be adapted with appropriate scientific justification to reduce sampling frequency or transition certain attributes to reduced testing schemes.35,36
Out-of-Trend (OOT) results, which represent data points that deviate from established historical trends before crossing an out-of-specification threshold, are particularly important within CPV. Detection of OOT results enables proactive investigation and corrective action, potentially preventing the generation of non-conforming batches. The WHO and PDA (Parenteral Drug Association) have published technical guidance on OOT investigation procedures.37,38
5. STATISTICAL METHODS IN CONTINUOUS PROCESS VERIFICATION:
5.1 Statistical Process Control
Statistical Process Control (SPC) is the application of statistical methods to monitor and control a process so that it operates at its full potential. SPC originated in manufacturing industry through the pioneering work of Walter Shewhart at Bell Laboratories in the 1920s and was subsequently championed by W. Edwards Deming. In the pharmaceutical context, SPC provides the primary analytical engine for CPV data review.39,40
Control charts the central tool of SPC display individual data points or sample statistics plotted over time against statistically derived control limits. The standard Shewhart Individuals and Moving Range (I-MR) chart is widely used in pharmaceutical CPV for monitoring individual batch release results. The Upper Control Limit (UCL) and Lower Control Limit (LCL) are typically set at three standard deviations above and below the process mean, corresponding to a detection sensitivity of approximately 99.73% for normally distributed data.41,42
Cumulative Sum (CUSUM) charts and Exponentially Weighted Moving Average (EWMA) charts are more sensitive alternatives to Shewhart charts for detecting small, sustained shifts in process mean. These charts are particularly valuable in CPV scenarios where early detection of subtle process drift is more important than identification of large, abrupt changes.43,44
5.2 Process Capability Analysis
Process capability indices quantify the relationship between the natural variability of a process and its specification limits. The Cp index measures the intrinsic capability of the process relative to the specification width, assuming the process is centred; the Cpk index adjusts for process mean offset from the target, providing a more realistic assessment of actual process performance.45
The corresponding performance indices Pp and Ppk use overall long-term standard deviation (rather than the short-term within-subgroup estimate used for Cp and Cpk), providing a measure of actual production performance as opposed to potential process capability. A minimum Cpk of 1.33 (equivalent to a process sigma of 4σ) is widely accepted in pharmaceutical manufacturing as indicative of a capable and well-controlled process.46,47
Trending of capability indices over successive CPV review periods provides a sensitive indicator of gradual process deterioration. A declining Cpk trend, even while remaining above the minimum acceptable threshold, may indicate progressive equipment wear, raw material variability, or environmental drift all warranting investigation before quality is compromised.48
5.3 Multivariate Statistical Methods
Modern pharmaceutical manufacturing processes are inherently multivariate, involving numerous interacting parameters and attributes. Univariate monitoring approaches in which each parameter is monitored independently fail to capture the covariance structure of the data and may therefore miss subtle process deviations that manifest as correlated changes across multiple variables.49,50
Principal Component Analysis (PCA) and Partial Least Squares (PLS) regression are the most widely applied multivariate methods in pharmaceutical CPV. PCA reduces the dimensionality of high-dimensional process datasets, projecting them onto a small number of principal components that capture the majority of process variance. Multivariate control charts based on Hotelling's T² statistic and the Q (SPE) residual statistic enable comprehensive monitoring of the process trajectory within the multivariate space.51,52
5.4 Sampling Plans and Batch Selection
The statistical validity of CPV conclusions depends critically on the adequacy of the sampling plan. The frequency of data collection, the number of samples per batch, and the selection of batches for enhanced monitoring must all be scientifically justified. Risk-based approaches, informed by historical process variability data and the criticality of the monitored attributes, provide the appropriate framework for sampling plan design.53,54
6. PROCESS ANALYTICAL TECHNOLOGY IN CONTINUOUS PROCESS VERIFICATION:
6.1 Overview of PAT Framework
Process Analytical Technology (PAT), as defined in the FDA's 2004 PAT Guidance, is a system for designing, analysing, and controlling manufacturing through timely measurements (during processing) of critical quality and performance attributes of raw and in-process materials and processes, with the goal of ensuring final product quality.55
PAT is conceptually aligned with and complementary to QbD; together they constitute the technological foundation of the modern process validation lifecycle. PAT tools enable the generation of rich, high-frequency process data that vastly exceeds the informational content obtainable from traditional offline laboratory testing, providing an enhanced capability for CPV.56,57
6.2 PAT Tools and Techniques
Near-Infrared (NIR) spectroscopy is among the most widely deployed PAT tools in solid dosage manufacturing. NIR can be applied inline, online, or at-line for the monitoring of blend uniformity, moisture content, active pharmaceutical ingredient (API) content, and polymorphic form. The non-destructive nature of NIR measurement allows 100% inspection of product at high throughput.58,59
Raman spectroscopy provides complementary capabilities to NIR, being particularly well-suited for the detection of polymorphic transformations, identification of low-dose APIs, and monitoring of granulation endpoints. Focused Beam Reflectance Measurement (FBRM) enables real-time monitoring of particle size and count, providing critical information during wet granulation, crystallisation, and milling operations.60,61
For liquid and parenteral manufacturing, inline sensors for pH, conductivity, dissolved oxygen, and turbidity provide continuous process visibility. UV-Visible spectroscopy enables real-time concentration monitoring in bioprocessing applications, while acoustic emission sensors can detect crystallisation events and endpoint determination in drying operations.62,63
Table 2: PAT Tools and Their Applications in Pharmaceutical CPV
|
PAT Technique |
Measurement Capability |
Process Application |
CPV Use |
|
Near-Infrared (NIR) |
Chemical composition, moisture, API content |
Blending, granulation, coating, drying |
Blend uniformity, moisture trending |
|
Raman Spectroscopy |
Polymorph form, API identity |
Granulation, milling, coating |
Polymorphic stability, content uniformity |
|
FBRM |
Particle size/count in-situ |
Wet granulation, crystallisation |
Endpoint monitoring, size trending |
|
Inline pH/conductivity |
Ionic concentration, reaction pH |
Fermentation, purification, formulation |
Buffer preparation, reaction monitoring |
|
UV-Vis Spectroscopy |
Concentration, purity |
Bioprocessing, purification |
Protein/API concentration CPV |
|
Acoustic Emission |
Phase changes, particle events |
Drying, milling, crystallisation |
Drying endpoint determination |
6.3 Integration of PAT Data into CPV Programmes
The integration of PAT-derived data streams into CPV programmes presents both significant opportunities and technical challenges. The volume and velocity of data generated by inline PAT instruments substantially exceeds that of traditional batch-release testing, necessitating dedicated data management infrastructure and advanced analytical capabilities.64
Chemometric models including PLS, PCA, and various regression techniques form the analytical backbone of PAT data interpretation. These models must be developed on representative calibration sets, rigorously validated, and subsequently maintained across the product lifecycle to account for instrument drift, process changes, and changes in raw material attributes.65,66
Regulatory acceptance of PAT-derived data for batch release decisions has been progressively increasing, with several products now approved for Real-Time Release Testing (RTRT) based on demonstrated PAT-CPV programme maturity. However, challenges remain regarding instrument qualification frameworks, model lifecycle management, and the harmonisation of expectations across regulatory jurisdictions.67,68
7. KNOWLEDGE MANAGEMENT AND DATA INTEGRITY IN CPV:
7.1 Role of Knowledge Management
Knowledge management is explicitly identified in ICH Q10 as a key enabler of the Pharmaceutical Quality System. In the context of CPV, knowledge management encompasses the systematic acquisition, organisation, analysis, and application of process and product knowledge generated throughout the validation lifecycle.8,69
Process knowledge is cumulative. Insights gained during Stage 1 process design, Stage 2 PPQ, and Stage 3 CPV collectively constitute the organisational knowledge base that supports troubleshooting, technology transfer, post-approval changes, and continuous improvement. Effective knowledge management systems ensure that this knowledge is captured, retained, and made accessible to the relevant personnel throughout the product lifecycle.70,71
7.2 Data Governance and Integrity Requirements
Data integrity is a non-negotiable requirement in pharmaceutical manufacturing, and its importance is amplified in CPV programmes where the validity of statistical conclusions depends entirely on the completeness, accuracy, and reliability of the underlying data. The ALCOA+ principles (Attributable, Legible, Contemporaneous, Original, Accurate, plus Complete, Consistent, Enduring, and Available) articulate the fundamental requirements for pharmaceutical data quality.72,73
Electronic data management systems used in CPV including Manufacturing Execution Systems (MES), Laboratory Information Management Systems (LIMS), and dedicated statistical software platforms must be appropriately validated in accordance with applicable regulations (21 CFR Part 11 in the USA; EU Annex 11 in Europe) to ensure the reliability of electronically generated CPV data and reports.74,75
7.3 Advanced Data Analytics and Digitalisation
The advent of Industry 4.0 technologies is fundamentally altering the landscape of pharmaceutical CPV. Machine learning algorithms, including supervised techniques such as Random Forest, Support Vector Machines, and neural networks, are being applied to CPV datasets to identify complex non-linear relationships between process variables and quality attributes that are inaccessible to conventional statistical approaches.76,77
Digital twin technology the creation of a dynamic computational model of the manufacturing process that is continuously updated with real-time operational data represents a transformative opportunity for CPV. A digital twin can predict batch quality outcomes from process data in real time, provide early warning of deviations, and simulate the impact of proposed process changes before implementation.78,79
The implementation of advanced analytics in regulated environments requires careful consideration of validation requirements, explainability obligations (particularly for AI/ML models used in quality decisions), and the challenge of maintaining algorithmic integrity over time as process conditions evolve.80
8. CPV ACROSS DIFFERENT DOSAGE FORMS AND MANUFACTURING PLATFORMS:
8.1 Oral Solid Dosage Forms
Oral solid dosage forms (OSDFs) tablets, capsules, and granules represent the highest-volume manufacturing category in the pharmaceutical industry, and CPV programmes for OSDFs are consequently the most extensively documented in the literature. Key manufacturing unit operations subject to CPV monitoring include powder blending, wet and dry granulation, compaction, tablet compression, and film coating.81,82
CQAs commonly monitored in OSDF CPV programmes include assay/content uniformity, dissolution profile, tablet hardness, disintegration time, friability, and moisture content. Tablet compaction force and punch displacement are typical CPPs monitored during compression operations; inlet air temperature, spray rate, and coating weight gain are monitored during film coating.83,84
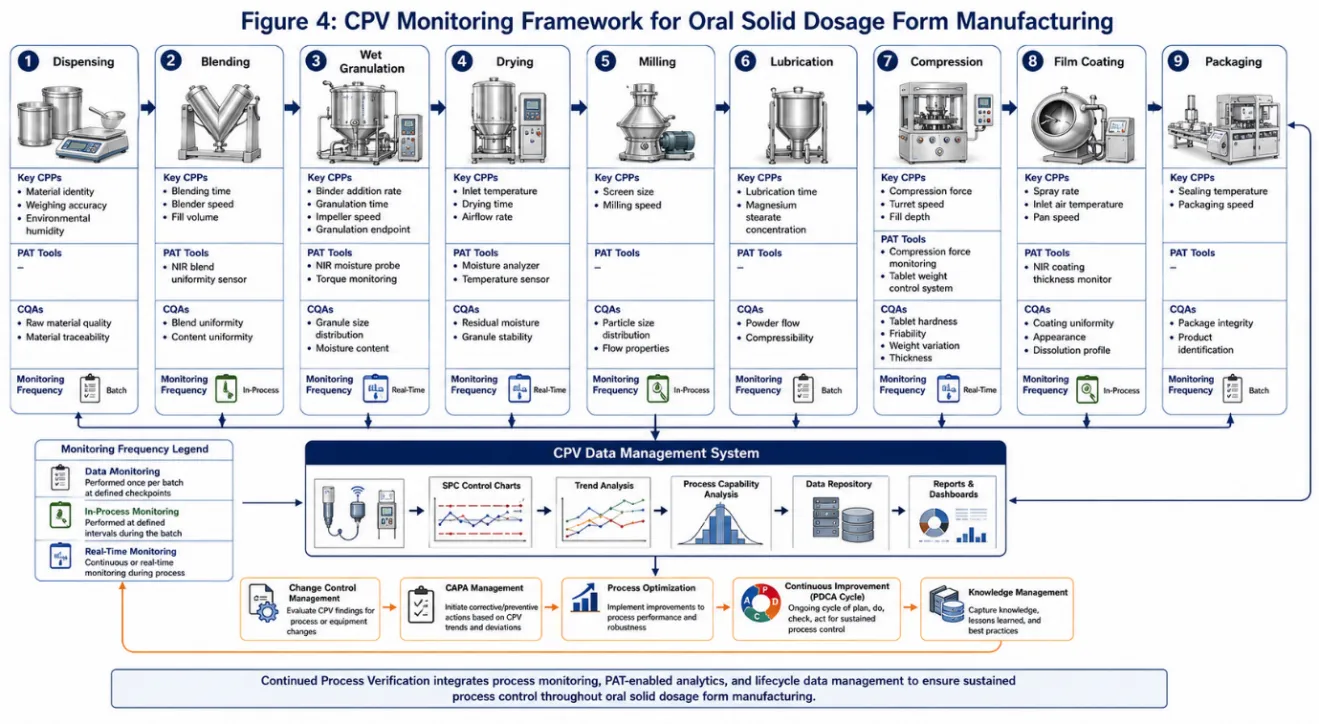
Figure 3: CPV Monitoring Framework for Oral Solid Dosage Form Manufacturing
8.2 Serile and Parenteral Products
Sterile and parenteral product manufacturing presents unique and demanding CPV challenges, owing to the critical nature of sterility as an absolute requirement and the complexity of the manufacturing environments and processes involved. Aseptic processing the filling of sterile drug products into sterile containers in a controlled cleanroom environment requires particularly rigorous CPV of environmental monitoring data, bioburden, endotoxin levels, and container closure integrity.85,86
Lyophilisation (freeze-drying) processes are particularly amenable to CPV, as the numerous CPPs (shelf temperature ramp rates, chamber pressure, condenser temperature, primary and secondary drying endpoints) and CQAs (residual moisture, reconstitution time, appearance, potency) generate a rich dataset well-suited to multivariate monitoring approaches.87,88
8.3 Biologics and Biotechnology Products
Biological products including monoclonal antibodies, recombinant proteins, vaccines, and cell and gene therapies present the most complex CPV challenges of any manufacturing platform. The inherent biological variability of living cell systems, the structural complexity of macromolecular products, and the multiplicity of critical quality attributes (CQAs encompassing identity, purity, potency, and safety) create a CPV environment of exceptional analytical and statistical complexity.89,90
Cell culture and fermentation processes require CPV monitoring of dissolved oxygen, pH, temperature, osmolality, metabolite concentrations (glucose, lactate, glutamine, ammonium), viable cell density, and titre. Downstream purification processes chromatography, ultrafiltration/diafiltration, viral inactivation/filtration each have their own CPPs and CQAs requiring monitoring within the CPV framework.91,92
8.4 Continuous Manufacturing
The emergence of continuous manufacturing (CM) as an alternative to batch manufacturing represents a transformative development with profound implications for CPV. In continuous manufacturing, material flows uninterrupted through integrated processing equipment, with the concept of a 'batch' redefined in temporal or mass terms. Real-time release testing (RTRT) becomes both more necessary and more achievable in CM, as the high frequency of PAT measurements enables near-instantaneous quality assessment.93,94
FDA and EMA have both issued guidance specifically addressing process validation and CPV for continuous manufacturing, emphasising the need for robust control systems, defined residence time distributions, diversion strategies for non-conforming material, and model-predictive control frameworks.95,96
9. CHANGE CONTROL AND POST-APPROVAL CHANGES WITHIN THE CPV FRAMEWORK:
CPV data constitute an invaluable evidentiary resource for supporting post-approval change submissions. Regulatory agencies are increasingly receptive to change applications that are supported by robust CPV datasets demonstrating sustained process understanding and control, enabling manufacturers to pursue enhanced manufacturing changes and process improvements with greater regulatory efficiency.97,98
Post-approval changes are classified according to their potential impact on product quality, safety, and efficacy: minor changes requiring notification, moderate changes requiring prior approval with abbreviated data packages, and major changes requiring prior approval with full data submissions. CPV data can, in appropriate circumstances, support a reclassification of a change from major to moderate or from moderate to minor, thereby reducing regulatory burden and accelerating time-to-market for improvements.99,100
Comparability protocols, used in the biologics industry to manage post-approval manufacturing changes, represent a formalised framework within which CPV data play a central role. A pre-approved comparability protocol enables specified changes to be implemented with streamlined regulatory reporting, provided that the CPV data confirm that the change has not adversely affected product quality.101,102
10. CHALLENGES AND BARRIERS TO EFFECTIVE CPV IMPLEMENTATION:
Despite the clear regulatory mandate and quality rationale for CPV, implementation across the pharmaceutical industry remains uneven in depth and maturity. A constellation of organisational, technical, and regulatory challenges impedes the full realisation of CPV's potential.103,104
Organisational and cultural barriers are frequently cited in the literature as among the most significant obstacles. Pharmaceutical quality teams with limited statistical expertise may struggle to implement and interpret SPC and capability analyses correctly, and there may be institutional resistance to the cultural shift away from reactive quality management towards proactive, data-driven process stewardship.105
Legacy products present particular challenges for CPV, especially where historical process development data are incomplete, where analytical methods have evolved since product launch, or where manufacturing equipment predates the era of modern data acquisition systems. Establishing statistically justified baseline performance for such products requires careful retrospective analysis and may necessitate targeted studies to supplement deficient historical datasets.106,107
The complexity of managing CPV programmes across multi-site manufacturing networks adds a further dimension of difficulty, requiring harmonisation of monitoring methodologies, statistical tools, review frequencies, and escalation criteria across sites that may operate under different regulatory jurisdictions with potentially divergent expectations.108,109
Table 3: Key Challenges in CPV Implementation and Potential Mitigation Strategies
|
Challenge Category |
Specific Challenge |
Mitigation Strategy |
|
Organisational |
Limited statistical expertise in quality teams |
Training programmes; use of statistical SMEs; fit-for-purpose software |
|
Organisational |
Cultural resistance to data-driven approaches |
Leadership engagement; success stories; change management |
|
Technical |
Legacy products with limited historical data |
Retrospective data analysis; targeted gap-filling studies |
|
Technical |
PAT instrument qualification and model drift |
Robust qualification protocols; periodic model recalibration |
|
Data |
Volume and complexity of PAT data streams |
Validated LIMS/MES platforms; data management strategies |
|
Regulatory |
Divergent global regulatory expectations |
ICH harmonisation efforts; early regulatory engagement |
|
Statistical |
Establishing appropriate control limits |
Risk-based limit-setting; phase-I and phase-II SPC approaches |
11. CASE STUDIES AND INDUSTRY EXAMPLES:
11.1 CPV Implementation for Oral Solid Dosage Form
A published case study by am Ende et al. described the implementation of a CPV programme for an immediate-release tablet product manufactured at commercial scale. The programme integrated NIR-based blend uniformity monitoring, tablet press force data acquisition, and offline dissolution testing within a unified SPC framework. Control charts for API blend uniformity (NIR-derived), compaction force, and dissolution (Q45 minutes) were established during the PPQ phase using a 20-batch baseline dataset, with control limits calculated using standard Shewhart methodology.110,111
Following programme implementation, the CPV data identified a gradual downward trend in dissolution over a 12-month period, which was ultimately attributed to a change in the particle size distribution of a critical excipient. The early detection enabled through CPV permitted a proactive investigation and corrective action to be completed before any batch failed specification a clear demonstration of CPV's patient safety value.112
11.2 CPV Application in Biologics Manufacturing
Rathore et al. documented a multivariate CPV approach for a monoclonal antibody manufacturing process, applying PCA-based monitoring to the upstream cell culture operation. The multivariate control chart detected a gradual shift in the cell culture trajectory that was invisible to individual univariate SPC charts for the constituent parameters. Subsequent investigation identified a change in cell bank passage number as the root cause, and corrective action restored the process to its historical normal operating condition.113,114
11.3 Regulatory Inspection Findings
Analysis of FDA Warning Letters and Form 483 observations from 2015 to 2023 related to process validation and CPV reveals consistent themes in deficiency findings. The most frequently cited deficiencies include: failure to establish a formal Stage 3 CPV programme; inadequate statistical methods for trend analysis; failure to investigate OOT results within the CPV framework; and failure to integrate CPV outcomes with change control and CAPA systems. These findings underscore the continuing gap between regulatory expectations and industry practice in a significant proportion of pharmaceutical manufacturers.19,115
12. FUTURE PERSPECTIVES AND EMERGING TRENDS:
The future trajectory of CPV will be shaped by converging technological, regulatory, and strategic forces that are already beginning to reshape pharmaceutical manufacturing quality systems.116
Artificial intelligence and machine learning represent perhaps the most transformative near-term development for CPV. Recurrent neural networks and long short-term memory (LSTM) models are particularly well-suited to the analysis of time-series process data, enabling predictive quality monitoring capabilities that extend far beyond the retrospective and concurrent monitoring currently practised. AI-enabled CPV systems have the potential to predict batch quality outcomes hours or days before traditional release testing would be complete, enabling truly proactive quality management.77,117
The development of harmonised global regulatory standards for CPV represents an important strategic priority for the pharmaceutical industry and regulatory agencies alike. Divergence in national and regional CPV expectations particularly between ICH member regions and non-ICH markets creates substantial compliance complexity for globally operating manufacturers. The ICH Q12 guideline on technical and regulatory considerations for pharmaceutical product lifecycle management, adopted in 2019, represents a significant step towards harmonised lifecycle management frameworks.118,119
The expansion of real-time release testing, enabled by mature CPV programmes integrating PAT measurements with validated process models, will progressively transform the economics and responsiveness of pharmaceutical manufacturing. RTRT reduces lead times from weeks to hours, minimises inventory requirements, enables faster identification and isolation of non-conforming material, and ultimately accelerates product delivery to patients.120,121
Personalised medicine and novel therapeutic modalities including cell and gene therapies, RNA-based therapeutics, and antibody-drug conjugates present the next frontier for CPV innovation. These modalities are characterised by extremely small batch sizes, highly complex and sensitive manufacturing processes, and patient-specific quality requirements that challenge conventional CPV frameworks. The development of bespoke CPV approaches for these emerging modalities is an active area of academic and regulatory development.122,123
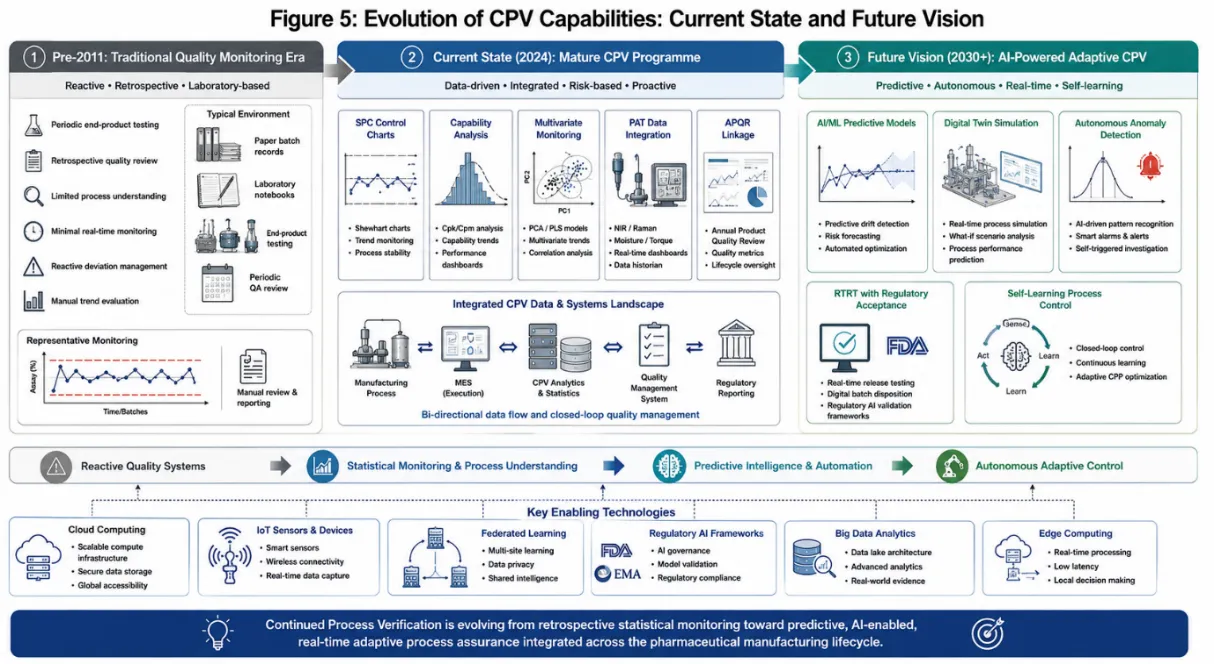
Figure 4: Evolution of CPV Capabilities: Current State and Future Vision
CONCLUSION
This review has provided a comprehensive examination of Continuous Process Verification as the essential third stage of the pharmaceutical process validation lifecycle. CPV is not merely a regulatory compliance obligation but a scientifically rigorous quality management strategy that delivers substantive and measurable benefits: enhanced process understanding, early detection of process drift, reduction of quality failures, facilitation of continuous improvement, and most fundamentally reliable protection of patient safety through the consistent delivery of products of defined quality.
The evolution of CPV from its origins in the FDA's 2011 Guidance to its contemporary integration with PAT, QbD, digital technologies, and AI reflects the broader transformation of pharmaceutical manufacturing towards a knowledge-intensive, data-driven discipline. Regulatory frameworks across ICH member regions have converged around the lifecycle validation model, providing a globally coherent if not yet fully harmonised framework within which manufacturers can build effective CPV programmes.
Key recommendations for organisations seeking to build or mature their CPV programmes include: investment in statistical training and capability; adoption of fit-for-purpose electronic data management systems; integration of PAT where scientifically justified; robust knowledge management practices; formal linkage of CPV to change control, CAPA, and management review; and proactive engagement with regulatory authorities on CPV programme design for complex or novel products.
As the pharmaceutical industry confronts the challenges of novel therapeutic modalities, continuous manufacturing, and digital transformation, CPV will continue to evolve but its core purpose remains unchanged: to ensure that every product, from every batch, meets the quality standards upon which patients depend.
REFERENCES

Sneha Pote, Renuka Bhabad, Kartiki Aher, Prerna Sawale, Dr. Pravin Gadakh, Continuous Process Verification in Pharmaceutical Manufacturing: A Lifecycle Approach to Quality Assurance, Int. J. of Pharm. Sci., 2026, Vol 4, Issue 6, 647-666, https://doi.org/10.5281/zenodo.20525590
 10.5281/zenodo.20525590