
We use cookies to ensure our website works properly and to personalise your experience. Cookies policy
1Department of Pharmaceutics, Nimra College of Pharmacy, Jupudi, Ibrahimpatnam, NTR-521456
2Associate Professor, Department of Pharmaceutics, Nimra College of Pharmacy, Jupudi, Ibrahimpatnam, NTR-521456
3 Professor, Department of Pharmaceutics, Nimra College of Pharmacy, Jupudi, Ibrahimpatnam, NTR-521456
The goal of the current study was to create and assess Olmesartan microspheres using various sodium alginate concentrations. Ionotropic gelation was used to create ten batches of microspheres (F1–F10). In the formulations, sodium alginate, calcium chloride, ethyl cellulose, and HPMC K100 were chosen. Particle size (70.52±0.62), yield percentage (99.86%), entrapment efficiency (97.68%), and drug release were all examined in relation to polymer and cross-linking agent. When compared to other evaluation criteria, F8 was shown to be optimized and to have the maximum drug release (99.56 ± 5.28) within 12 hours in a controlled way. The drug release from microspheres followed zero order with anomalous non-Fickian diffusion according to release order kinetics. Fourier-transform infrared spectroscopy (FTIR) and scanning electron microscopy (SEM) were used to examine the produced microspheres' morphology and compatibility with the polymers. Olmesartan microspheres may therefore be the best option for managing hypertension effectively and improving patient compliance over an extended period of time.
The creation of resin-drug complexes covered with polymers can also give oral dose formulations-controlled release characteristics. A controlled release drug delivery system is often made to administer the drug at a rate-controlled release. A localized high concentration at a particular location may be avoided because multiarticulate drug administration results in a broad and consistent dispersion throughout the GIT. The use of microspheres in medication delivery has been thoroughly investigated, and different polymers have been used to manufacture the microspheres, which have then been evaluated for a variety of uses. One of the dose forms with numerous units is microspheres. Since a constant plasma concentration is maintained, the overall dose and minimal side effects may eventually be decreased. In the field of innovative drug delivery, microspheres—which are made from a variety of polymers—are promising drug delivery carrier systems.
An oral nonpeptide angiotensin II receptor antagonist is called olmesartan medoxomil (OLM). The US FDA authorized it in 2002 to treat hypertension, either on its own or in conjunction with another anti-hypertensive. Because of an endogenous esterase, this pro drug is quickly transformed in vivo into the pharmacologically active metabolite, olmesartan. By specifically blocking angiotensin II type 1 receptor sites in vascular smooth muscle, it just inhibits the vasoconstrictor actions of angiotensin II.
D-mannuronic acid and L-glucuronic acid are combined to create sodium alginate, an anionic natural polysaccharide. Sodium alginate's low toxicity and biocompatibility make it a popular drug delivery vehicle. Ionotropic gelation is a popular technique for preparing olmesartan microspheres. This process has a number of benefits, including being easier to regulate and requiring no organic solvent. Sodium alginate has been utilized extensively in sustained drug release because it can gel in the presence of multivalent cations like Ca2+, Zn2+, Ba2+, Al3+, etc. through ionic cross-linking to produce microspheres. Because calcium chloride is benign and biocompatible, it is chosen as the cross-linking agent in this investigation.
Additionally useful as control or modified release polymers are ethyl cellulose and HPMC K100. The current study's goal was to create Olmesartan microspheres using the ionotropic gelation technique. The findings show that Olmesartan microspheres in their optimal form can effectively treat hypertension.
MATERIALS AND METHODS
Materials: Olmesartan was gifted by Arbro Pharmaceuticals, New Delhi. Ethyl cellulose and HPMC K100 were purchased from S. Kant. Healthcare Ltd Vapi, Gujarat. Sodium alginate was purchased from Pruthvi Chemicals, Mumbai. Calcium chloride and all other chemicals and solvents were of analytical grade.
Methods
Formulation of Olmesartan Microspheres
Ionotropic gelation was used to create the sodium alginate microspheres. Olmesartan and other polymers specified in Table 1 were weighed out and added to a 100 ml sodium alginate solution. The mixture was then vigorously mixed at 500 rpm. Using a syringe and needle, the resultant solution was extruded dropwise into a 100 ml aqueous calcium chloride solution while being agitated at 100 rpm. Following ten minutes of stirring, the resulting microspheres were cleaned with water, dried in a hot air oven at 60 degrees for two hours, and then stored in desiccators.
Table 1: Formulation trials for Olmesartan microspheres
|
Formulation Code |
Olmesartan (mg) |
Sodium Alginate |
Ethyl Cellulose(mg) |
HPMC K100 (mg) |
Calcium Chloride |
|
F1 |
40 |
1.0 % |
100 |
-- |
6 % |
|
F2 |
40 |
1.25 % |
150 |
-- |
6 % |
|
F3 |
40 |
1.50 % |
200 |
-- |
6 % |
|
F4 |
40 |
1.75 % |
250 |
-- |
6 % |
|
F5 |
40 |
2.0 % |
300 |
-- |
6 % |
|
F6 |
40 |
1.0 % |
-- |
100 |
10 % |
|
F7 |
40 |
1.25 % |
-- |
150 |
10 % |
|
F8 |
40 |
1.50 % |
-- |
200 |
10 % |
|
F9 |
40 |
1.75 % |
-- |
250 |
10 % |
|
F10 |
40 |
2.0 % |
-- |
300 |
10 % |
Evaluation of olmesartan microspheres
Particle size
The 100 microspheres were evaluated with respect to their size and shape using optical microscope fitted with an ocular micrometer and a stage micrometer. The particle diameter was measured randomly by optical microscope. Angle of repose, Bulk density, tapped density; Compressibility index and Hausner’s ratio were evaluated according to the reported procedure.
Drug entrapment efficiency and % yield
To determine the incorporation efficiency, 10 mg of formulated microspheres were thoroughly crushed by triturating and suspended in required quantity of methanol followed by agitation to dissolve the polymer and extract the drug. After filtration, suitable dilutions were made and drug content assayed spectrophotometrically at 259 nm. Each batch should be examined for drug content in a triplicate manner.
In vitro drug release studies
Release rate of drug from sodium alginate microspheres was carried out using USP type II dissolution apparatus with 900 ml of 0.1N HCl (pH 1.2) as dissolution medium. Accurately weighed amount of microspheres from each batch were subjected to dissolution studies in triplicate manner. At appropriate intervals up to 12 h, specific volume of aliquots was withdrawn and the same volume was replaced analyzed for the concentration of drug by UV spectrophotometer at 259 nm.
Kinetic Modeling of Drug Release
In order to understand the kinetics and mechanism of drug release, the result of the in vitro dissolution study of microspheres were fitted with various kinetic equations like Zero order as cumulative percentage drug release Vs. time, first order as log percentage of drug remaining to be released Vs. time, Higuchi’s model cumulative percentage drug released Vs. square root of time. r² and K values were calculated for the linear curves obtained by regression analysis of the above plots.
To analyze the mechanism of drug release from the tablets the in vitro dissolution data was fitted to zero order, first order, Higuchi’s release model and Korsmeyer – Peppas model. Drug Excipients Drug Compatibility Studies
The drug excipients compatibility studies were carried out by Fourier Transmission Infrared Spectroscopy (FTIR) method, SEM and Differential Scanning Colorimetry.
Fourier Transform Infrared Spectroscopy (FTIR)
FTIR spectra for pure drug, physical mixture and optimized formulations were recorded using a Fourier transform Infrared spectrophotometer. The analysis was carried out in Shimadzu-IR Affinity 1 Spectrophotometer. The samples were dispersed in KBr and compressed into disc/pellet by application of pressure. The pellets were placed in the light path for recording the IR spectra. The scanning range was 400-4000 cm-1 and the resolution was 1 cm-1.
Differential Scanning Calorimetry (DSC)
Differential Scanning Calorimetry (DSC) studies were carried out using DSC 60, having TA60 software, Shimadzu, Japan. Samples were accurately weighed and heated in sealed aluminum pans at a rate of 10°C/ min between 25 and 350°C temperature rang under nitrogen atmosphere. Empty aluminum pan was used as a reference.
SEM studies
The surface and shape characteristics of pellets were determined by scanning electron microscopy (SEM) (HITACHI, S-3700N). Photographs were taken and recorded at suitable magnification.
Stability studies
The stability study of the optimized formulation was carried out under different conditions according to ICH guidelines. The optimized microspheres were stored in a stability chamber for stability studies (REMI make). Accelerated Stability studies were carried out at 40°C / 75% RH for the best formulations for 6 months. The microspheres were characterized for the percentage yield, entrapment efficiency & cumulative % drug released during the stability study period.
RESULTS AND DISCUSSION
Formulation of Microspheres of Olmesartan
Micromeritic properties of formulated Olmesartan sodium alginate microspheres (Figure 1) were shown in Table 2; all the formulations were evaluated and found to be within the IP limits. Percentage yield and entrapment efficiency of all the fourteen formulations were evaluated and depicted in Table 3. The formulation F8 shown the good percentage yield and entrapment efficiency when compared with other formulations of 99.86% and 97.68%.
Fig. 1: Normal microspheres of Olmesartan
Table 2 : Micromeritic properties of formulated Olmesartan sodium alginate microspheres
|
Formulation code |
Particle size (μm) |
Bulk density(g/cc³) |
Tapped density (g/cc³) |
Angle of Repose |
Carr’s index |
|
F1 |
68.95±0.06 |
0.59±0.02 |
0.64±0.67 |
25.85±0.01 |
11.52 |
|
F2 |
70.25±0.12 |
0.61±0.26 |
0.61±0.61 |
24.62±0.02 |
10.68 |
|
F3 |
71.54±0.15 |
0.62±0.65 |
0.64±0.85 |
24.97±0.23 |
12.75 |
|
F4 |
70.68±0.68 |
0.58±0.84 |
0.59±0.61 |
25.66±0.12 |
12.61 |
|
F5 |
72.86±0.74 |
0.57±0.57 |
0.58±0.95 |
25.17±0.13 |
10.57 |
|
F6 |
68.58±0.14 |
0.62±0.24 |
0.61±0.14 |
24.63±0.21 |
11.96 |
|
F7 |
69.31±0.15 |
0.65±0.95 |
0.60±0.85 |
23.95±0.31 |
12.74 |
|
F8 |
70.52±0.62 |
0.62±0.62 |
0.58±0.69 |
23.84±0.14 |
10.65 |
|
F9 |
71.25±0.57 |
0.68±0.78 |
0.59±0.84 |
24.85±0.62 |
11.85 |
|
F10 |
70.28±0.11 |
0.69±0.62 |
0.61±0.12 |
25.19±0.14 |
12.95 |
Table 3 : Percentage drug yield and entrapment efficiency of Olmesartan microspheres
|
Formulation code |
Percentage yield (%) |
Entrapment efficiency (%) |
|
F1 |
91.25 |
92.68 |
|
F2 |
93.68 |
96.54 |
|
F3 |
92.51 |
91.85 |
|
F4 |
94.63 |
92.84 |
|
F5 |
96.85 |
96.84 |
|
F6 |
95.75 |
97.58 |
|
F7 |
96.85 |
96.85 |
|
F8 |
99.86 |
97.68 |
|
F9 |
97.15 |
96.48 |
|
F10 |
96.58 |
97.82 |
In Vitro Drug Release Studies: In vitro drug release studies were carried out and depicted in Table 4 & 5 and Figure 2 & 3. Among all the formulations F8 showed best drug release of 99.98 ± 5.28% within 12 h when compared with other formulations.
Table 4: In vitro cumulative % drug release of Olmesartan Ethyl Cellulose microspheres formulations (F1-F5)
|
Time (h) |
F1 |
F2 |
F3 |
F4 |
F5 |
|
0 |
0 |
0 |
0 |
0 |
0 |
|
1 |
11.56 |
18.69 |
11.48 |
17.58 |
16.24 |
|
2 |
29.84 |
24.96 |
28.64 |
26.48 |
31.54 |
|
4 |
34.11 |
38.95 |
37.48 |
35.85 |
36.74 |
|
6 |
62.48 |
42.58 |
51.24 |
47.82 |
48.85 |
|
8 |
74.58 |
55.62 |
66.74 |
55.64 |
55.63 |
|
10 |
84.75 |
78.95 |
74.62 |
68.95 |
64.28 |
|
12 |
91.78 |
89.45 |
89.54 |
75.99 |
81.52 |
Table 5: In vitro cumulative % drug release of Olmesartan HPMC K100 microspheres formulations (F6-F10)
|
Time (h) |
F6 |
F7 |
F8 |
F9 |
F10 |
|
0 |
0 |
0 |
0 |
0 |
0 |
|
1 |
18.54 |
22.48 |
36.48 |
19.84 |
26.48 |
|
2 |
26.47 |
39.84 |
45.78 |
39.47 |
35.48 |
|
4 |
33.85 |
49.58 |
65.27 |
55.48 |
51.45 |
|
6 |
45.95 |
61.24 |
79.85 |
68.74 |
78.56 |
|
8 |
71.85 |
75.84 |
85.27 |
78.95 |
86.48 |
|
10 |
80.24 |
85.47 |
91.86 |
86.47 |
93.48 |
|
12 |
91.85 |
94.34 |
99.56 |
92.48 |
95.74 |
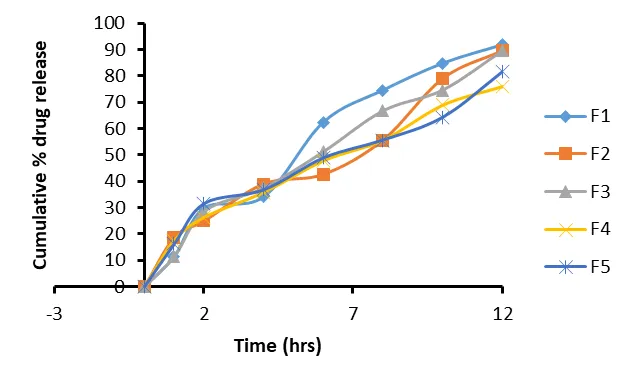
Figure 2 : In vitro cumulative % drug release of Olmesartan Ethyl Cellulose microspheres formulations (F1-F5)
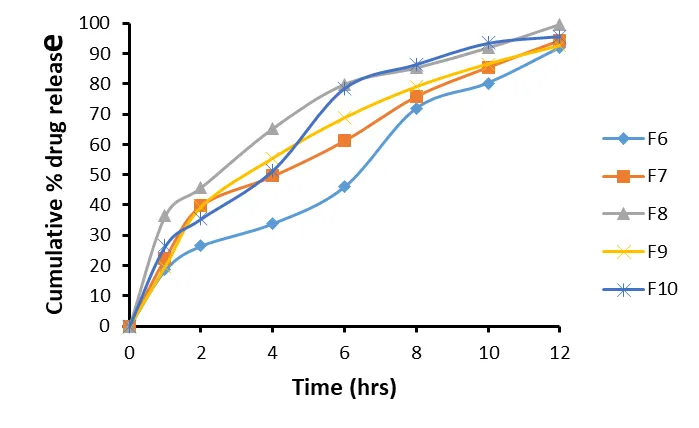
Fig 3 : In vitro cumulative % drug release of Olmesartan HPMC K100 microspheres formulations (F6-F10)
Mathematical modeling of optimized formula of microspheres:
In the view of establishment of release mechanism and quantitatively interpreting and translate mathematically the dissolution date being plotted (Figure 4, 5, 6 and Table 6). From the above results it is apparent that the regression coefficient value closer to unity in case of zero order plot i.e. 0.632 indicates that the drug release follows a zero-order mechanism. This data indicates a lesser amount of linearity when plotted by the first order equation. Hence it can be concluded that the major mechanism of drug release follows zero order kinetics.
Further, the translation of the data from the dissolution studies suggested possibility of understanding the mechanism of drug release by configuring the data in to various mathematical modeling such as Higuchi and Korsmeyer plots.
The mass transfer with respect to square root of the time has been plotted, revealed a linear graph with regression value close to one i.e. 0.9763 starting that the release from the matrix was through diffusion. Further the n value obtained from the Korsmeyer plots i.e. 0.912 suggest that the drug release from microspheres was anomalous Non fickian diffusion.
Table 6 : Release order kinetics of optimized microspheres
|
Formulation code |
Zero Order |
First Order |
Higuchi |
Korsmeyer- Peppas |
|
F1 |
0.865 |
0.862 |
0.926 |
0.962 |
|
F2 |
0.897 |
0.854 |
0.987 |
0.954 |
|
F3 |
0.902 |
0.859 |
0.874 |
0.935 |
|
F4 |
0.899 |
0.957 |
0.869 |
0.971 |
|
F5 |
0.962 |
0.924 |
0.982 |
0.962 |
|
F6 |
0.957 |
0.899 |
0.847 |
0.862 |
|
F7 |
0.635 |
0.874 |
0.862 |
0.947 |
|
F8 |
0.632 |
0.829 |
0.899 |
0.912 |
|
F9 |
0.635 |
0.925 |
0.921 |
0.925 |
|
F10 |
0.758 |
0.962 |
0.962 |
0.911 |

Figure 4: Zero order plot for the optimized formulation of Olmesartan micropsheres F8
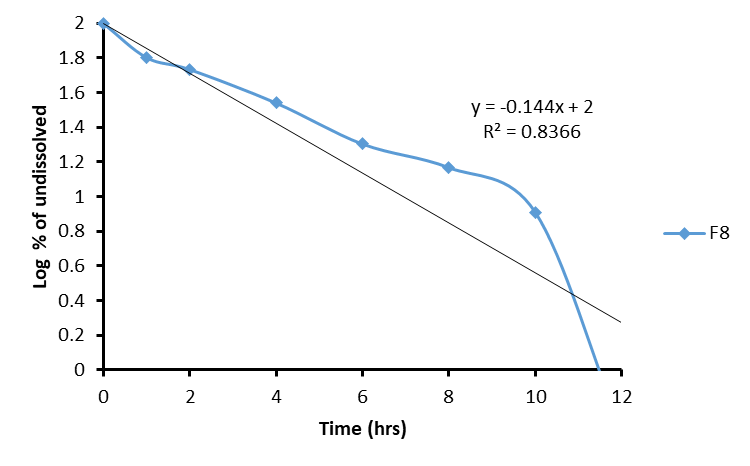
Figure 5: First order plot for the optimized formulation of Olmesartan microspheres F8
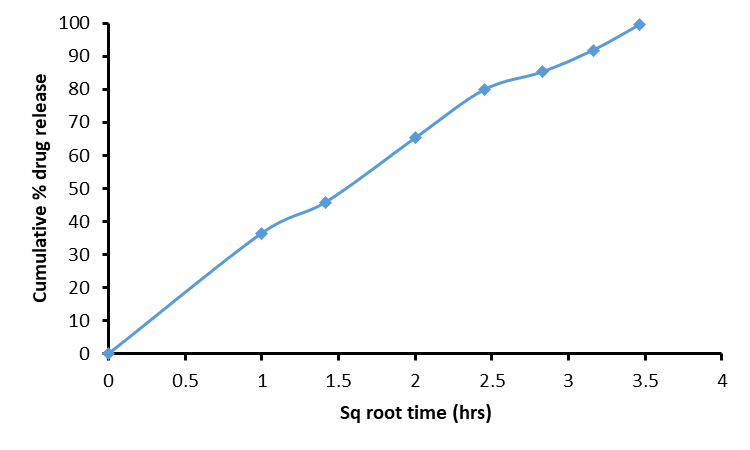
Figure 6: Higuchi plot for the optimized formulation of olmesartan microspheres F8
Drug Excipients Compatibility Studies
FT-IR studies
There was no alteration in peaks of Olmesartan pure drug (Figure 7) and optimized formulation (Figure 8), suggesting that there was no interaction between drug & excipients. There is additional peaks appeared or disappeared hence no significant changes in peaks of optimized formulation was observed when compared to pure drug, indicating absence of any interaction.
Figure 7: FT-IR spectrum of pure drug Olmesartan
Figure 8 : FT-IR spectrum of Olmesartan optimized formulation
Scanning Electron Microscopy
The external and internal morphology of controlled release microspheres were studied by Scanning Electron Microscopy.
Morphology of the various formulations of Olmesartan microspheres prepared was found to be discrete and spherical in shape (Figure 9). The surface of the Olmesartan microspheres was rough due to higher concentration of drug uniformly dispersed at the molecular level in the sodium alginate matrices. There are no crystals on surface which states that is drug is uniformly distributed.
Figure 9. : Scanning electron micrographs of Olmesartan microspheres
CONCLUSION
Olmesartan loaded microspheres were prepared by ionotropic gelation method. From the results it concluded that formulation F8 was found to be satisfactory results in terms of excellent Micromeretic properties, particle size, yield of microsphere, entrapment efficiency, swelling index and highest in vitro drug release of in a sustained manner with constant fashion over extended period for 12h compared with marketed product in 12 h. The drug and excipients were compatible studied by using FTIR. Drug release from olmesartan microspheres followed Zero order and Higuchi model. It was suggested that mechanism of drug release from microspheres was diffusion controlled. The prepared microspheres were spherical in shape studied by SEM studies. The optimized formulation F8 was stable.
REFERENCES


Pilli Ushasri, Shabana Parveen, Chandra Sekhar Naik, Development and Characterization of Olmesartan Microspheres Prepared by Ionotropic Gelation Method, Int. J. of Pharm. Sci., 2026, Vol 4, Issue 6, 246-257. https://doi.org/10.5281/zenodo.20488127
 10.5281/zenodo.20488127