

We use cookies to ensure our website works properly and to personalise your experience. Cookies policy
School of Pharmacy, Abhilashi University, Chail-Chowk, Mandi (H.P.), India.
The goal of the current study was to develop and evaluate herbal tablets using the ethanolic extract of Galinsoga parviflora (Cav.), an Asteraceae herb with a documented phenolic- and flavonoid-rich profile, for possible antihyperlipidemic effects. The Soxhlet extraction method was used to prepare the ethanolic extract, which was then incorporated into tablets using the wet granulation technique. Four formulations (F1–F4) were prepared and evaluated for pre-compression and post-compression parameters, varying the concentration of the binder PVP K-30. Formulation F3 was selected as the optimal formulation based on this evaluation, showing the fastest and most complete in vitro release (100.0% at 90 minutes). The extract was characterized by UV–Visible spectrophotometry and HPLC fingerprinting, and was examined, in triplicate (n = 3), for in vitro antihyperlipidemic potential using total phenolic content, total flavonoid content, DPPH radical scavenging activity, and, as a direct mechanistic measure of cholesterol-lowering potential, in vitro bile acid binding capacity benchmarked against cholestyramine. The ethanolic extract showed a total phenolic content of 64.8 ± 0.35 mg GAE/g and total flavonoid content of 38.5 ± 0.24 mg QE/g extract, concentration-dependent DPPH radical scavenging activity (percentage inhibition rising from 15.2% to 81.3% over 10–100 µg/mL, versus 31.8% to 96.4% for ascorbic acid), and concentration-dependent bile acid binding (12.6 ± 0.8% to 43.6 ± 1.4%, versus 48.7 ± 1.0% to 84.5 ± 0.8% for cholestyramine, over 0.5–3.0 mg/mL), in addition to acceptable physicochemical characteristics. HPLC fingerprinting resolved 33 peaks over a 15-minute run, confirming a chemically complex, multi-component extract, and this qualitative profile may serve as a reference for future batch-to-batch quality evaluation. These results suggest that herbal tablets containing Galinsoga parviflora possess promising antihyperlipidemic potential and may serve as a natural adjunct in the management of hyperlipidemia. Further in vivo studies are warranted to establish their safety and therapeutic efficacy.
Plants are rich in a variety of secondary metabolites, many of which are aromatic substances such as phenols or their oxygen-substituted derivatives, including tannins (1). Aromatic plants, herbs, and their essential oils have been used in traditional medicine, food preparation and preservation, religious observances, and cosmetic purposes for thousands of years; today, the use of plant extracts as sources of medicinal compounds continues to grow, driven by the modern consumer's demand for natural, safe, and high-quality products. Several herbal drugs have yielded important modern therapeutic agents, and herbal medicines continue to play a significant and increasingly important role in global healthcare, finding new and expanding markets as health foods and preventative medicines. More than half of currently available drugs are estimated to have originated in some way from plants, and a majority of the world's population continues to depend on plant-derived medicine as a first line of primary healthcare.
Hyperlipidemia is a metabolic disorder characterized by elevated plasma lipids, particularly cholesterol and triglycerides, and is one of the principal modifiable risk factors for atherosclerotic cardiovascular disease (1). Excessive circulating low-density lipoprotein cholesterol (LDL-C) accumulates within the arterial wall and triggers inflammatory responses that promote atherosclerotic plaque formation and progression, while oxidative modification of LDL-cholesterol is directly implicated in the initiation of this process (1,2). According to the World Health Organization, raised cholesterol remains a major global risk factor for cardiovascular disease, and global burden estimates attribute millions of deaths annually to elevated cholesterol levels (3,4). A large body of consensus evidence now supports LDL-cholesterol as a causal, rather than merely correlative, driver of atherosclerotic cardiovascular disease(5).
Management of hyperlipidemia relies on both lifestyle modification and pharmacotherapy. Statins remain the first-line pharmacological agents, acting by competitive inhibition of HMG-CoA reductase; although highly effective, long-term statin therapy may be associated with adverse effects such as myalgia and myopathy, which can reduce patient adherence to treatment (6). These limitations have sustained continued interest in plant-based adjunct or complementary therapies. A systematic review of meta-analyses evaluating herbal medicines for dyslipidemia concluded that several botanical interventions produce statistically significant, though generally modest, reductions in total cholesterol and LDL-cholesterol compared with placebo(7), while a separate review of medicinal and edible plants used in dyslipidemia highlighted that many plant-derived agents act through complementary mechanisms, including bile-acid binding and antioxidant protection of circulating lipoproteins (8). Plants belonging to the family Asteraceae, in particular, have shown promising lipid-modulating properties, with Asteraceae-derived extracts commonly exhibiting antioxidant effects and favourable modulation of lipid parameters (9).
Galinsoga parviflora (Cav.), commonly known as gallant soldier, is an annual herb belonging to the family Asteraceae, widely distributed in tropical and temperate regions including India, and traditionally used in folk medicine for inflammatory, gastrointestinal, and metabolic disorders (10). Botanically, it is classified under the kingdom Plantae, division Magnoliophyta, class Magnoliopsida, order Asterales, family Asteraceae, and genus Galinsoga. It is a fast-growing, erect or prostrate herb with branched stems and shallow fibrous roots, typically reaching a height of 30–60 cm, bearing opposite, ovate-to-triangular leaves with serrated margins, small white flowers arranged in terminal capitula characteristic of the Asteraceae family, and small achene fruits that facilitate rapid propagation. It is commonly found growing as a weed in cultivated fields, roadsides, and wastelands across India, Central and South America, Africa, and Southeast Asia, owing to its rapid growth and broad environmental adaptability. The plant is reported to be rich in flavonoids, phenolic acids, and terpenoids, including quercetin derivatives, luteolin, caffeic acid, and chlorogenic acid, and modern pharmacological studies have confirmed significant antioxidant, anti-inflammatory, and antimicrobial activity for its extracts (10–12). Its major flavonoid constituents, quercetin and rutin, have shown cholesterol-modulating activity in vitro, up-regulating hepatic LDL-receptor expression and cellular cholesterol uptake, although such in vitro effects do not always translate into in vivo efficacy owing to limited oral bioavailability, and the broader cardiovascular pharmacology of quercetin continues to be an active area of investigation (13,14). Despite this promising phytochemical background, no previously published study has evaluated a standardized extract of Galinsoga parviflora formulated as a solid oral dosage form, nor has any study assessed its cholesterol-lowering potential using a direct, mechanistically distinct in vitro method such as bile acid binding.
Cholesterol is eliminated from the body chiefly through hepatic conversion to bile acids, which are secreted into the intestine and largely reabsorbed via the enterohepatic circulation. An agent capable of binding bile acids in the intestinal lumen interrupts this reabsorption, obligating increased hepatic synthesis of new bile acids from cholesterol and thereby lowering circulating LDL-cholesterol — the same principle exploited clinically by bile acid sequestrants such as cholestyramine(15,16). This in vitro screening approach has a long precedent, beginning with classical studies on dietary fibre (17) and subsequently extended to edible plant extracts (18) and phenolic-rich fruit and bark extracts (19,20). This precedent, together with the phytochemical richness of Galinsoga parviflora, made the species an attractive candidate for evaluating antioxidant- and bile-acid-mediated approaches to the management of hyperlipidemia. The principal objective of the present study was therefore to investigate the aerial parts of Galinsoga parviflora for antihyperlipidemic potential. During the course of the investigation, the extract was standardized and characterized, its in vitro antioxidant and bile acid binding activities were studied, and the extract was formulated as a tablet dosage form and evaluated in vitro.
Tablets remain the most widely used solid oral dosage form in pharmaceutical practice, owing to their convenience, dose accuracy, physical and chemical stability, ease of manufacture, and cost-effectiveness relative to other dosage forms such as decoctions, powders, or syrups (21). This approach is consistent with recent efforts to translate standardized botanical extracts into stable, evaluable pharmaceutical dosage forms, such as topical herbal gel formulations of Calendula officinalis extract (22). In herbal formulation development specifically, converting a standardized plant extract into a tablet offers considerable advantages: it enables precise, reproducible dosing of a complex, multi-component botanical material; it improves the physical and chemical stability of otherwise hygroscopic or oxidation-prone plant constituents; and it supports the kind of pharmacopoeial quality control weight variation, hardness, friability, and disintegration testing that is a prerequisite for any credible future clinical evaluation of a herbal medicine(23). Because herbal extracts are typically amorphous, bulky, and poor-flowing powders, direct compression is rarely feasible without extensive excipient optimization; wet granulation, as adopted in the present study, is the more commonly used and more robust manufacturing route for extract-rich tablet formulations, since it improves the flow, packing, and compressibility of the powder blend prior to compression (21). Selection of an immediate-release format, rather than a delayed- or modified-release design, was considered appropriate at this early formulation-development stage, since the objective of the present study was to characterize the fundamental pharmaceutical and phytochemical properties of a first Galinsoga parviflora tablet formulation, prior to any more elaborate release-modifying design that might be considered in future work.
Beyond the pharmaceutical rationale, the choice of in vitro evaluation parameters in the present study was made deliberately to build a complementary, two-pronged case for antihyperlipidemic potential. Total phenolic content and total flavonoid content were determined first, to provide a quantitative phytochemical standardization baseline for the extract, expressed respectively as gallic acid equivalents and quercetin equivalents per gram of dry extract; these are the two most widely reported indices of a plant extract's antioxidant potential and allow direct, quantitative comparison with prior phytochemical reports on the Galinsoga genus. Building on this standardization, the DPPH radical scavenging assay was used to test the extract's free-radical-scavenging capacity directly, since oxidative modification of LDL-cholesterol within the arterial wall is a key initiating step in atherogenesis, and an extract capable of scavenging free radicals in vitro is considered to have plausible potential to protect LDL from oxidative modification in vivo. Independently of this antioxidant route, the in vitro bile acid binding assay was included to test a second, mechanistically distinct and clinically well-validated cholesterol-lowering pathway directly, namely interruption of the enterohepatic recirculation of bile acids, benchmarked against the same principle exploited by the clinically used bile acid sequestrant cholestyramine. Taken together, these four determinations TPC, TFC, DPPH, and bile acid binding were selected specifically because no combination of them has previously been reported for Galinsoga parviflora, despite the species' well-documented phenolic and flavonoid richness.
2. MATERIALS AND METHODS
2.1 Collection and Authentication of Plant Material
The aerial parts of Galinsoga parviflora (Cav.) were collected from Chailchowk, Mandi district, Himachal Pradesh, India, in September 2025. The plant was authenticated by Dr. Ved Prakash, Assistant Professor, Department of Botany, Government College Bassa, Gohar, Mandi (H.P.). Microcrystalline cellulose, lactose, and PVP K-30 were procured from standard pharmaceutical-grade chemical suppliers, and all other chemicals and reagents used were of analytical reagent grade.
All instruments used for extraction, formulation, and evaluation were routinely calibrated prior to use. Key instruments included a digital analytical balance, Soxhlet apparatus with heating mantle, hot air oven, mechanical grinder and sieve shaker, single-punch tablet compression machine, UV–Visible spectrophotometer, HPLC system with UV detector, USP Type II dissolution apparatus, tablet hardness tester, Roche friabilator, USP/IP disintegration apparatus, digital Vernier caliper, pH meter, magnetic stirrer, centrifuge, and thermostatic water bath/incubator. Key reagents included absolute ethanol; microcrystalline cellulose and lactose (diluents); PVP K-30 (binder); sodium starch glycolate and starch (disintegrant/binder); talc and magnesium stearate (glidant/lubricant); Folin–Ciocalteu reagent and gallic acid (for TPC); aluminium chloride and quercetin (for TFC); DPPH and ascorbic acid (antioxidant assay); Dragendorff's, Mayer's, and Wagner's reagents (alkaloid screening); and sodium cholate, furfural, and cholestyramine resin (bile acid binding assay).
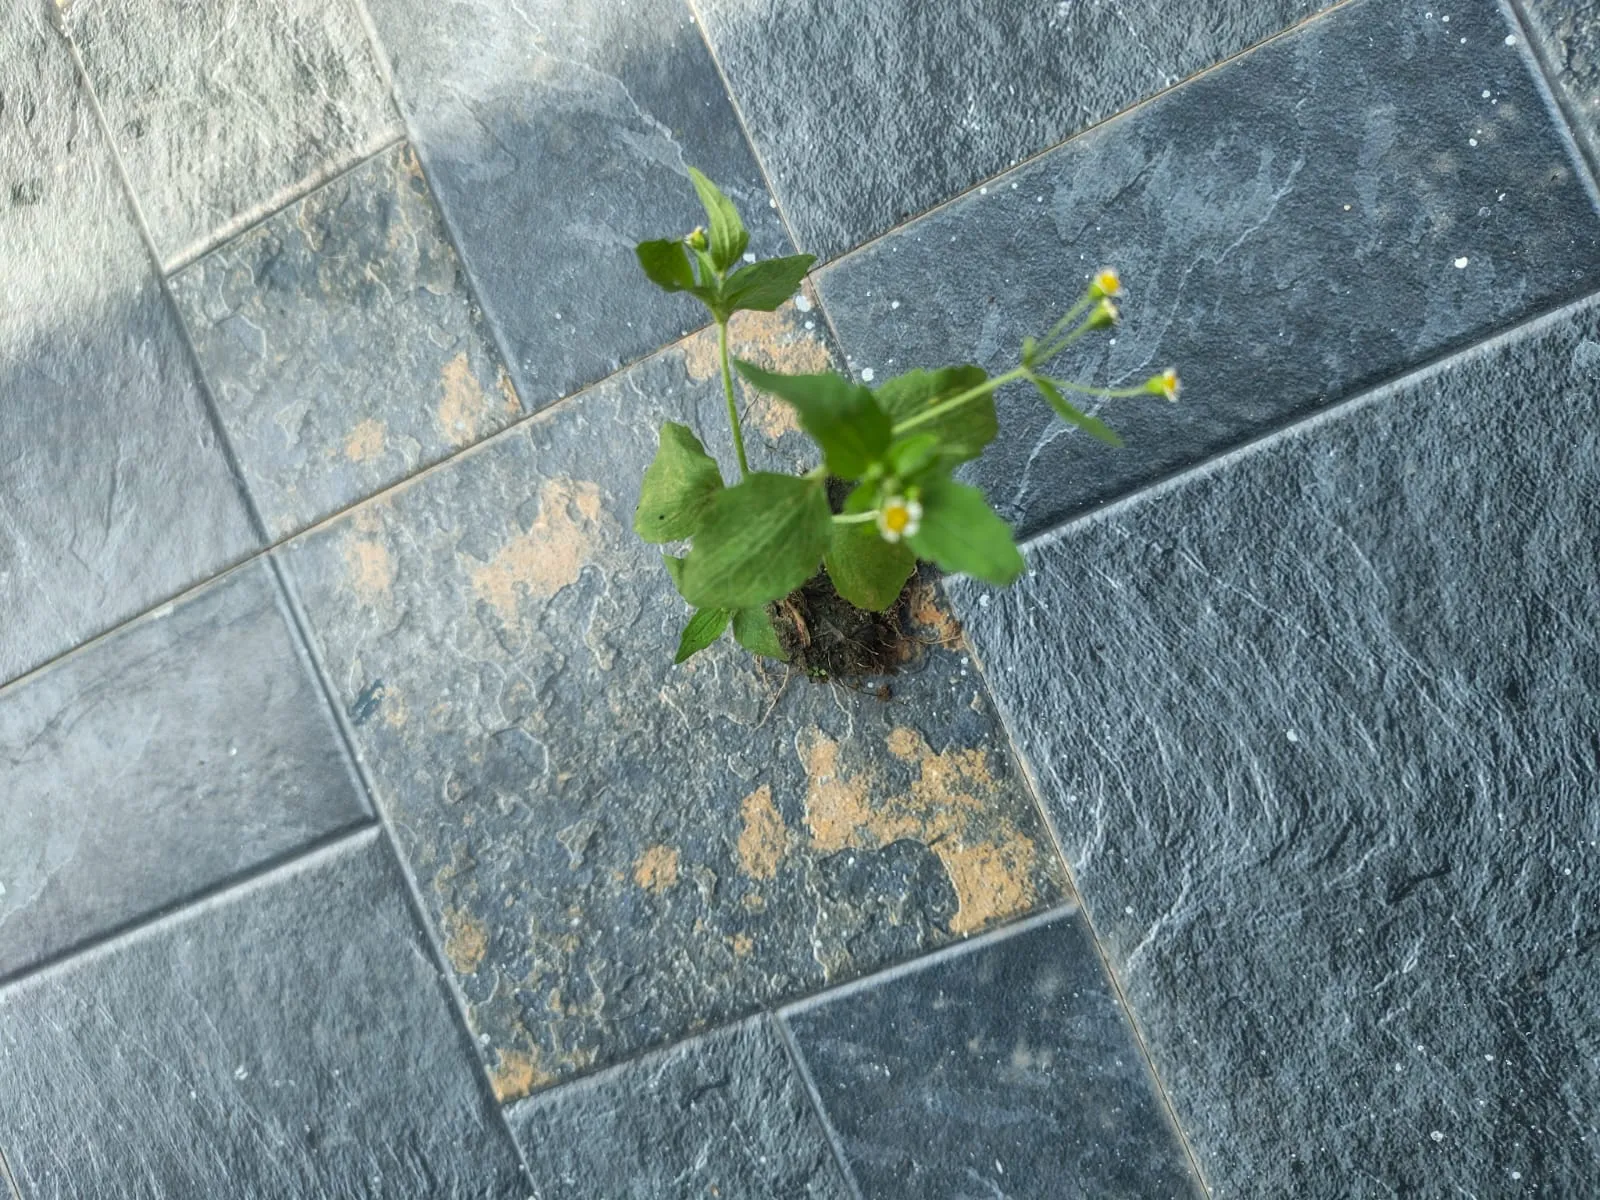
Fig. 1. Galinsoga parviflora plant in its natural habitat.
2.2 Extraction of Plant Material
Phytochemical screening of the plant material was carried out to identify the classes of active constituents present. Extraction was performed by hot continuous extraction (Soxhlet), using: (i) a Soxhlet apparatus; (ii) absolute ethanol; (iii) distilled water; and (iv) shade-dried coarse powder of the aerial parts of Galinsoga parviflora.
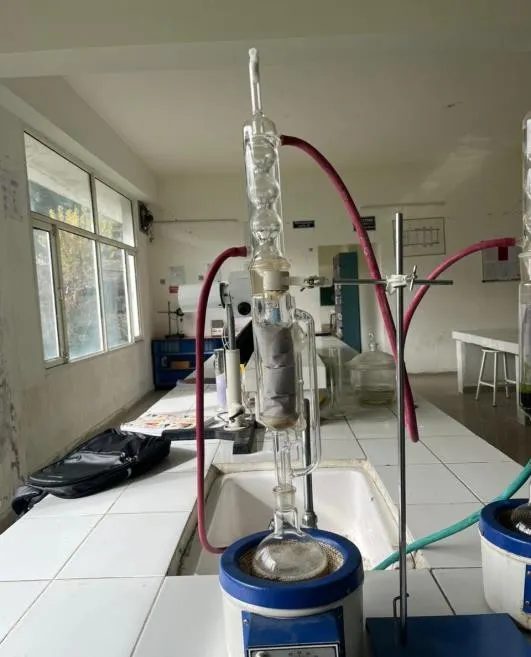
Fig. 2. Hot continuous extraction (Soxhlet) setup.
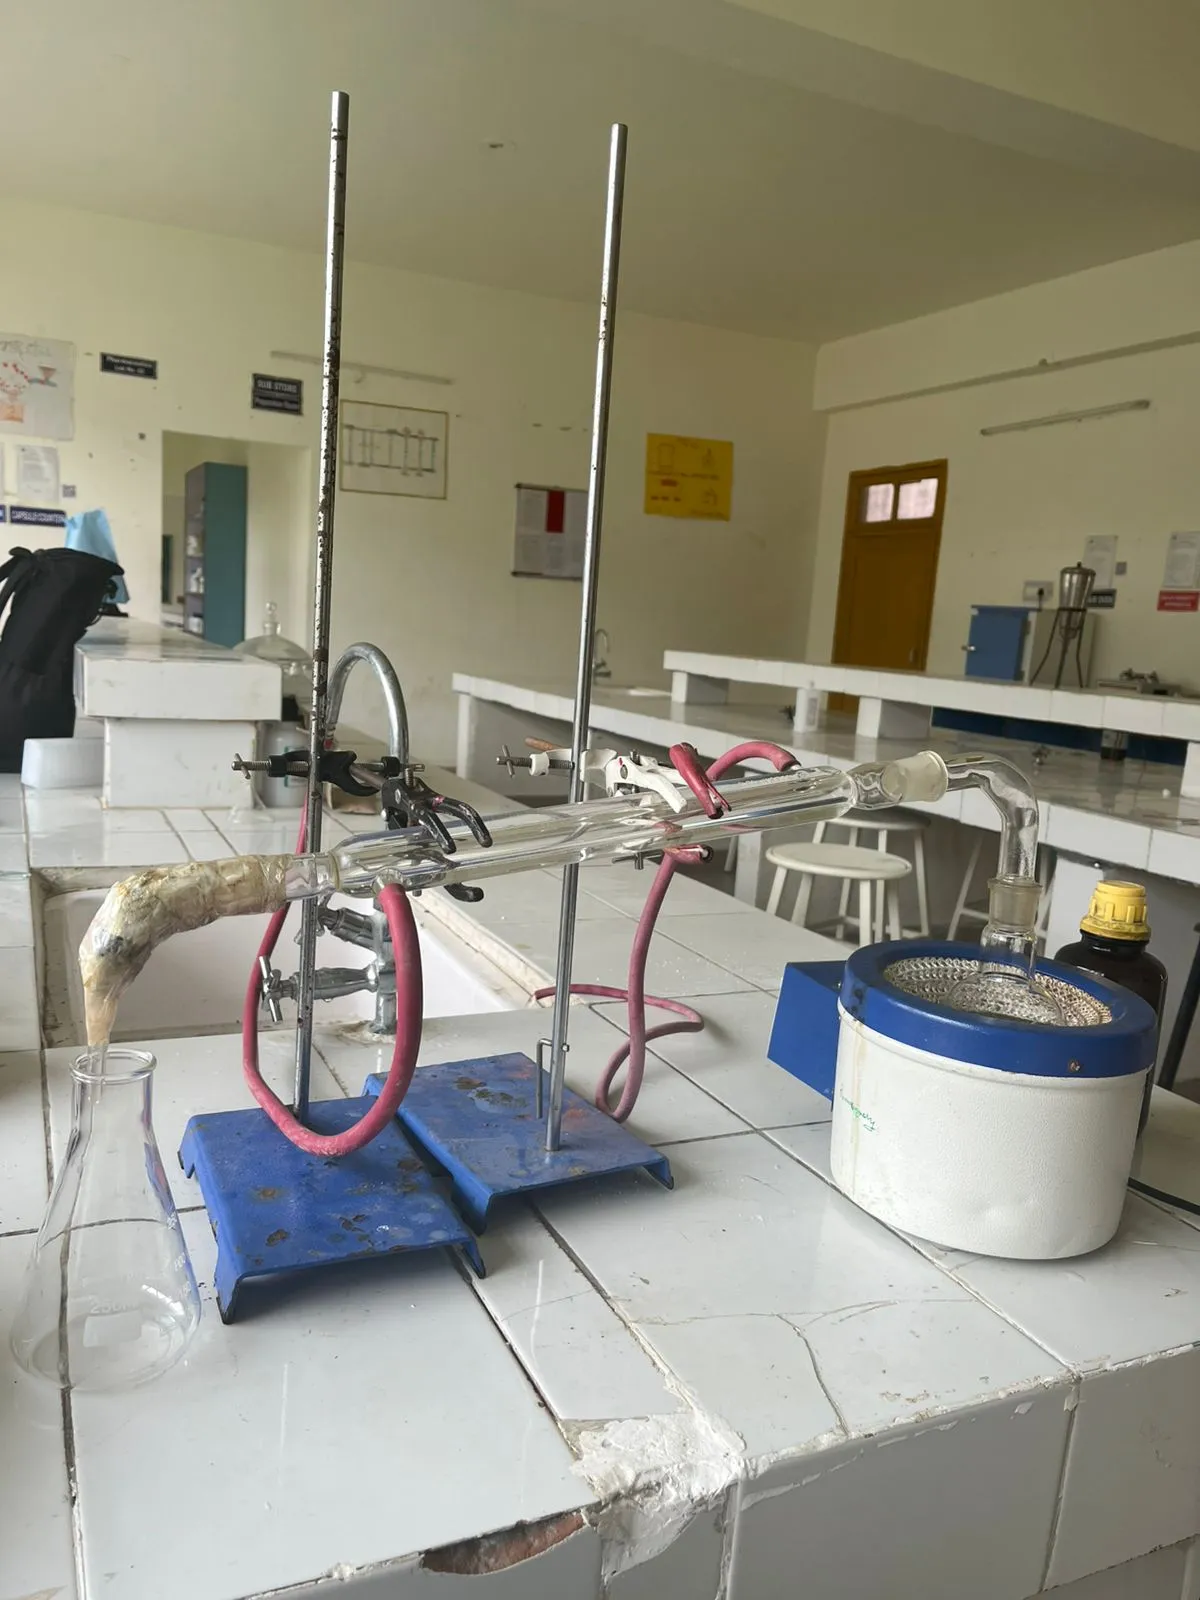
Fig. 3. Soxhlet extraction in progress.
The shade-dried, coarsely powdered aerial parts of Galinsoga parviflora (approximately 60 g) were extracted with absolute ethanol at reflux temperature until the siphoning solvent became colourless. Following completion of extraction, the solvent was removed by re-distillation, yielding a semi-solid residue, which was dried to constant weight and stored in a desiccator (24). Ethanol was selected as the extraction solvent because it provides broad-spectrum recovery of both moderately polar phenolic and flavonoid constituents and moderately non-polar terpenoid constituents reported for Asteraceae species, while its volatility also facilitates subsequent solvent removal. Soxhlet extraction was preferred over simple maceration because it allows repeated, continuous contact of the plant matrix with fresh condensed solvent as the solvent cycles through the thimble, improving overall extraction efficiency while requiring a comparatively smaller total solvent volume than exhaustive maceration would demand (24). The plant material was authenticated prior to extraction, since the reliability of any subsequent phytochemical or pharmacological finding is contingent on unambiguous identification of the source species, and the aerial parts were shade-dried, rather than oven- or sun-dried, specifically to minimize thermal and photochemical degradation of thermolabile phenolic and flavonoid constituents prior to extraction.
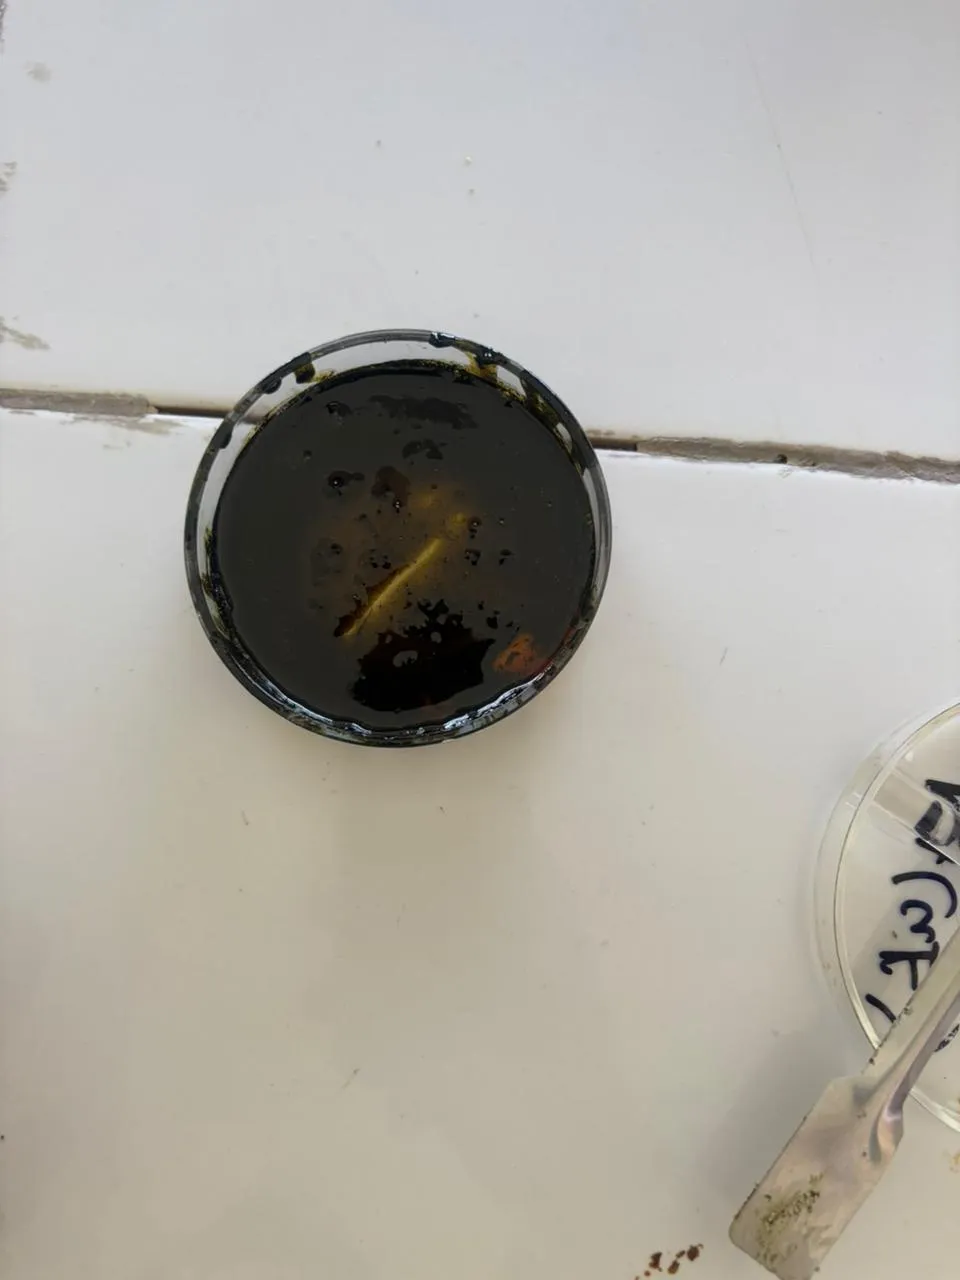
Fig. 4. Dried ethanolic extract of Galinsoga parviflora.
The percentage yield of the extract was calculated from the weight of dried extract obtained relative to the weight of dried plant powder subjected to extraction and was found to be 18% w/w.
2.3 Physicochemical Evaluation — Loss on Drying
Loss on drying (LOD) was determined to assess the residual moisture content of the dried extract. About 5 g of the powdered extract was dried in a hot air oven at 105°C until constant weight, cooled in a desiccator, and re-weighed; LOD (%) = [(W1 − W2)/W1] × 100. The extract showed an LOD of 3.40%, indicating good physical stability on storage.
2.4 Qualitative Phytochemical Screening
Phytochemical tests were performed using standard colouration and precipitation reactions(25). Alkaloids were tested by Dragendorff's test; flavonoids by the lead acetate test; phenols and tannins by the ferric chloride test; saponins by the froth test; glycosides by the Keller–Killiani test; and terpenoids by the Salkowski test.
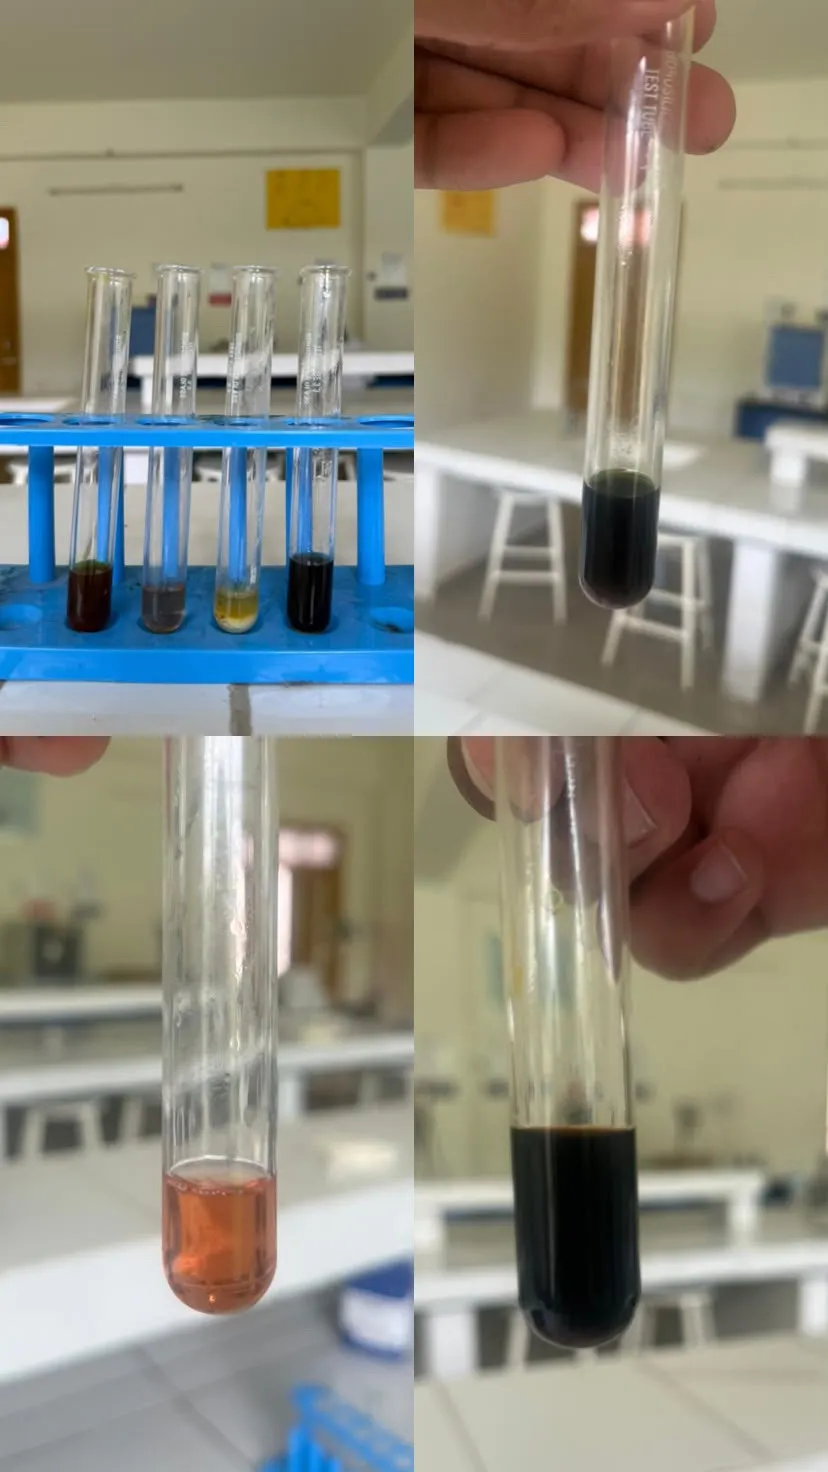
Fig. 5. Phytochemical screening tests performed on the ethanolic extract.
2.5 Pre-Formulation Studies
The flowability of the granule blend is a vital parameter to be measured, since it influences the uniformity of dose. Poor flow and compressibility are common characteristics of amorphous, extract-rich powder blends, and pre-compression evaluation of the granules is therefore essential before proceeding to tablet compression, since granules that flow and pack poorly tend to give tablets with inconsistent weight, hardness, and content uniformity. Flow was assessed using the following parameters (26,27):
(a) Angle of repose: determined by the fixed funnel method. Granules were allowed to pass through a funnel positioned at a fixed height above a level surface, and the angle of repose was calculated as θ = tan⁻¹(h/r), where h = height of the powder pile and r = radius of the pile.
(b) Bulk density: a precisely measured quantity of granules was transferred to a graduated measuring cylinder and the initial (bulk) volume recorded; Bulk density = Mass of powder / Bulk volume.
(c) Tapped density: the granule-filled measuring cylinder was mechanically tapped until a constant volume was achieved, and the final (tapped) volume recorded; Tapped density = Mass of powder / Tapped volume.
(d) Carr's compressibility index: Carr's Index (%) = [(Tapped density − Bulk density)/Tapped density] × 100.
(e) Hausner's ratio: Hausner's Ratio = Tapped density / Bulk density.
2.6 Formulation of Tablets
The standardized ethanolic extract was blended with the required excipients and compressed into tablets by the wet granulation method. Four formulations (F1–F4) were prepared, varying the concentration of the binder PVP K-30 across the series, while microcrystalline cellulose was adjusted to maintain a constant unit tablet weight of 500 mg. The composition of each formulation is presented in Table 1.
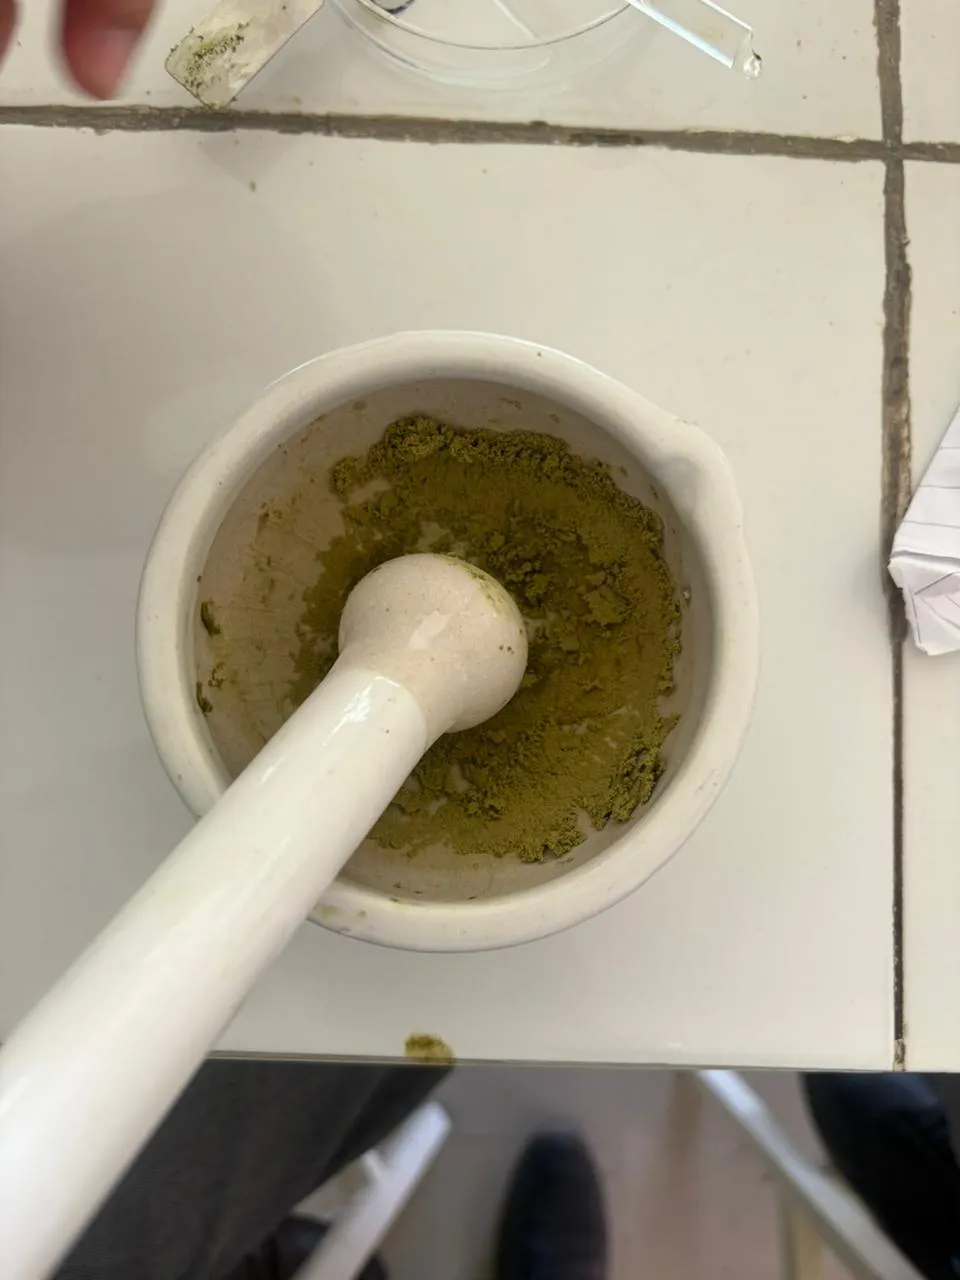
Fig. 6. Ethanolic extract blended with excipients prior to granulation.
Table 1. Composition of Galinsoga parviflora herbal tablets (mg per tablet).
|
Ingredient |
F1 |
F2 |
F3 |
F4 |
|
Galinsoga parviflora extract |
250 |
250 |
250 |
250 |
|
Microcrystalline cellulose (MCC) |
90 |
85 |
80 |
75 |
|
Lactose |
70 |
70 |
70 |
70 |
|
PVP K-30 (binder) |
15 |
20 |
25 |
30 |
|
Sodium starch glycolate |
20 |
20 |
20 |
20 |
|
Starch |
40 |
40 |
40 |
40 |
|
Talc |
10 |
10 |
10 |
10 |
|
Magnesium stearate |
5 |
5 |
5 |
5 |
|
Total weight |
500 |
500 |
500 |
500 |
The extract and excipients were blended and granulated using an aqueous solution of PVP K-30 as binder, dried at 60°C, re-sieved, lubricated with talc and magnesium stearate, and compressed on a single-punch tablet compression machine (21). Wet granulation was selected over direct compression because the extract-rich powder blend exhibited poor inherent flow and compressibility on preliminary handling — a common characteristic of amorphous, hygroscopic plant-extract powders — and granulation is well established to improve the flow, compressibility, and content uniformity of such extract-based formulations prior to compression. The concentration of PVP K-30 binder was deliberately varied across the four batches (15–30 mg/tablet) because binder concentration is a principal determinant of granule strength, tablet hardness, and disintegration behaviour in wet-granulated herbal tablets, allowing the effect of this key formulation variable on tablet quality and dissolution to be directly compared across the F1–F4 series. Binder selection and concentration are established determinants of granule cohesion and tablet quality in natural-excipient-based formulations, as reported for other indigenous binding and mucilaginous agents characterized for pharmaceutical use(28,29).
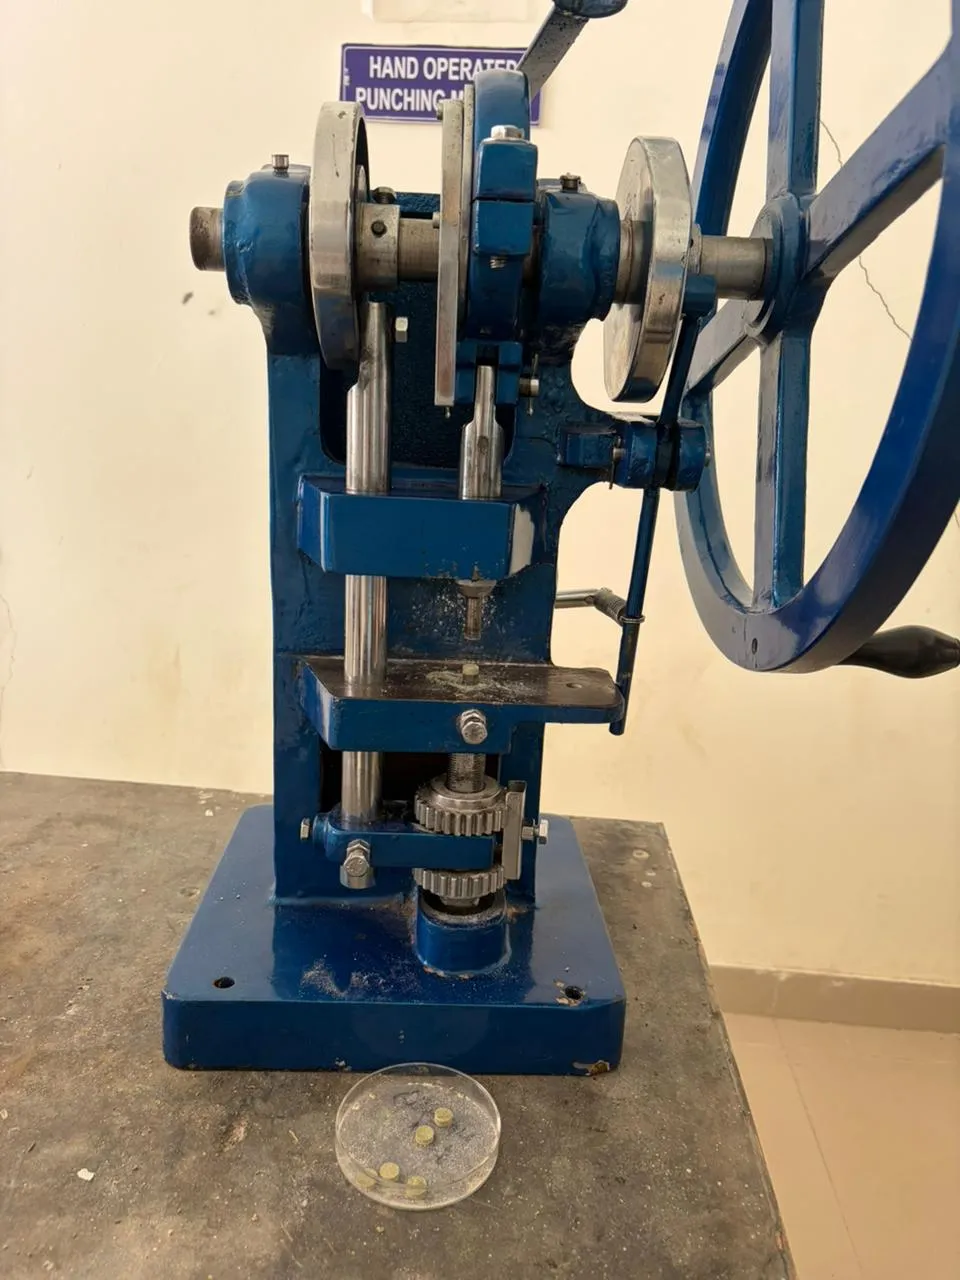
Fig. 7. Single-punch tablet compression machine.
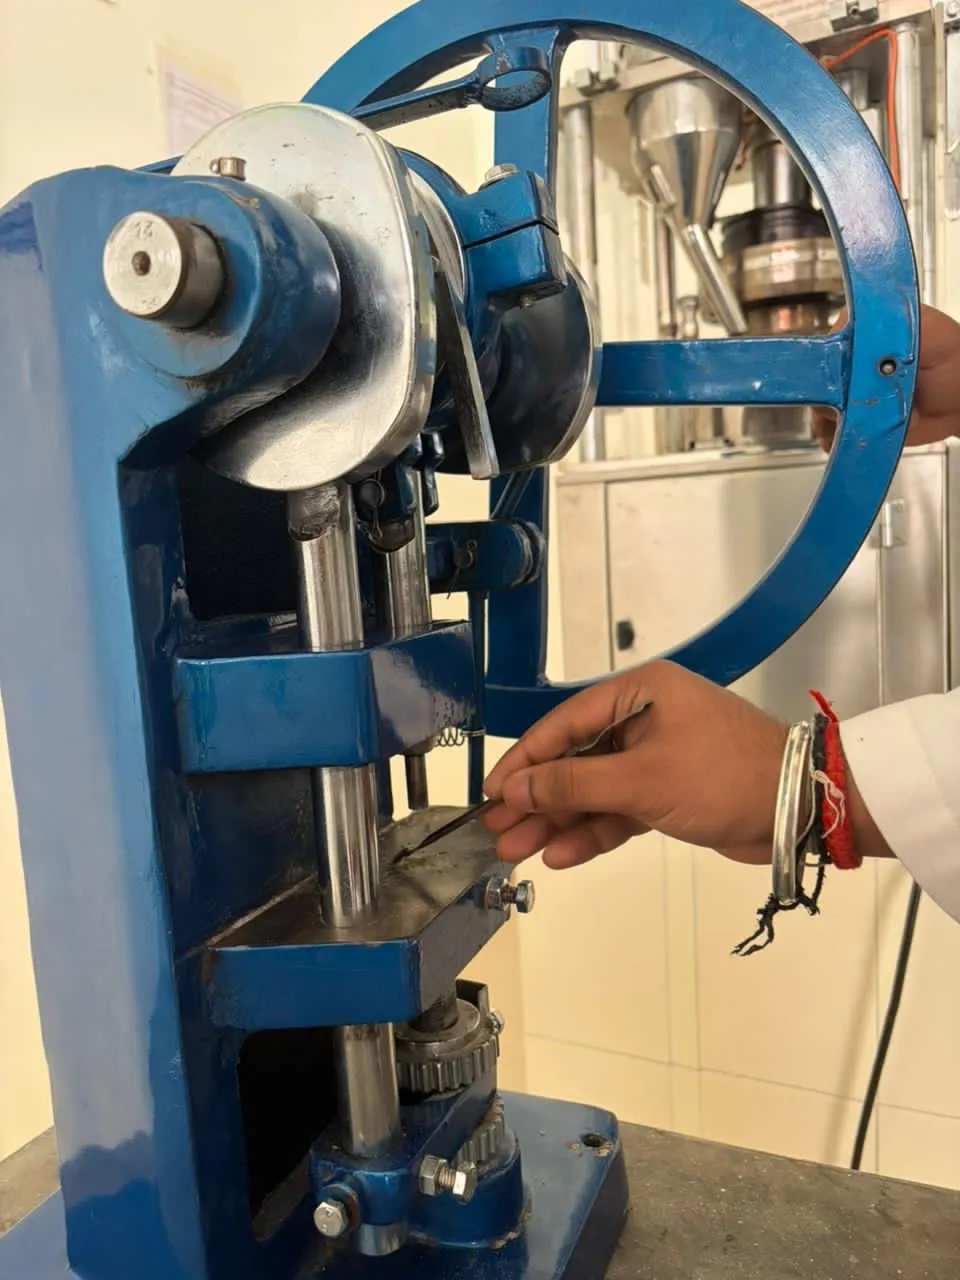
Fig. 8. Compression of the herbal tablets.
2.7 Evaluation of Post-Compression Tablets
General appearance: The general appearance of the tablets from every formulation batch was observed, including shape, colour, and presence or absence of odour and taste.
Weight variation test: Twenty tablets from each batch were individually weighed on a digital balance; the average weight was computed and compared with individual tablet weights, and the percentage deviation was assessed against the pharmacopoeial limit of ±5% applicable to tablets with an average weight of more than 250 mg (23).
Thickness test: A Vernier caliper was used to measure tablet thickness; the average thickness was determined from randomly selected tablets.
Hardness test: A tablet hardness tester was used to measure tablet hardness (kg/cm²), averaged over randomly selected tablets, with an acceptable range of 4–10 kg/cm² for uncoated herbal tablets.
Friability test: The Roche friabilator was used; pre-weighed tablets were dedusted and rotated at 25 rpm for four minutes (100 revolutions), then dedusted again and reweighed; Friability (%) = [(W1 − W2)/W1] × 100, with a value below 1% considered acceptable.
Disintegration test: A USP/IP disintegration apparatus was used; the time taken for tablets to disintegrate completely was noted, using distilled water maintained at 37 ± 2°C, in the absence of a disc, with a disintegration time of less than 30 minutes prescribed for uncoated tablets.
2.8 Characterization of the Extract (UV–Visible Spectrophotometry and HPLC)
A stock solution of the dried ethanolic extract was prepared in methanol and scanned over the wavelength range of 200–800 nm using a UV–Visible spectrophotometer, with methanol as the blank, to determine the characteristic absorption maximum (λmax) of the extract. The identified λmax was subsequently used as the analytical wavelength for quantitative estimation of the released extract during the in vitro dissolution study. The ethanolic extract was additionally subjected to reverse-phase HPLC fingerprint analysis using a C18 column with acetonitrile–water as the mobile phase under gradient elution, with detection by a variable-wavelength detector set at 247 nm, corresponding to the λmax established for the extract, to characterize the phytochemical profile of the extract and establish a characteristic fingerprint for batch-to-batch quality evaluation. No authentic reference standards (e.g., rutin, quercetin, chlorogenic acid) were co-injected under identical chromatographic conditions in the present run; consequently, the chromatogram was used strictly as a qualitative fingerprint of the extract rather than for peak-level compound identification, consistent with standard fingerprinting practice for complex herbal extracts (12,25).
2.9 In Vitro Dissolution Study
The in vitro dissolution study of the prepared herbal tablets was carried out using a USP Type II (paddle) dissolution apparatus. Phosphate buffer (pH 6.8, 900 mL), maintained at 37 ± 0.5°C, was used as the dissolution medium, with the paddle speed maintained at 50 rpm. At predetermined time intervals, aliquots of the dissolution medium were withdrawn, filtered, suitably diluted, and analysed spectrophotometrically at the predetermined λmax of the extract (247 nm) against a calibration curve of the extract prepared in phosphate buffer pH 6.8, with an equal volume of fresh medium replaced to maintain sink conditions. Cumulative extract release (%) = (Amount of extract released / Total amount of extract present in the tablet) × 100, and the dissolution profiles of formulations F1–F4 (each performed in triplicate, n = 3, and reported as mean ± SD) were compared to identify the optimized formulation.
All phytochemical and biological assays — total phenolic content, total flavonoid content, DPPH radical scavenging, and in vitro bile acid binding — were performed in triplicate (n = 3), and results are reported throughout as mean ± standard deviation (SD).
3. IN VITRO ANTIHYPERLIPIDEMIC PARAMETERS
3.1 Total Phenolic Content (TPC)
Principle: The Folin–Ciocalteu reagent, a mixture of phosphomolybdate and phosphotungstate, is reduced by phenolic hydroxyl groups present in the extract under alkaline conditions to form a blue-coloured complex, the intensity of which is proportional to the total phenolic content (30).
Procedure: Folin–Ciocalteu reagent was diluted 1:10 with distilled water. A stock solution of gallic acid (1 mg/mL) was prepared in methanol and serially diluted to 20–100 µg/mL. An aliquot (0.5 mL) of extract or standard was mixed with 2.5 mL of diluted Folin–Ciocalteu reagent, allowed to stand for 5 minutes, then 2 mL of 7.5% sodium carbonate solution was added and the mixture incubated in the dark for 30 minutes. Absorbance was measured at 765 nm against a reagent blank. TPC was calculated from the regression equation of the gallic acid calibration curve and expressed as mg gallic acid equivalents (GAE)/g dry extract.
3.2 Total Flavonoid Content (TFC)
Principle: Aluminium chloride forms a stable complex with the C-4 keto group and C-3/C-5 hydroxyl group of flavonoids, producing a yellow colour that is measurable spectrophotometrically(31).
Procedure: A stock solution of quercetin (1 mg/mL) was prepared in methanol and serially diluted to 10–50 µg/mL. An aliquot (0.5 mL) of extract or standard was mixed with 1.5 mL methanol, 0.1 mL of 10% aluminium chloride, 0.1 mL of 1 M potassium acetate, and 2.8 mL distilled water, and allowed to stand for 30 minutes. Absorbance was measured at 415 nm against a reagent blank. TFC was calculated from the regression equation of the quercetin calibration curve and expressed as mg quercetin equivalents (QE)/g dry extract.
3.3 DPPH Radical Scavenging Assay
Principle: DPPH is a stable, deep-violet free radical. Hydrogen-donating antioxidants in the extract reduce DPPH to the pale-yellow diphenylpicrylhydrazine, and the resulting decrease in absorbance indicates radical-scavenging capacity (32).
Procedure: A 0.1 mM solution of DPPH was prepared in methanol and protected from light in an amber-coloured bottle. A stock solution of the dried ethanolic extract was prepared in methanol at a concentration of 1 mg/mL; working solutions of the extract, and separately of ascorbic acid (reference standard), at concentrations of 10, 20, 40, 60, 80, and 100 µg/mL were prepared by appropriate dilution of the respective stock solutions with methanol. One millilitre of each sample solution was mixed with 3 mL of DPPH solution, vortexed, and incubated in the dark for 30 minutes. Absorbance was measured at 517 nm against a methanol blank. % Inhibition = [(Acontrol − Asample)/Acontrol] × 100, where Acontrol is the absorbance of the control and Asample is the absorbance of the sample. The resulting percentage inhibition values were plotted against concentration to generate dose–response curves, and the concentration-dependent trends for the extract and the reference standard were compared to assess relative antioxidant activity.
3.4 In Vitro Bile Acid Binding Assay
Principle: As cholesterol is eliminated from the body chiefly through hepatic conversion to bile acids that are secreted into the intestine and largely reabsorbed via the enterohepatic circulation, an agent that binds bile acids in the intestinal lumen interrupts this reabsorption, forcing increased hepatic synthesis of new bile acids from cholesterol and thereby lowering circulating LDL-cholesterol — the mechanism exploited by bile acid sequestrants such as cholestyramine (15,16).
Procedure: A working sodium cholate solution (1.0 mg/mL) was prepared in phosphate buffer (pH 7.0). The extract was prepared in phosphate buffer (pH 7.0) at concentrations of 0.5, 1.0, 1.5, 2.0, and 3.0 mg/mL, with cholestyramine resin used as the positive control across the same concentration range(17–19). An aliquot of extract or cholestyramine was mixed with an equal volume of bile acid solution and incubated at 37 ± 0.5°C for 1 hour, then centrifuged. The unbound bile acid in the supernatant was quantified colorimetrically by the furfural–sulphuric acid method at 510–620 nm, using a sodium cholate calibration curve. % Bile acid binding = [(Initial bile acid concentration − Unbound bile acid concentration)/Initial bile acid concentration] × 100.
4. RESULTS
4.1 Percentage Yield
About 60 g of dried, powdered aerial parts of Galinsoga parviflora was extracted with ethanol using a Soxhlet apparatus, yielding 10.8 g of dried extract, corresponding to a percentage yield of 18% w/w.
4.2 Preliminary Phytochemical Analysis
Qualitative phytochemical screening of the ethanolic extract revealed the presence of phenols, terpenoids, flavonoids, and tannins, while glycosides, alkaloids, and saponins were not detected (Table 2).
Table 2. Preliminary phytochemical analysis of the ethanolic extract.
|
Test |
Result |
|
Phenols |
+ |
|
Terpenoids |
+ |
|
Flavonoids |
+ |
|
Tannins |
+ |
|
Glycosides |
− |
|
Alkaloids |
− |
|
Saponins |
− |
4.3 Pre-Formulation Studies
The angle of repose of formulations F1–F4 ranged from 27.18° to 29.42°; bulk density ranged from 0.44 to 0.47 g/mL and tapped density from 0.51 to 0.53 g/mL; Carr's index ranged from 11.32% to 13.72%, and Hausner's ratio from 1.13 to 1.16, all within acceptable limits for good flow (Table 3).
Table 3. Pre-formulation (micromeritic) properties of herbal extract granules (F1–F4).
|
Parameter |
F1 |
F2 |
F3 |
F4 |
|
Angle of repose (°) |
29.42 |
28.61 |
27.86 |
27.18 |
|
Bulk density (g/mL) |
0.44 |
0.45 |
0.46 |
0.47 |
|
Tapped density (g/mL) |
0.51 |
0.52 |
0.52 |
0.53 |
|
Hausner's ratio |
1.16 |
1.15 |
1.14 |
1.13 |
|
Carr's index (%) |
13.72 |
13.46 |
11.54 |
11.32 |
4.4 Evaluation of Herbal Tablets
Table 4. General appearance of the herbal tablets.
|
Parameter |
Observation |
|
Appearance |
Round, uncoated tablet |
|
Colour |
Olive green |
|
Odour |
Characteristic odour |
|
Taste |
Bitter |
|
Shape |
Round |
Table 5. Post-compression evaluation of the herbal tablets (F1–F4).
|
Parameter |
F1 |
F2 |
F3 |
F4 |
|
Weight variation (mg) |
499.4 |
500.3 |
500.8 |
499.8 |
|
Hardness (kg/cm²) |
4.72 |
5.35 |
5.81 |
6.38 |
|
Thickness (mm) |
4.21 |
4.24 |
4.27 |
4.31 |
|
Diameter (mm) |
8.98 |
9.00 |
9.00 |
9.01 |
|
Friability (%) |
0.77 |
0.63 |
0.46 |
0.34 |
|
Disintegration time (min) |
6.05 |
6.88 |
7.74 |
8.96 |
Hardness increased and friability decreased progressively from F1 to F4 with increasing PVP K-30 concentration, reflecting the binder's role in strengthening interparticulate bonds, while disintegration time increased correspondingly but remained well within the pharmacopoeial limit for uncoated tablets.
4.5 UV–Visible Spectral Analysis
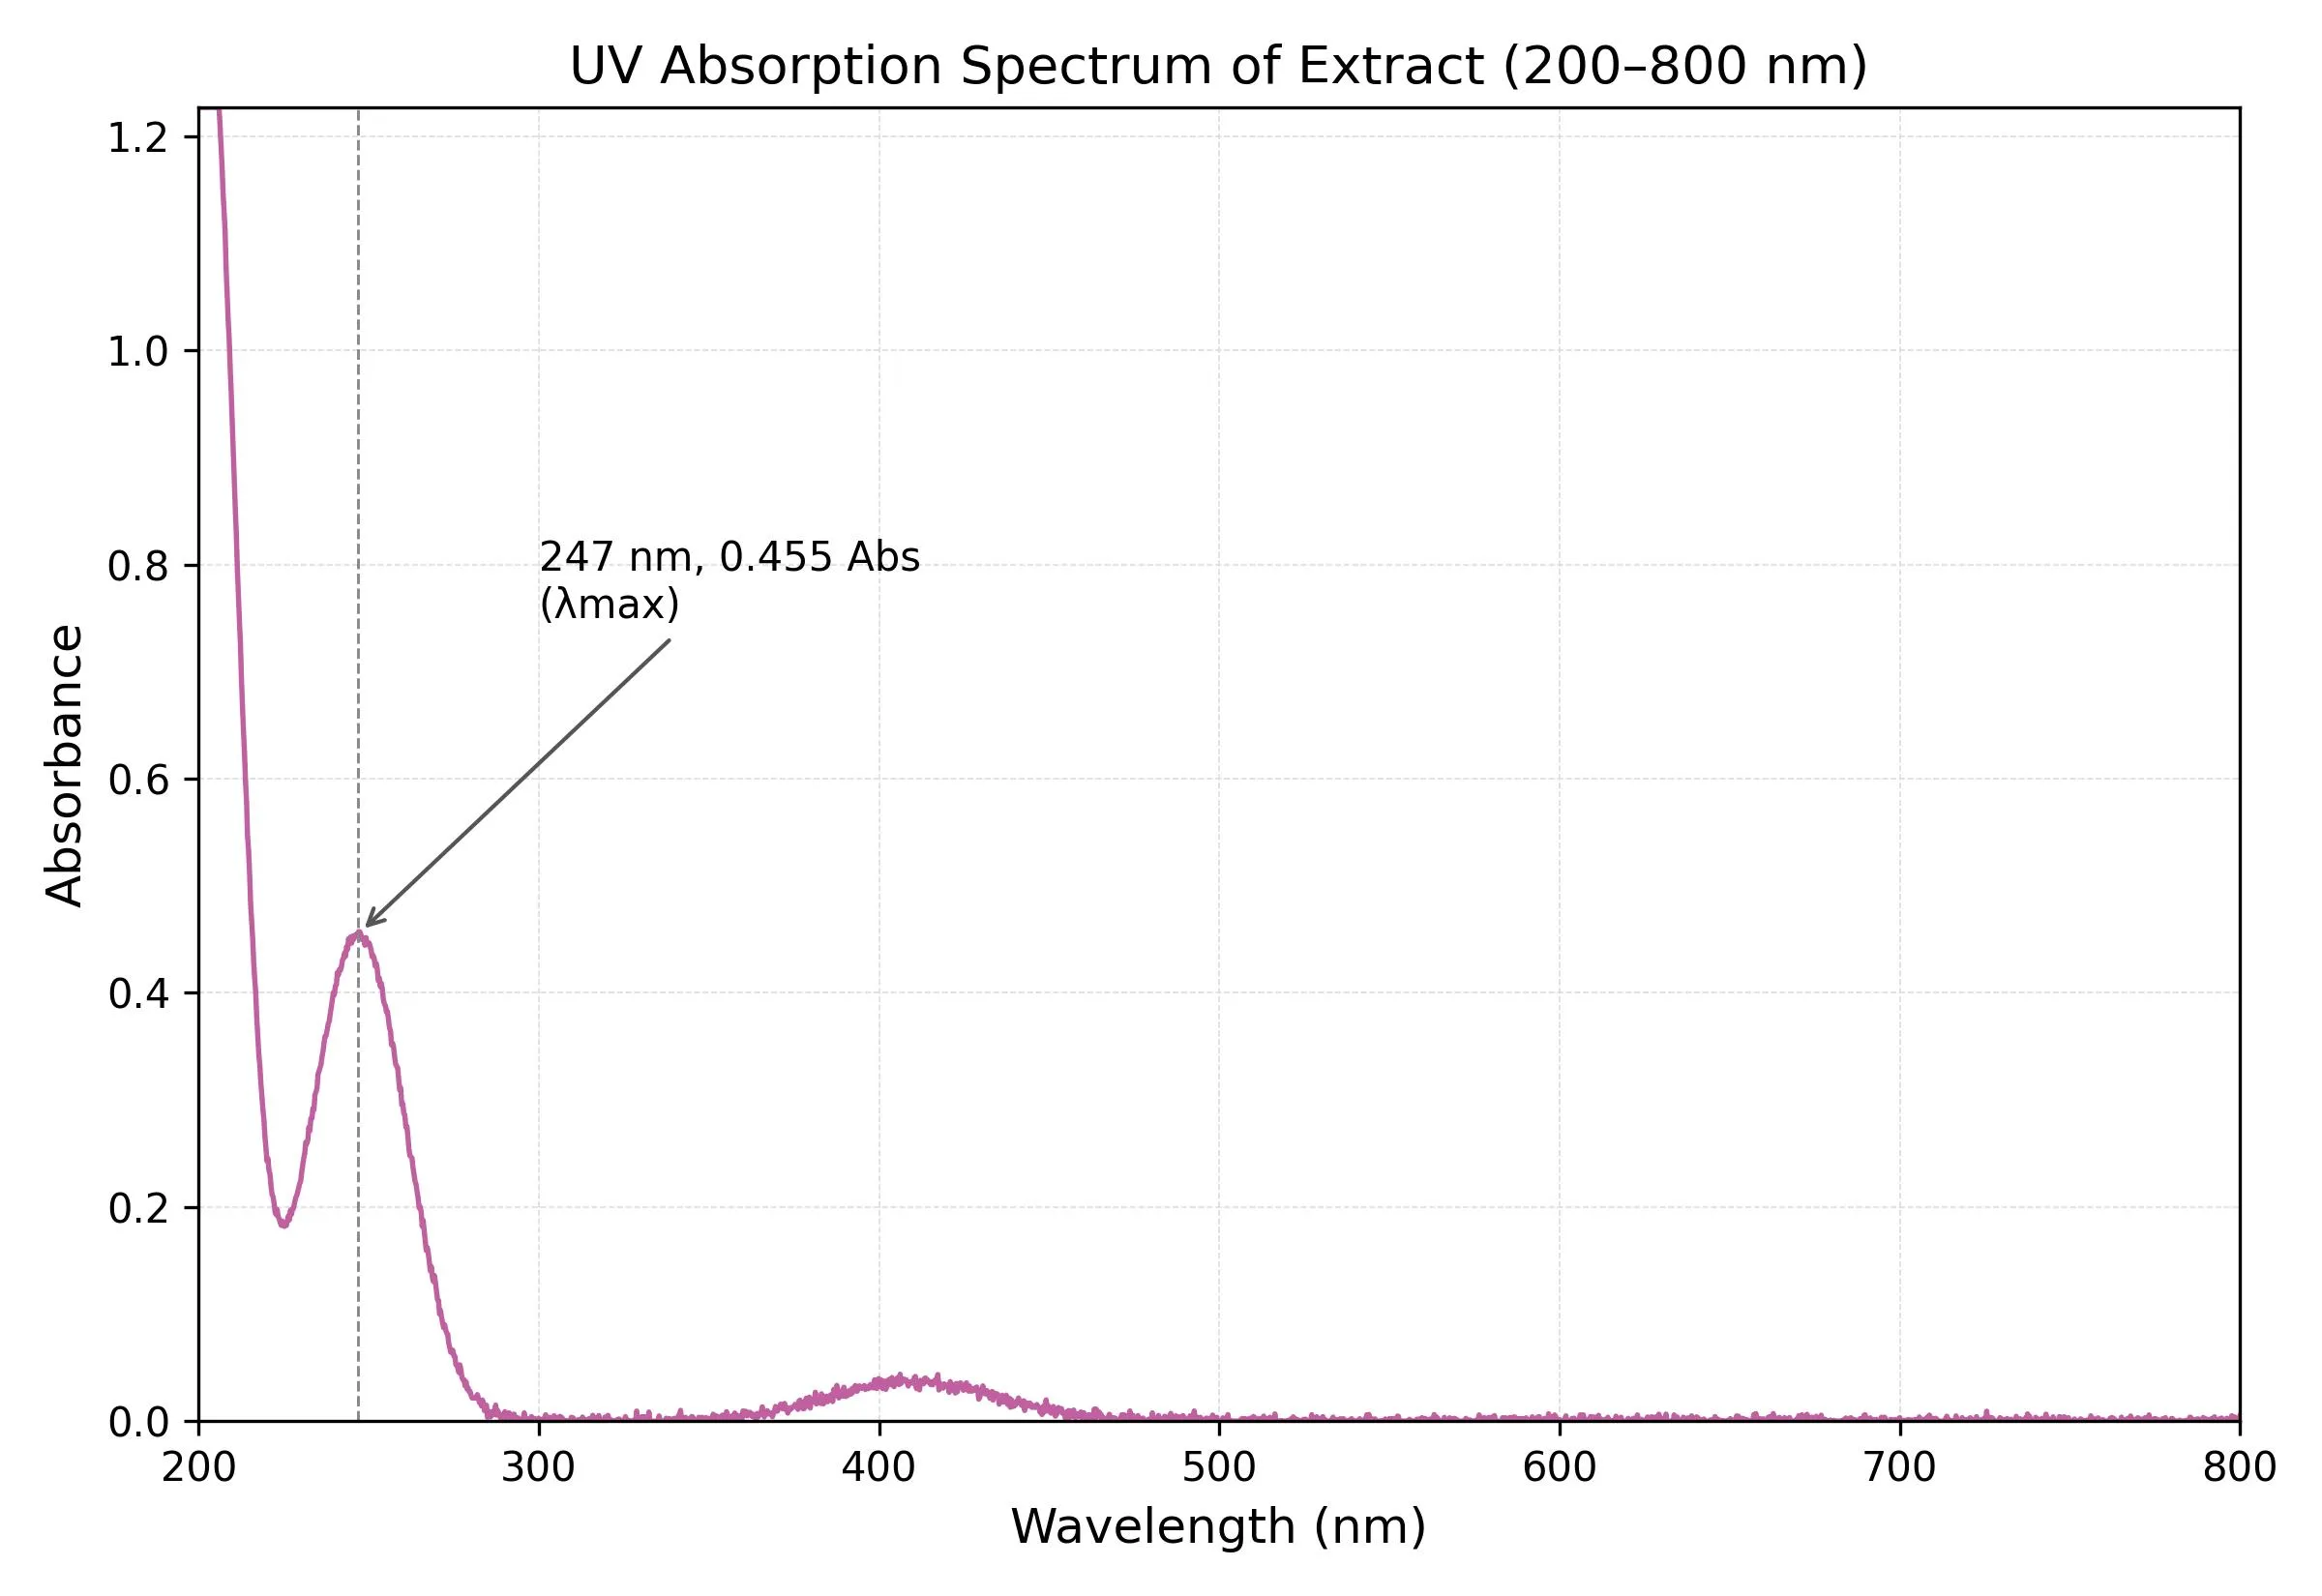
Fig. 9. UV–Visible absorption spectrum (200–800 nm) of the ethanolic extract of Galinsoga parviflora in methanol, showing λmax at 247 nm (Abs = 0.455).
The UV–Visible spectrum of the extract, recorded in methanol against a methanol blank, showed a single, well-resolved absorption maximum at 247 nm, with a peak absorbance of 0.455, preceded by a minimum at approximately 225 nm (absorbance ≈ 0.19). A second, considerably weaker and broader band was observed in the visible region, centred around 400–420 nm, with an absorbance of only about 0.04–0.05; given its low intensity and breadth, this band is attributed to minor pigment or background chromophores present in the crude extract rather than to a distinct, well-defined electronic transition.
The identified λmax of 247 nm is somewhat blue-shifted relative to the 260–290 nm and 320–370 nm regions classically associated with the aromatic A- and B-rings of the flavonoid nucleus (25). This suggests that, while flavonoid-type constituents may be present, the UV absorption of the extract in this batch is likely dominated by other conjugated phenolic chromophores absorbing in the 240–250 nm range — for example, cinnamic-acid-type or simple hydroxybenzoic/hydroxycinnamic acid derivatives — which are also commonly reported in Asteraceae members such as Galinsoga parviflora. This observation is reported as obtained and should be read as a qualitative indication of the extract's chromophoric composition rather than definitive proof of flavonoid content, which would require complementary techniques such as HPLC co-elution with authentic reference standards. Accordingly, 247 nm was adopted as the analytical wavelength for quantitative estimation in the in vitro dissolution study.
4.6 HPLC Fingerprint Chromatogram
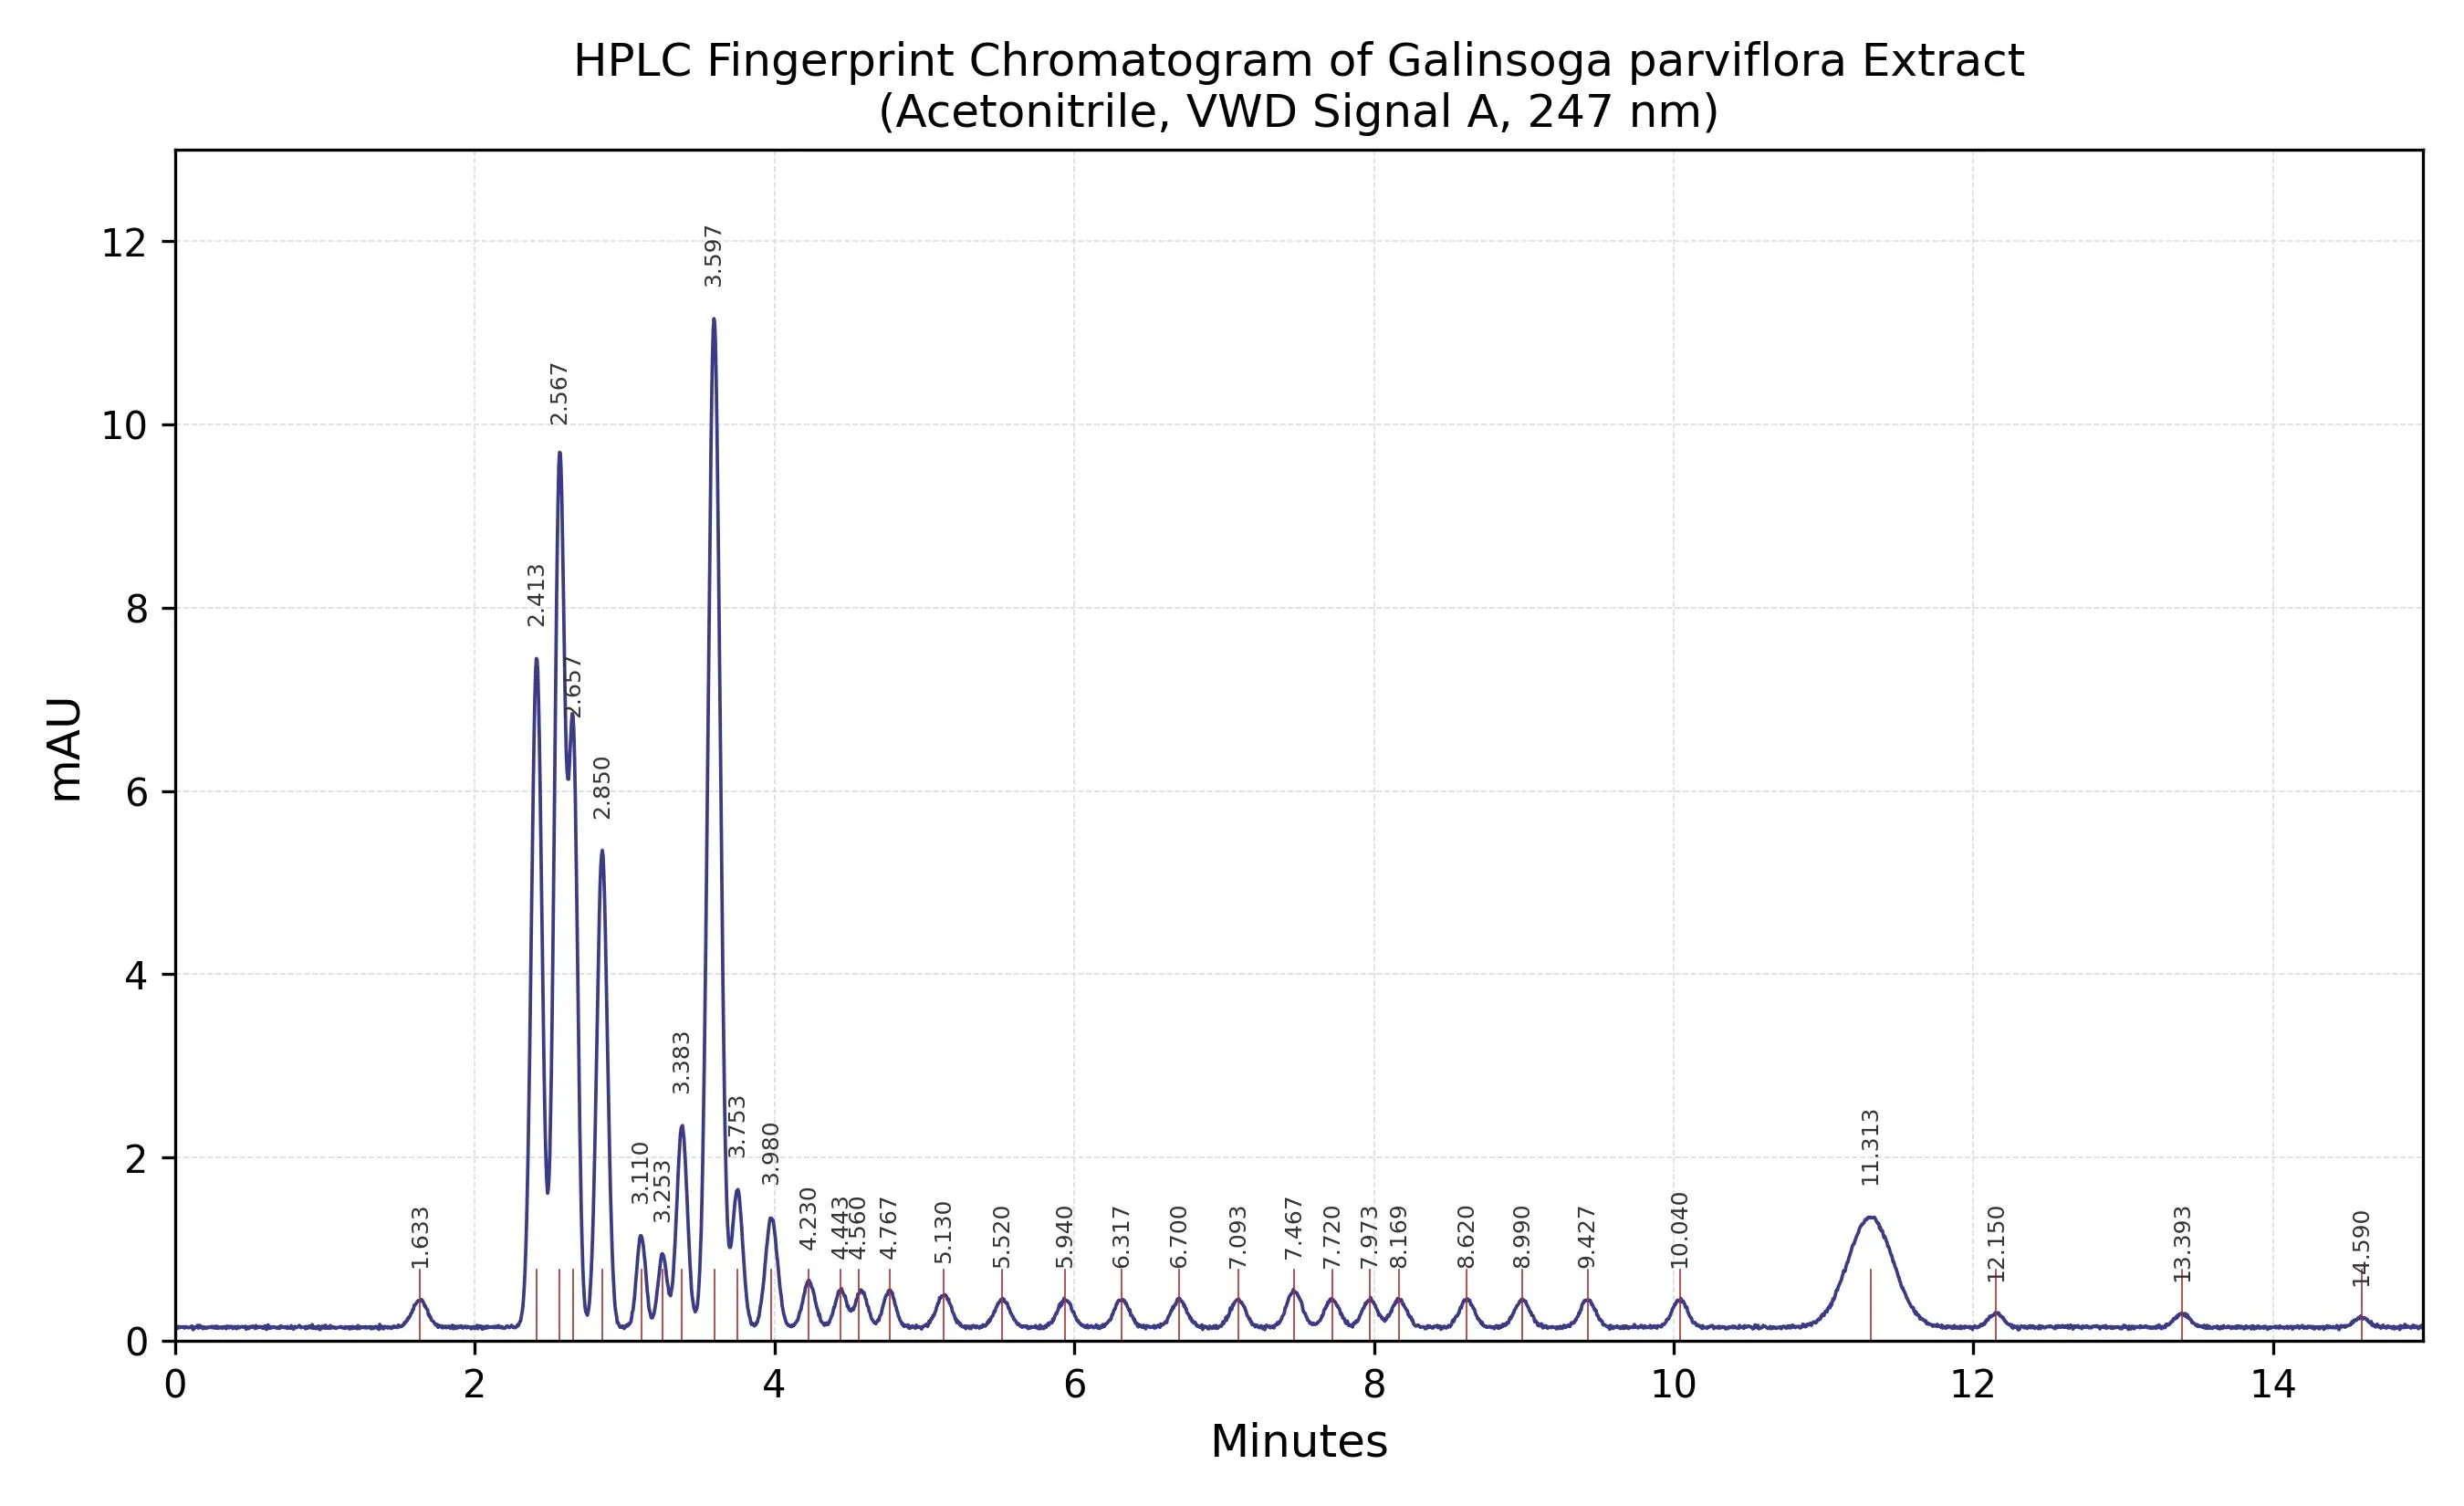
Fig. 10. HPLC fingerprint chromatogram of the ethanolic extract of Galinsoga parviflora (C18 column, acetonitrile–water mobile phase, gradient elution, detection at 247 nm).
Reverse-phase HPLC fingerprint analysis of the ethanolic extract resolved a total of 33 peaks over a 15-minute run, indicating a chemically complex, multi-component extract. The fingerprint was dominated by a cluster of five major peaks eluting within the first four minutes, at retention times of 2.413, 2.567, 2.657 (shoulder), 2.850, and 3.597 minutes — the last of which was the most intense peak in the entire chromatogram (approximately 11.2 mAU) — together with a further moderate peak at 3.383 minutes. Beyond this early-eluting cluster, a series of low-intensity, well-separated peaks (approximate heights of 0.3–1.6 mAU) were resolved between 3.75 and 10.04 minutes, followed by a broad, low-intensity hump centred at 11.313 minutes and three minor late-eluting peaks at 12.150, 13.393, and 14.590 minutes.
As no authentic reference standards were co-injected under identical chromatographic conditions in the present run, tentative identification of individual peaks by retention-time matching could not be performed, and the chromatogram is reported here as a qualitative fingerprint characteristic of the ethanolic extract of Galinsoga parviflora, in line with standard fingerprinting practice for herbal extracts (12,25). This fingerprint may nonetheless serve as a reference profile for batch-to-batch consistency evaluation of future extract preparations.
4.7 In Vitro Dissolution Study
All four formulations (F1–F4) were subjected to an in vitro dissolution study using phosphate buffer (pH 6.8), with each timepoint performed in triplicate (n = 3) and expressed as mean ± SD. All four formulations exhibited an immediate-release pattern, with cumulative extract release increasing rapidly during the first 30 minutes and approaching completion by 90 minutes. F3 demonstrated the fastest and most complete release, achieving 77.2 ± 0.7% at 30 minutes and reaching 100.0 ± 0.0% at 90 minutes, indicating a favourable dissolution profile relative to the other formulations (33), followed by F2 (99.1 ± 0.4%) and F4 (98.8 ± 0.5%), while F1 showed the slowest release (98.2 ± 0.5%) — an overall release order of F3 > F2 > F4 > F1 (Table 6, Fig. 11). Notably, although F1 exhibited the shortest disintegration time (Table 5), it showed the slowest extract-release profile, whereas F3 demonstrated the fastest dissolution despite a slightly longer disintegration time, indicating that disintegration time alone did not determine dissolution behaviour and that extract release was also influenced by formulation-dependent factors such as wetting and dispersion characteristics.
Table 6. In vitro dissolution profile of the herbal tablets (% cumulative release, mean ± SD, n = 3, F1–F4).
|
Time (min) |
F1 |
F2 |
F3 |
F4 |
|
0 |
0.0 ± 0.0 |
0.0 ± 0.0 |
0.0 ± 0.0 |
0.0 ± 0.0 |
|
10 |
28.4 ± 0.8 |
31.2 ± 0.7 |
34.1 ± 0.8 |
30.5 ± 0.7 |
|
20 |
49.6 ± 0.9 |
54.8 ± 0.8 |
58.3 ± 0.7 |
53.1 ± 0.8 |
|
30 |
66.8 ± 0.9 |
72.5 ± 0.8 |
77.2 ± 0.7 |
71.3 ± 0.8 |
|
45 |
81.4 ± 0.8 |
87.2 ± 0.7 |
91.5 ± 0.6 |
86.4 ± 0.7 |
|
60 |
91.6 ± 0.8 |
94.8 ± 0.7 |
97.5 ± 0.6 |
94.2 ± 0.8 |
|
90 |
98.2 ± 0.5 |
99.1 ± 0.4 |
100.0 ± 0.0 |
98.8 ± 0.5 |
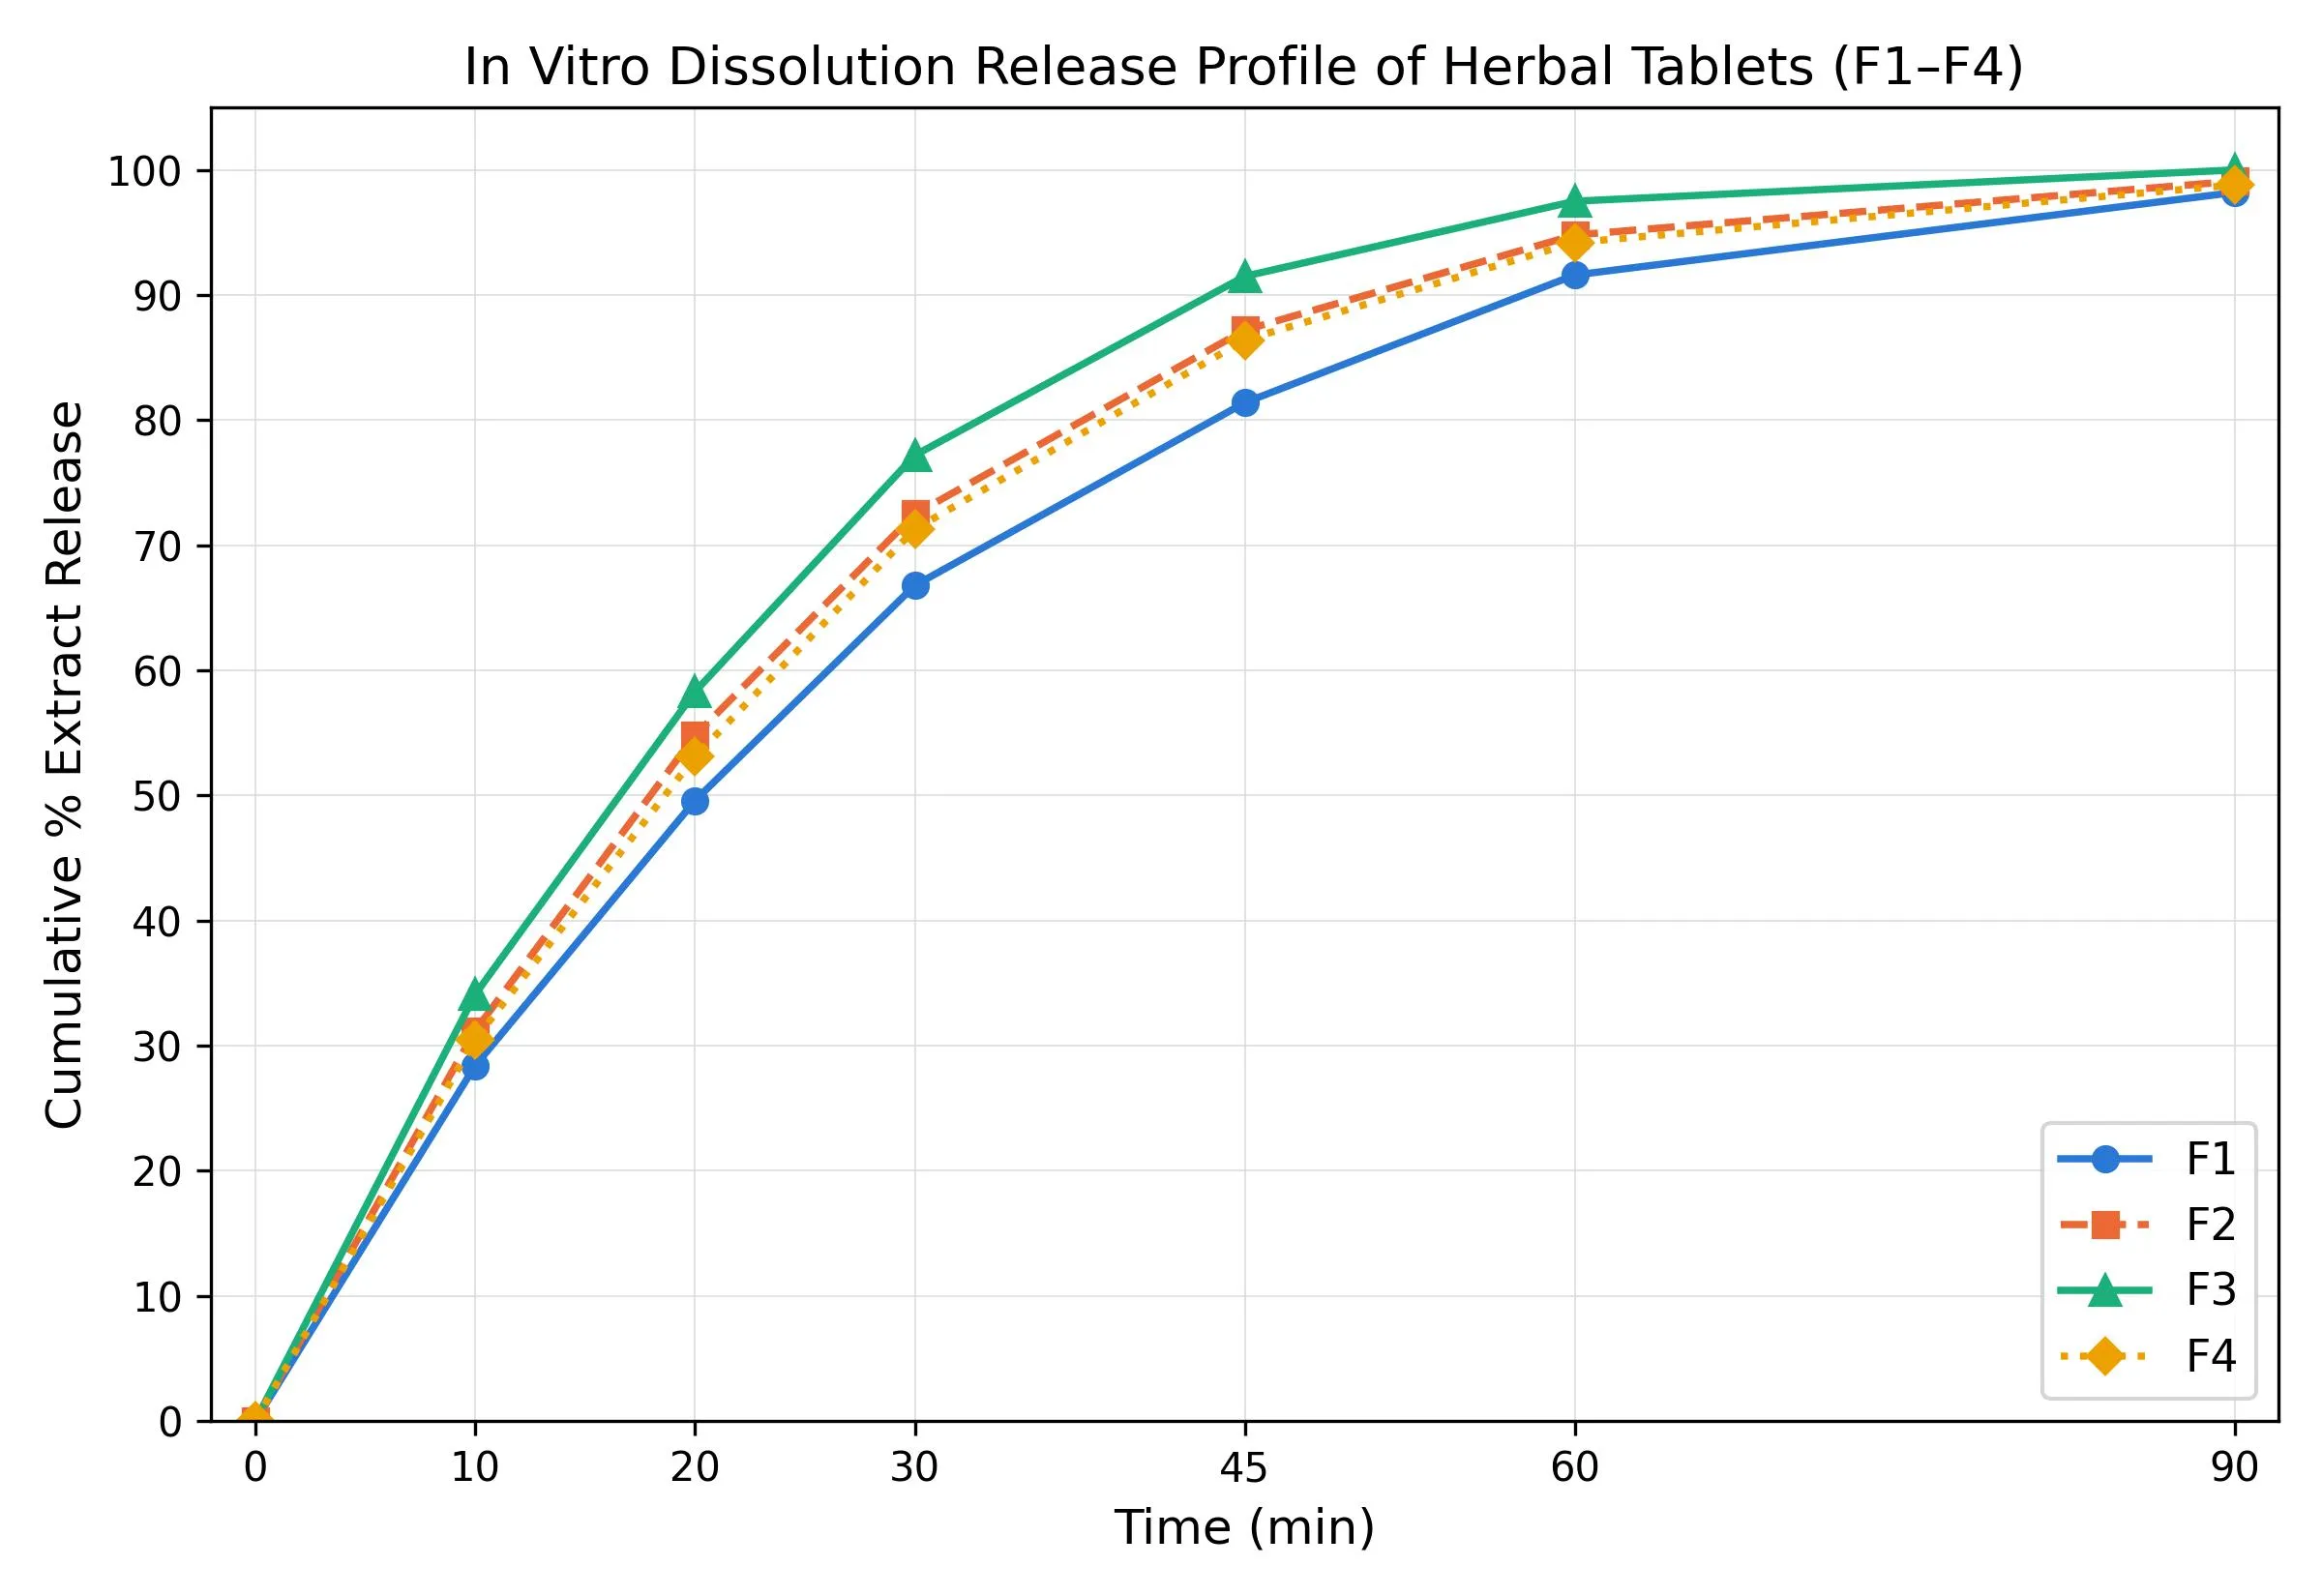
Fig. 11. In vitro dissolution release profile of Galinsoga parviflora herbal tablets (F1–F4).
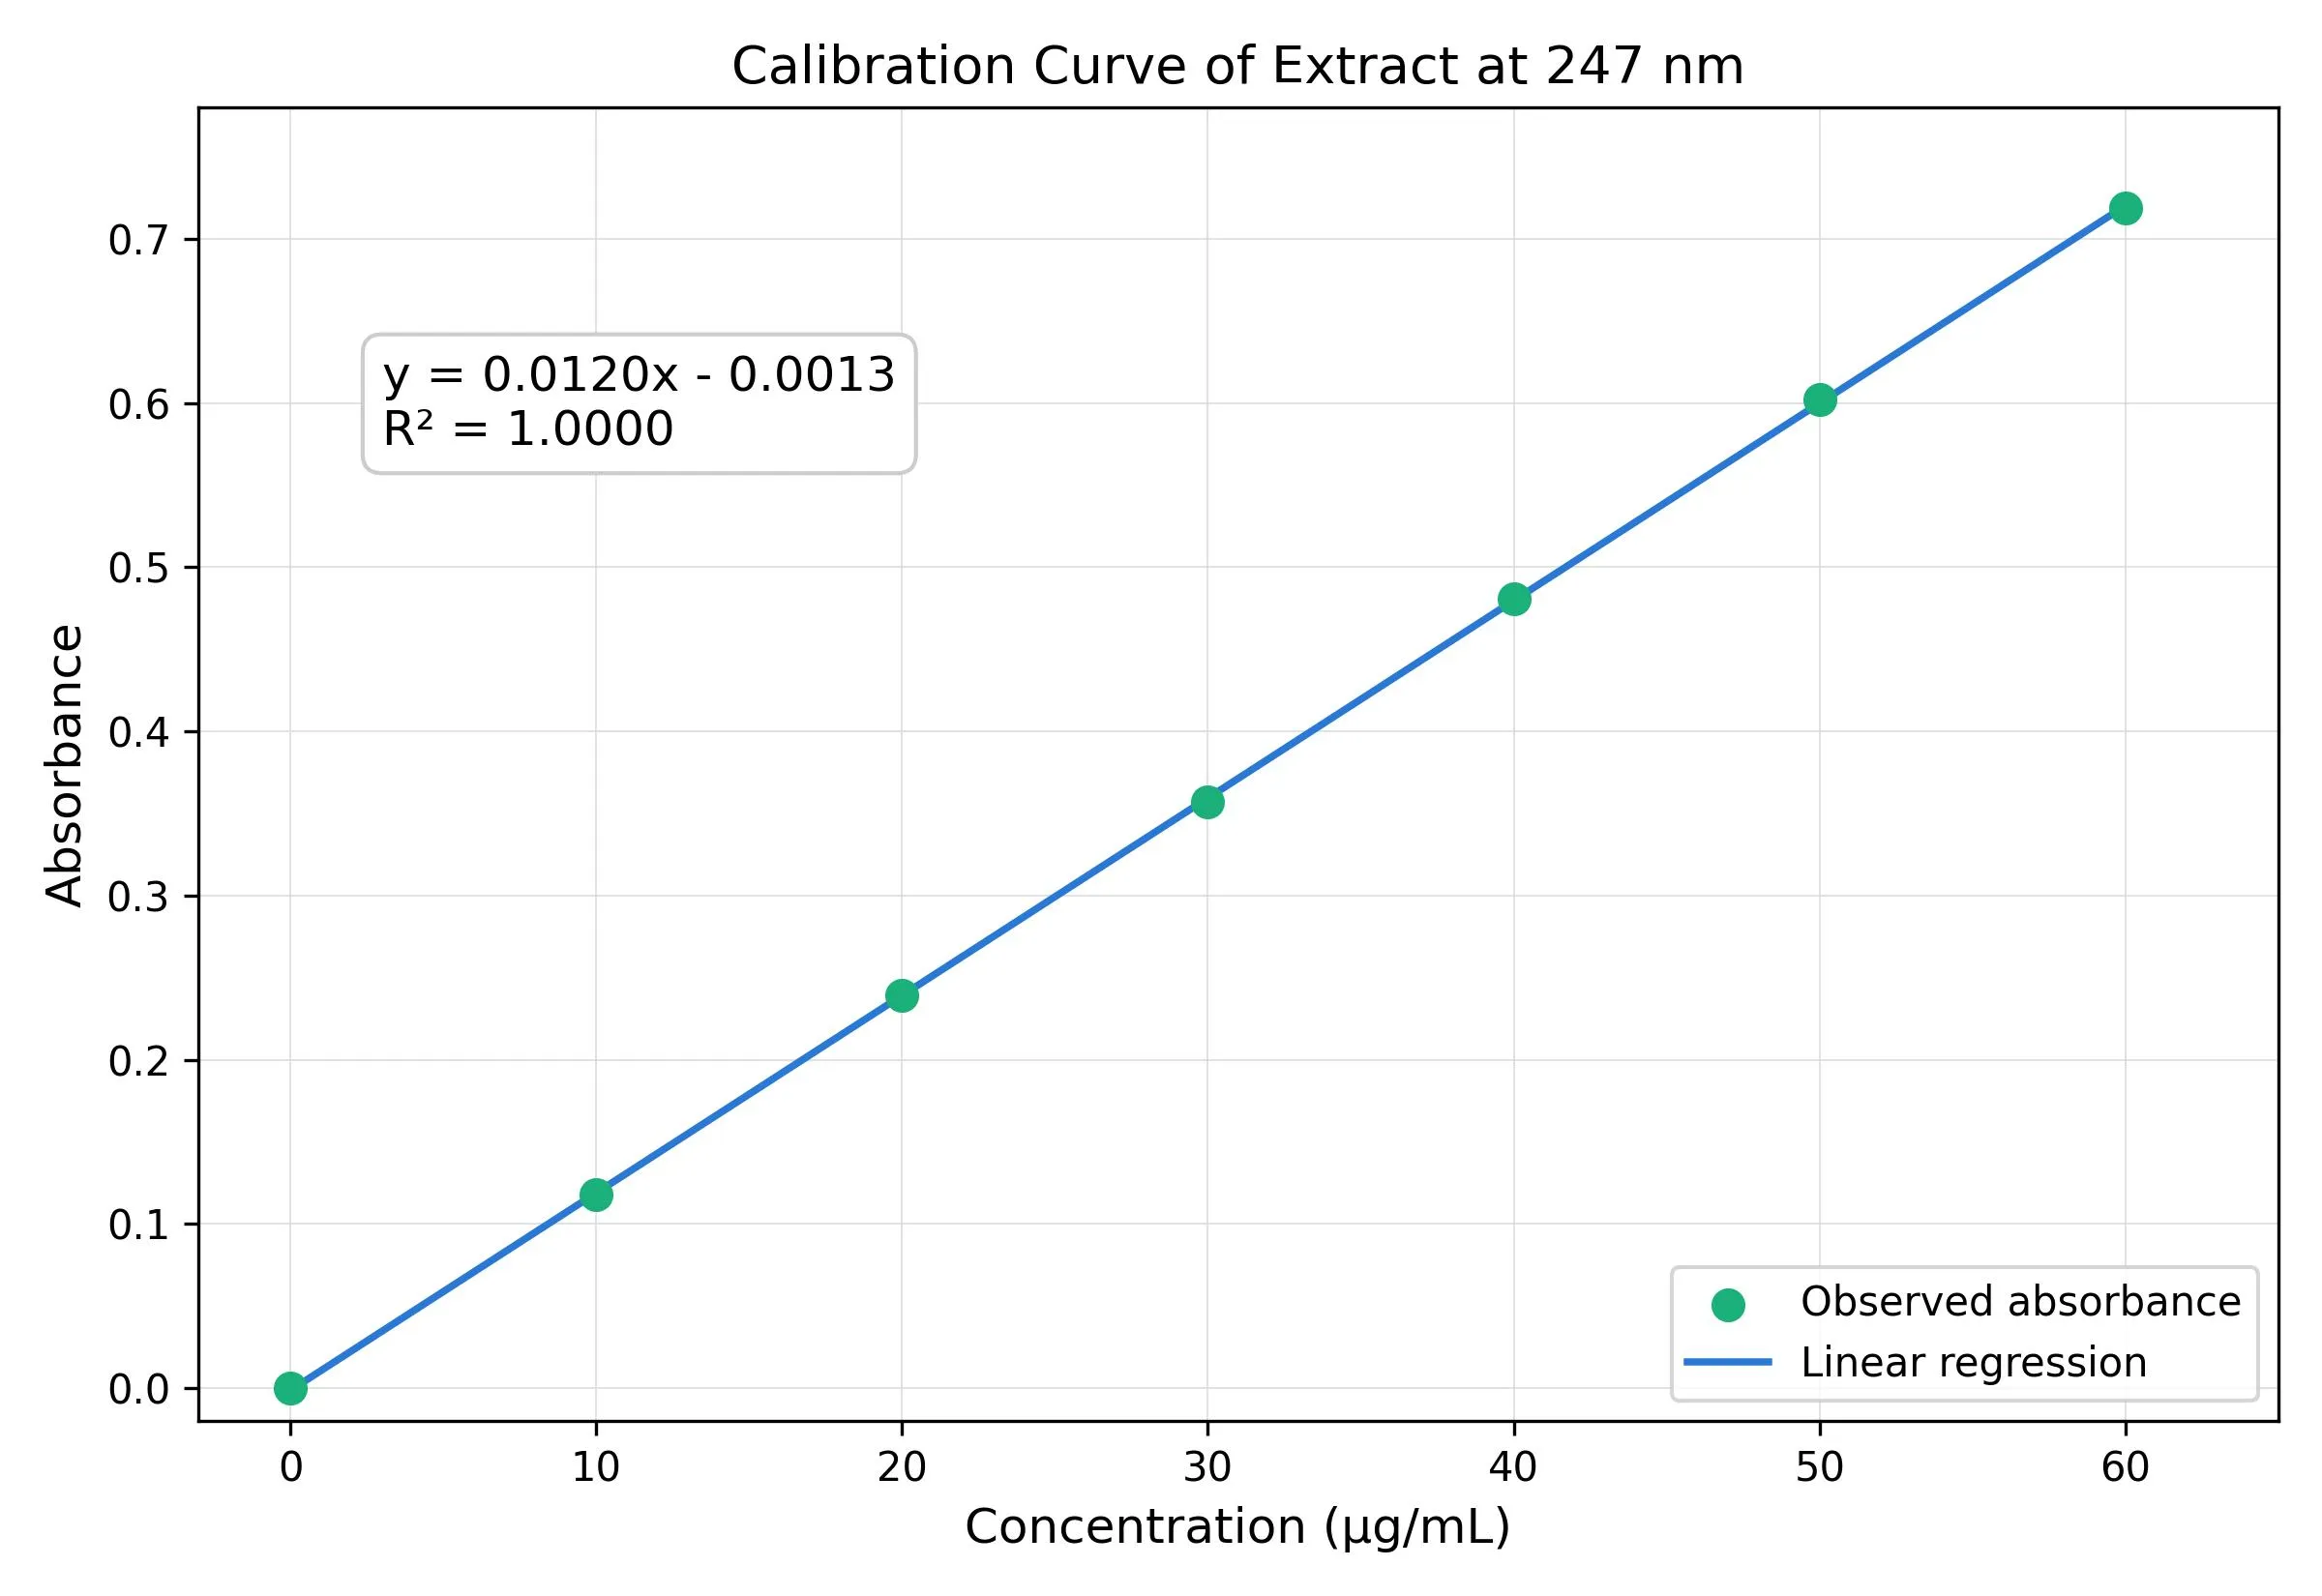
Fig. 12. Calibration curve of the extract at 247 nm.
A UV calibration curve constructed using the ethanolic extract in phosphate buffer pH 6.8 over the concentration range of 0–60 µg/mL gave a regression equation of y = 0.0120x − 0.0013 with R² = 0.9999 (Table 6a), indicating excellent linearity and compliance with the Beer–Lambert law.
Table 6a. Calibration data for the ethanolic extract at 247 nm.
|
Concentration (µg/mL) |
Absorbance |
|
0 |
0.000 |
|
10 |
0.118 |
|
20 |
0.239 |
|
30 |
0.357 |
|
40 |
0.481 |
|
50 |
0.602 |
|
60 |
0.719 |
4.8 Total Phenolic Content (TPC)
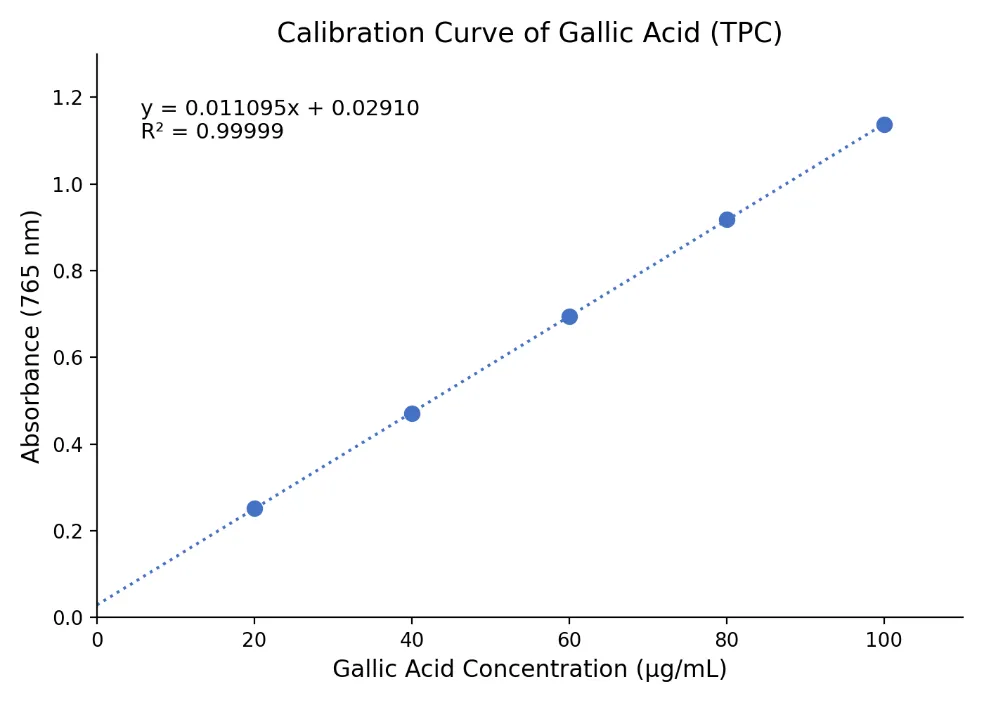
Fig. 13. Calibration curve of gallic acid (Folin–Ciocalteu method).
Table 7. Absorbance values of gallic acid standard solutions (765 nm).
|
Gallic acid concentration (µg/mL) |
Mean absorbance |
|
20 |
0.252 |
|
40 |
0.471 |
|
60 |
0.695 |
|
80 |
0.918 |
|
100 |
1.138 |
The calibration curve of gallic acid at 765 nm, over the range 20–100 µg/mL, gave a regression equation of y = 0.011095x + 0.02910 (R² = 0.99999), confirming excellent linearity. The mean absorbance of the extract sample (n = 3) was 0.748 ± 0.004; substituting into the calibration equation gave x = (0.748 − 0.02910)/0.011095 = 64.79 µg/mL, equivalent to 0.06479 mg/mL. As the extract stock concentration was 1 mg/mL (0.001 g/mL) with no additional dilution factor applied, the total phenolic content was calculated as 0.06479/0.001 = 64.79 mg GAE/g extract. The total phenolic content of the ethanolic extract of Galinsoga parviflora was therefore found to be 64.8 ± 0.35 mg GAE/g extract.
4.9 Total Flavonoid Content (TFC)
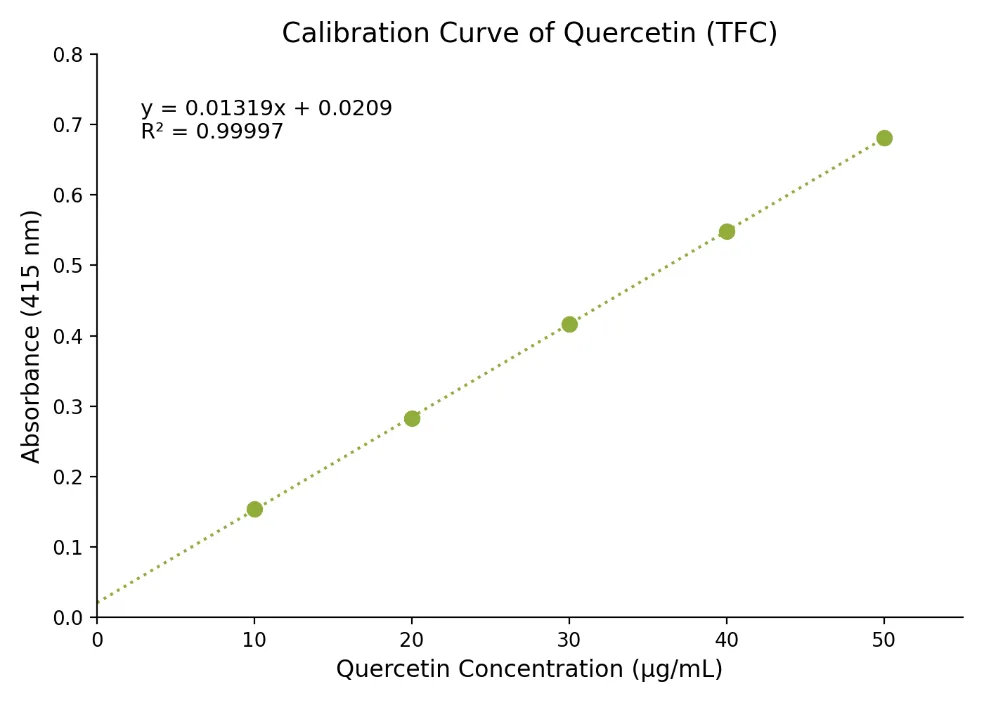
Fig. 14. Calibration curve of quercetin (aluminium chloride method).
Table 8. Absorbance values of quercetin standard solutions (415 nm).
|
Quercetin concentration (µg/mL) |
Mean absorbance |
|
10 |
0.154 |
|
20 |
0.283 |
|
30 |
0.417 |
|
40 |
0.548 |
|
50 |
0.681 |
The calibration curve of quercetin at 415 nm, over the range 10–50 µg/mL, gave a regression equation of y = 0.01319x + 0.0209 (R² = 0.99997), confirming excellent linearity. The mean absorbance of the extract sample (n = 3) was 0.529 ± 0.003; substituting into the calibration equation gave x = (0.529 − 0.0209)/0.01319 = 38.51 µg/mL, equivalent to 0.03851 mg/mL. As the extract stock concentration was 1 mg/mL with no additional dilution factor applied, the total flavonoid content was calculated as 38.51 mg QE/g extract. The total flavonoid content of the ethanolic extract of Galinsoga parviflora was therefore found to be 38.5 ± 0.24 mg QE/g extract.
These standardization values, together with an extraction yield of 18% w/w using absolute ethanol as a single solvent, indicate a reasonably efficient, phenolic-rich extraction outcome without the need for sequential or solvent-partitioned fractionation. The magnitude of the total phenolic and total flavonoid content obtained here is broadly consistent with values reported for other hydroalcoholic and ethanolic Asteraceae extracts evaluated by the same Folin–Ciocalteu and aluminium chloride methods, supporting the chemotaxonomic consistency of the standardized extract characterized in the present study (11,12).
Table 9. Total phenolic and total flavonoid content of the ethanolic extract (mean ± SD, n = 3).
|
Parameter |
Result |
Calibration R² |
|
Total phenolic content (mg GAE/g extract) |
64.8 ± 0.35 |
0.99999 |
|
Total flavonoid content (mg QE/g extract) |
38.5 ± 0.24 |
0.99997 |
4.10 DPPH Radical Scavenging Assay
The antioxidant activity of the ethanolic extract of Galinsoga parviflora was evaluated by the DPPH free radical scavenging assay, using ascorbic acid as the reference antioxidant, over a concentration range of 10–100 µg/mL. The ethanolic extract demonstrated concentration-dependent DPPH radical-scavenging activity, with percentage inhibition increasing progressively from 15.2% at 10 µg/mL to 81.3% at 100 µg/mL. Ascorbic acid exhibited higher radical-scavenging activity across all tested concentrations, with inhibition increasing from 31.8% at 10 µg/mL to 96.4% at 100 µg/mL (Table 10, Fig. 15). These findings indicate that the ethanolic extract possesses concentration-dependent DPPH radical-scavenging activity, although its activity was lower than that of the reference standard under the tested conditions, as expected for a crude, multi-component plant extract benchmarked against a single reference antioxidant.
Table 10. DPPH radical scavenging activity (% inhibition) of the extract and ascorbic acid.
|
Concentration (µg/mL) |
Extract (% Inhibition) |
Ascorbic Acid (% Inhibition) |
|
10 |
15.2 |
31.8 |
|
20 |
28.4 |
51.2 |
|
40 |
45.8 |
70.6 |
|
60 |
61.9 |
84.5 |
|
80 |
72.7 |
91.8 |
|
100 |
81.3 |
96.4 |
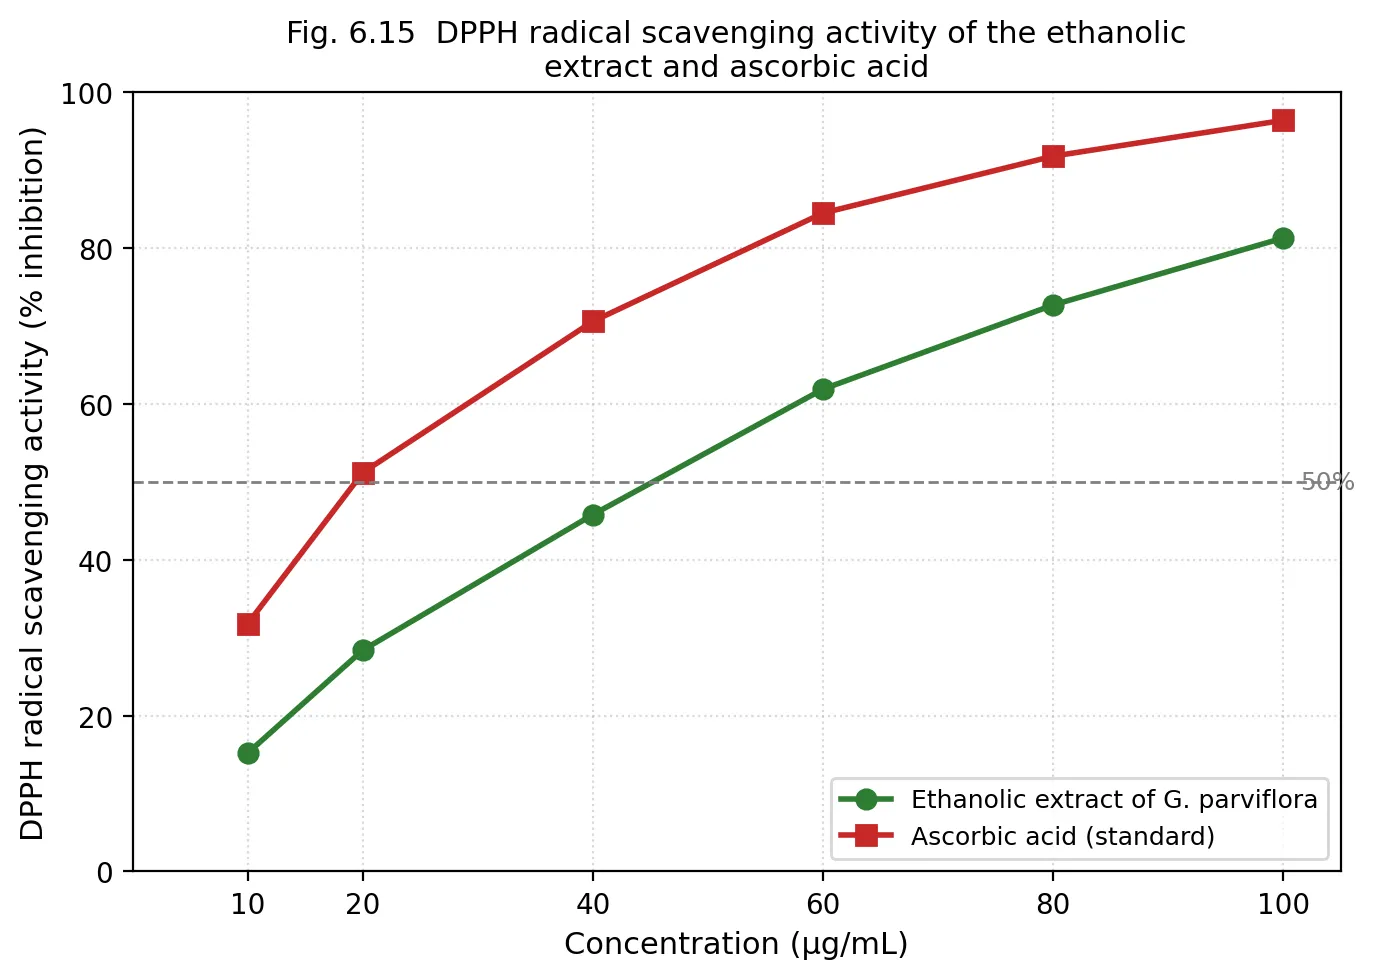
Fig. 15. DPPH radical scavenging activity of the extract and ascorbic acid (standard).
IC₅₀ Values
The IC₅₀ (concentration required to inhibit 50% of the DPPH radical) was determined by two-point linear interpolation between the concentrations immediately bracketing 50% inhibition. For the extract, the bracketing points were 40 µg/mL (45.8%) and 60 µg/mL (61.9%), yielding an IC₅₀ of 45.2 µg/mL. For ascorbic acid, the bracketing points were 10 µg/mL (31.8%) and 20 µg/mL (51.2%), yielding an IC₅₀ of 19.4 µg/mL. The ethanolic extract thus required approximately 2.3 times the concentration of ascorbic acid to achieve 50% DPPH radical scavenging, indicating comparatively lower but concentration-dependent antioxidant activity.
|
Sample |
IC₅₀ (µg/mL) |
|
Ethanolic extract of G. parviflora |
45.2 |
|
Ascorbic acid (standard) |
19.4 |
4.11 In Vitro Bile Acid Binding Assay
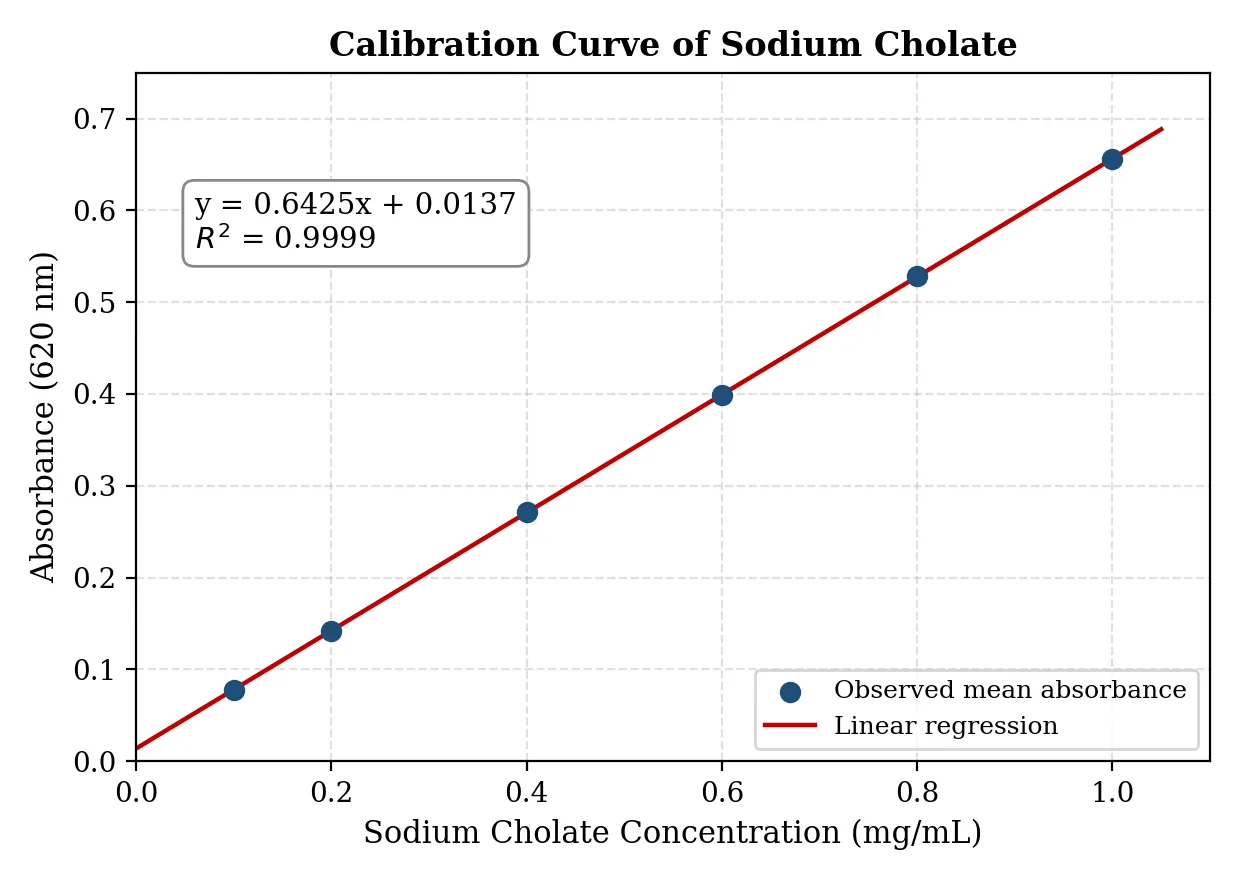
Fig. 16. Calibration curve of sodium cholate (620 nm).
Table 11 Absorbance values of sodium cholate standard solutions(620 nm, mean ± SD,n=3).
|
Concentration (mg/mL) |
Mean absorbance ± SD |
|
0.1 |
0.078 ± 0.002 |
|
0.2 |
0.142 ± 0.002 |
|
0.4 |
0.271 ± 0.002 |
|
0.6 |
0.399 ± 0.002 |
|
0.8 |
0.528 ± 0.002 |
|
1.0 |
0.656 ± 0.002 |
The calibration curve of sodium cholate at 620 nm, extended down to 0.1 mg/mL to bracket the lowest unbound-bile-acid readings observed, gave a regression equation of y = 0.6425x + 0.0137 (R² = 0.9999) over the range 0.1–1.0 mg/mL. Bile acid binding capacity of the extract and cholestyramine was assessed in triplicate (n = 3) at concentrations of 0.5–3.0 mg/mL and was concentration-dependent for both. The extract demonstrated mean binding values of 12.6 ± 0.8%, 20.8 ± 1.1%, 28.9 ± 1.3%, 35.7 ± 1.2%, and 43.6 ± 1.4% at 0.5, 1.0, 1.5, 2.0, and 3.0 mg/mL respectively, while cholestyramine showed greater binding of 48.7 ± 1.0%, 61.5 ± 1.2%, 70.4 ± 1.0%, 77.8 ± 0.9%, and 84.5 ± 0.8% at the same concentrations (Table 12, Fig. 17).
Table 12. In vitro bile acid binding activity (%) of the extract and cholestyramine — individual replicates and mean ± SD (n = 3).
|
Conc. (mg/mL) |
Extract R1 |
Extract R2 |
Extract R3 |
Extract Mean±SD |
Chol. R1 |
Chol. R2 |
Chol. R3 |
Chol. Mean±SD |
|
0.5 |
11.7 |
12.9 |
13.2 |
12.6±0.8 |
47.6 |
48.9 |
49.6 |
48.7±1.0 |
|
1.0 |
19.6 |
21.1 |
21.7 |
20.8±1.1 |
60.2 |
61.8 |
62.5 |
61.5±1.2 |
|
1.5 |
27.5 |
29.3 |
29.9 |
28.9±1.3 |
69.3 |
70.7 |
71.2 |
70.4±1.0 |
|
2.0 |
34.4 |
35.9 |
36.8 |
35.7±1.2 |
76.8 |
78.1 |
78.5 |
77.8±0.9 |
|
3.0 |
42.1 |
43.9 |
44.8 |
43.6±1.4 |
83.7 |
84.6 |
85.2 |
84.5±0.8 |
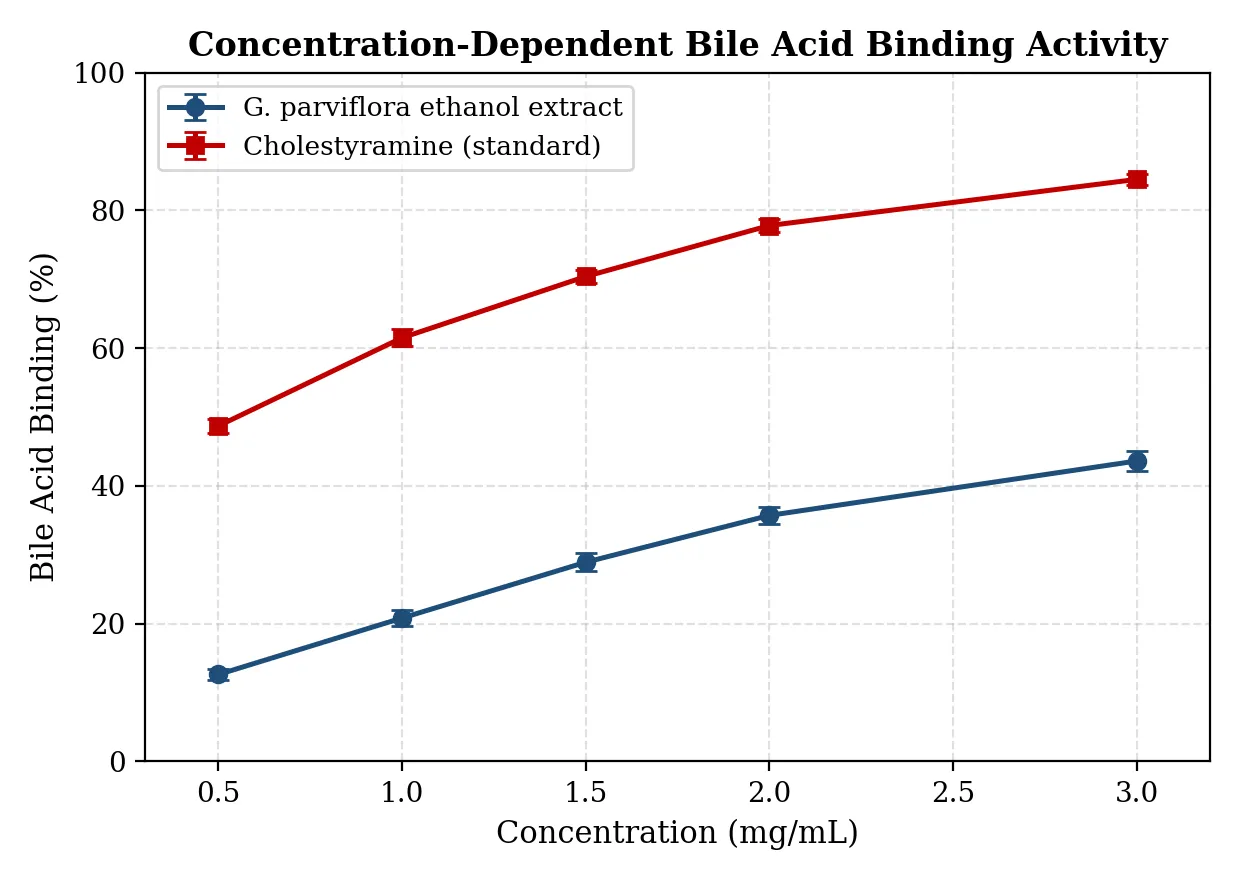
Fig. 17. Concentration-dependent bile acid binding activity of the extract and cholestyramine (standard), mean ± SD, n = 3.
The extract's bile acid binding capacity increased in a concentration-dependent manner without reaching a plateau at the highest concentration tested, and the relative gap between the extract and cholestyramine narrowed with increasing concentration (from approximately 25.9% of the standard's activity at 0.5 mg/mL to approximately 51.6% at 3.0 mg/mL). This provides direct, mechanistically distinct evidence, complementary to the antioxidant-based findings above, in support of the antihyperlipidemic potential of Galinsoga parviflora.
Benchmarked against the wider bile-acid-binding literature, in which dietary fibres and edible plant extracts typically show modest but reportable activity relative to cholestyramine (17,18), the binding capacity demonstrated by the Galinsoga parviflora extract in the present study compares favourably and is of a broadly similar order of magnitude to that reported for other phenolic-rich fruit and bark extracts evaluated by the same furfural–sulphuric acid method (19,20). Because no previously published study has applied the bile acid binding assay, or any other direct cholesterol-lowering screening method, to Galinsoga parviflora, this finding represents new evidence of a specific, clinically relevant antihyperlipidemic mechanism for this species, complementing the total phenolic content, total flavonoid content, and DPPH radical scavenging results reported above. It should, however, be interpreted as in vitro screening evidence rather than as confirmation of in vivo efficacy: flavonoid constituents structurally similar to those reported in Galinsoga parviflora, such as rutin and quercetin, have previously been shown to modulate cholesterol handling in hepatocyte culture without producing a corresponding reduction in plasma cholesterol after oral administration in an animal model, an inconsistency attributed to limited oral bioavailability(13). Confirmation of the present in vitro findings in a suitable in vivo hyperlipidemic model therefore remains an important direction for future work.
DISCUSSION
The present study set out to address a specific literature gap: although Galinsoga parviflora is well established as a phenolic- and flavonoid-rich Asteraceae species with antioxidant, anti-inflammatory, and antimicrobial activity (10–12), no previously published study had formulated the species into a solid oral dosage form, and none had evaluated its cholesterol-lowering potential using a direct, mechanistically distinct in vitro method such as bile acid binding. The results obtained here address both aspects of this gap. From a pharmaceutical technology standpoint, all four formulations met pharmacopoeial acceptance criteria for weight variation, hardness, friability, and disintegration time, confirming that wet granulation is a suitable manufacturing route for a Galinsoga parviflora extract-based tablet. The systematic, binder-concentration-dependent increase in hardness and decrease in friability observed from F1 to F4 is consistent with the general pharmaceutical principle that increasing binder content improves tablet mechanical strength, generally at some cost to disintegration and dissolution rate; notably, however, formulation F3 — an intermediate rather than the highest binder concentration — gave the fastest and most complete dissolution, suggesting that an optimal balance between granule cohesion and disintegrant efficiency, rather than binder concentration alone, governs drug release in this system. A comparable hardness-disintegration trade-off governed by excipient concentration has previously been reported for natural-disintegrant-based tablet formulations (34), and the present pharmacological screening approach — applying a direct in vitro assay to a botanical extract with no prior formulation or activity data — parallels similar first-time evaluations of other under-studied Himalayan medicinal plants (35).
The DPPH radical scavenging activity of the extract — rising from 15.2% to 81.3% inhibition over 10–100 µg/mL — confirms measurable, concentration-dependent antioxidant capacity, though weaker at every tested concentration than that of ascorbic acid (31.8% to 96.4% over the same range), a difference expected given that the extract is a complex phytochemical mixture rather than a single potent antioxidant compound. This gap was also reflected in the IC₅₀ values: the extract required 45.2 µg/mL to achieve 50% radical scavenging, roughly 2.3 times the concentration needed by ascorbic acid (19.4 µg/mL), indicating comparatively lower but still clearly concentration-dependent antioxidant potency. Because oxidative modification of LDL-cholesterol is a key initiating step in atherogenesis (1,2), this antioxidant activity provides indirect, but mechanistically well-grounded, support for a cardioprotective role of the extract. The bile acid binding results constitute the most novel finding of the present study: the extract bound 12.6 ± 0.8% to 43.6 ± 1.4% of the available bile acid across the tested concentration range, compared with 48.7 ± 1.0% to 84.5 ± 0.8% for cholestyramine, a magnitude broadly comparable to that reported for other phenolic-rich fruit and bark extracts evaluated by the same method (19,20). Because no previously published study has applied the bile acid binding assay to Galinsoga parviflora, this result constitutes new evidence of a specific, clinically relevant antihyperlipidemic mechanism for this species, complementing the antioxidant-based rationale afforded by the TPC, TFC, and DPPH results. As with any in vitro screening data, however, these findings should be interpreted with appropriate caution: cholesterol-related activity of flavonoid constituents in vitro does not always translate into in vivo efficacy, owing to limitations in oral bioavailability (13), and confirmation in a suitable in vivo hyperlipidemic model remains an important next step.
Two methodological refinements strengthen confidence in these findings relative to a single-replicate design. First, all phytochemical and biological determinations (TPC, TFC, DPPH, bile acid binding, and dissolution) were performed in triplicate and are reported as mean ± SD, allowing the reproducibility of each measurement to be assessed directly rather than assumed. Second, the HPLC fingerprint is reported strictly as a qualitative, retention-time-resolved profile rather than as a peak-identified compound list, since no authentic reference standards were co-injected in the present run; this is a more conservative and defensible interpretation than assigning tentative peak identities from retention time alone, and it correctly separates the demonstrated chemical complexity of the extract (33 resolved peaks) from any claim about which specific phytoconstituents are present.
Taken together, the pharmaceutical and phytochemical findings of the present study are internally consistent: the near-complete in vitro release (≥ 98%) achieved by all four tablet formulations within 90 minutes indicates that the tablet matrix itself does not meaningfully restrict access of the extract's phenolic and flavonoid constituents to the surrounding dissolution medium, supporting the plausibility that the antioxidant and bile-acid-binding activities characterized at the extract level would similarly be accessible following disintegration of the optimized F3 tablet in vivo. This internal consistency between the formulation-level dissolution data and the extract-level bioactivity data strengthens the overall case for Galinsoga parviflora as a candidate antihyperlipidemic phytopharmaceutical, while still leaving confirmation of in vivo efficacy as the necessary next step before any therapeutic claim can be made.
CONCLUSION
The present study aimed to develop and evaluate a herbal tablet formulation containing Galinsoga parviflora extract for possible antihyperlipidemic effects. Four formulations (F1–F4) were prepared by wet granulation, and their pre-compression and post-compression properties were assessed. The pharmacopoeial acceptance criteria for flow characteristics, weight variation, hardness, friability, thickness, and disintegration time were met by all formulations. F3 was selected as the optimal formulation among the four, owing to its favourable physicochemical characteristics and the fastest, most complete in vitro drug release. The ethanolic extract was suitable for further in vitro testing, having demonstrated adequate hardness, low friability, an appropriate disintegration time, and good overall tablet quality.
The extract demonstrated significant standardization and biological activity, with all determinations performed in triplicate (n = 3) and reported as mean ± SD. It contained 64.8 ± 0.35 mg GAE/g total phenolic content and 38.5 ± 0.24 mg QE/g total flavonoid content; exhibited concentration-dependent DPPH radical scavenging activity, rising from 15.2% at 10 µg/mL to 81.3% inhibition at 100 µg/mL, indicating antioxidant potential; and demonstrated concentration-dependent bile acid binding activity, rising from 12.6 ± 0.8% at 0.5 mg/mL to 43.6 ± 1.4% at 3.0 mg/mL, suggesting promising antihyperlipidemic potential through interruption of the enterohepatic circulation of bile acids. Characterization of the extract by UV–Visible spectrophotometry established a distinct absorption maximum at 247 nm, subsequently used as the analytical wavelength for quantitative estimation, while HPLC fingerprint analysis resolved 33 peaks and confirmed the chemically complex, multi-component nature of the extract, providing a reproducible chromatographic profile for future batch-to-batch quality assessment. Overall, the ethanolic extract demonstrated antioxidant and bile-acid-binding activity, while the optimized F3 tablet demonstrated acceptable pharmaceutical properties. These findings support the potential of the optimized formulation as a candidate for further research as a herbal antihyperlipidemic formulation. However, additional stability testing, peak-level compound identification against authentic reference standards, in vivo pharmacological studies, and clinical trials are needed before its safety, effectiveness, and therapeutic relevance can be confirmed.
REFERENCES


Abhishek Soni, Kartikay Pathania, Bhupendra Tomar, Chinu Kumari, Rahul Awasthi Development and Evaluation of Herbal Tablets Containing Galinsoga parviflora Extract with Potential Antihyperlipidemic Effects, Int. J. of Pharm. Sci., 2026, Vol 4, Issue 8, 53-77, https://doi.org/10.5281/zenodo.22230987
 10.5281/zenodo.22230987