

We use cookies to ensure our website works properly and to personalise your experience. Cookies policy
University Department of Chemical Technology, Dr. Babasaheb Ambedkar Marathwada University, Aurangabad, Maharashtra, India.
Objective: A novel, selective, precise, and accurate reverse phase High Performance Liquid Chromatographic method for estimation of Lamivudine and zidovudine was developed and validated according to ICH guidelinesMethod: HPLC method was developed using BDS hypersil C18, (250mm × 4.6mm, 5?m) column with 1% formic acid in water: Acetonitrile (60:40 v/v) as a mobile phase at a flow rate of 1.0 mL/min and eluents were detected at 269 nm.Results: The calibration curves were linear over the concentration range of 50 to 800 ng/mL (R2 =0.999) for Lamivudine and 100 to 100- ng/mL (R2 = 0.999) for Hydroxychavicol. The average retention time of Lamivudine and zidovudine was found to be 3.41min and 6.18 min respectively. Average percentage recoveries of lamivudine and zidovudine were 100.07 and 99.91 %, respectively. The LOQ values for lamivudine and zidovudine were 0.4312 and 0.5219 ng/mL respectively. Intra- and inter-day precision values (% RSD) of proposed method were less than 2%.Conclusion: A simple, precise, accurate, linear and rapid RP-HPLC method was developed for simultaneous estimation of lamivudine and zidovudine and validated as per ICH guidelines. The results suggest that the developed method can be applicable in routine estimation of lamivudine and zidovudine in bulk as well as pharmaceutical formulation
Lamivudine and zidovudine, both reverse transcriptase inhibitors, are commonly administered together to manage HIV infection in patients. The therapy is administered to prevent or delay the onset of acquired immune deficiency syndrome (AIDS), a condition that can result in several life-threatening consequences. Lamivudine is administered in reduced dosages to treat patients with chronic hepatitis B who have had viral replication and subsequent liver inflammation. Zidovudine is administered in conjunction with other antiviral drugs to manage individuals infected with HIV. Zidovudine is administered to pregnant women to mitigate the likelihood of HIV transmission from a mother to her fetus. The literature analysis indicates that there are only a limited number of RP-HPLC methods available for the quantification of lamivudine and zidovudine, both alone and in combination with other medications. Several techniques have been documented for the determination of both medicines in the formulation. Therefore, the objective of this study was to establish an RP-HPLC technique that allows for the simultaneous determination of many compounds, while ensuring simplicity, speed, enhanced sensitivity, and faster elution.
Considering the therapeutic importance, various analytical methods for the determination of Lamivudine and Zidovudine were reported earlier. It includes thin layer chromatography-based methods, HPLC methods using either UV detection or electrochemical detection, and LC-MS. [9-13]. Detailed literature survey revealed the fact that previously reported HPLC methods were somewhat complicated, less sensitive, or time-consuming. Keeping in view the above-mentioned drawbacks of earlier HPLC methods it is imperative to develop a simple, sensitive, and economic HPLC method for the determination of Lamivudine and Zidovudine in pharmaceutical bulk and formulation.
|

|

|
|
Fig.1-Chemical structure of Lamivudine |
Fig.2- Chemical structure of Zidovudine |
MATERIALS AND METHODS
Chemicals and Reagent
Lamivudine and Zidovudine was obtained from TCI chemicals (India) Pvt. Ltd. Allthe chemicals and reagent used were of at least analytical grade. HPLC grade methanol and water were used for the proposed study.
Instruments
Chromatographic analysis was performed using an Agilent HPLC system that consisted of a G1311C quaternary HPLC pump (Agilent Technologies, Palo Alto, CA), G1329B autosampler system (Agilent Technologies) and G1315F variable wavelength detector (Agilent Technologies). HPLC grade water was obtained from “Extrapure” water purification system (Lablink). Mobile phase was degassed by using Ultrasonicator (PCiAnalyticals). For weighing purpose, Vibra HT(Essae) analytical balance was used.
Optimization of RP-HPLC Method
Chromatographic conditions were optimized by injecting standard solution (10 ng/mL Lamivudine and 20ng/mL Zidovudine) into HPLC system and allowed to run in different mobile phases so as obtain optimum conditions for separation of both drugs.
Preparation of Mobile Phase
1 % formic acid in water was prepared by dissolving 10 mL of formic acid in 1000ml of HPLC grade water. It was filtered through 0.22µm filter and degassed by ultrasonication for 10 min. HPLC grade Acetonitrile was used in combination with 1% formic acid (60:40 % v/v) as a mobile phase.
Preparation of standard stock solution
Stock solutions (100 mg/mL) of lamivudine (Stock I) and zidovudine (StockII) were separately prepared in HPLC grade acetonitrile and filtered through 0.45-m nylon membrane syringe filter.
Preparation of standard calibration curve
Stock I & II were diluted suitably with methanol and mixed together to achieve 7 calibration standards (CAL STD) containing 50 to 800 ng/mL, 100 to 1000 ng/mL and lamivudine and zidovudine respectively. All the solutions were injected into HPLC column and the peak area of each solution was measured. The standard calibration curves of peak area Vs concentration (ng) were plotted.
Method Validation
Developed method was validated as per ICH guidelines. Various analytical method validation parameters viz. system suitability, linearity, range, LOD, LOQ, accuracy, precision and stability were assessed [21-23].
System Suitability
Before performing the main analysis, the system suitability test was carried out using freshly prepared standard working solution consisting of 100 ng/mL of lamivudine and 200 ng/mL of zidovudine. During the test, five replicates of above-mentioned solution were analyzed for retention time, peak area and the theoretical plates. Acceptable upper limit of % RSD for peak area and retention time was set at 2 whereas acceptable lower limit of number of theoretical plates was set at 2000. System was considered to be suitable only when obtained values were within the set limits
Validation Parameter:
Linearity
Linearity of the proposed method was calculated by using seven different CAL STDs. After analyzing CAL STDs, calibration curves representing concentration vs. peak area were plotted and linear regression analysis was performed.
Accuracy (% Recovery)
To ensure the accuracy of method, recovery studies were performed by standard addition method using 80%, 100% and 120% levels of drug concentrations. Percent recovery was calculated from the amount found and the actual amount added.
Precision
Precision of proposed method was evaluated at three different levels i.e. LQC (Lamivudine 50ng/mL + Zidovudine 100 ng/mL), MQC (Lamivudine 400 ng/mL + Zidovudine 500 ng/mL) and HQC (Lamivudine 800 ng/mL + Zidovudine 1000 ng/mL). Intra-day and Inter-day precision was determined by analyzing the solutions at different time intervals on the same day and on three consecutive days.
LOD and LOQ
ASTM LOD and LOQ were calculated by analyzing the CAL STD-1. Chromatogram of CAL STD-1 was processed using HPLC software settings “Annotations” and obtained values were reported as LOD and LOQ for lamivudine and zidovudine.
Stability
The stability of LAMIVUDINE and zidovudine solutions (Standard as well as formulation) was determined by keeping MQC and the formulation in tightly closed volumetric flasks at room temperature for 48 hrs. The solutions were analyzed at 12 hr intervals. The % assay and the RSD values were reported.
Estimation of Lamivudine and Zidovudine in Pharmaceutical formulation
Accurately 20 tablets were weighed and crushed into a fine powder from different batches of the same formulation. Then, the weight equivalent to 50 mg each of lamivudine and zidovudine was transferred into a 100 ml volumetric flask, 50ml of diluent (Acetonitrile: Water 50:50 v/v) added and sonicated for 10 minutes, further the volume made up with diluent and filtered. Furthermore, 5 ml of this solution was diluted to 25 volumetric flask using diluent. The filtered solution was injected five times into the HPLC system and response was recorded.
RESULTS AND DISCUSSION
Optimization of RP-HPLC Method
Resolution was considered to be the most important criteria for the method and was imperative to achieve good resolution among the both compounds. Based on pKa and solubility of both the compounds, various compositions of mobile phase were tried and best resolution was obtained with mobile phase consisting of 1% acetic acid in water and Acetonitrile in the ratio of 60:40v/v. better resolution of the peaks with clear base line was found. Detection was carried out at 269 nm. Optimized chromatographic conditions are given in Table 1. Under these conditions retention time for lamivudine and zidovudine were 3.42 min and 6.18 min, respectively (Fig. 3).
Table 1. The optimized chromatographic conditions
|
Separation variable |
Optimized conditions |
|
Chromatography |
Agilent HPLC system |
|
Column |
BDS Hypersil C18, (150mm × 4.6mm, 3.5μm) |
|
Mobile phase |
1% Formic acid in water: Acetonitrile (60:40 v/v) |
|
Flow rate |
1.0 mL/min |
|
Temperature |
Ambient |
|
Detection wavelength |
269 nm |
|
Retention time (Lamivudine) |
3.42 min |
|
Retention time (Zidovudine) |
6.18 min |
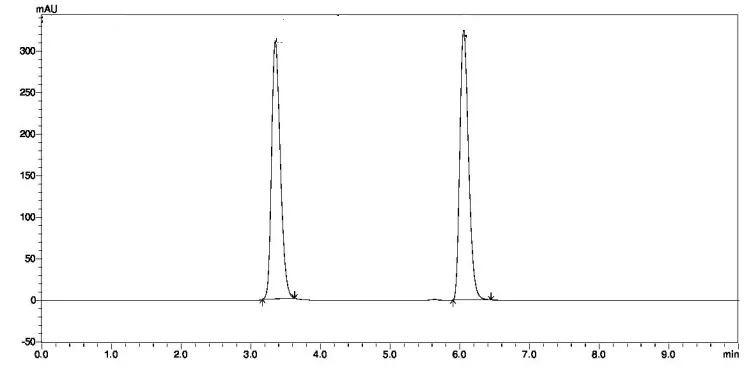
Fig. 3: A typical RPLC chromatogram of Lamivudine (3.41 min) and Zidovudine (6.18 min)
System suitability
During system suitability test, RSD of all parameter were calculated to evaluate the suitability of the developed method. From the results, it was found that %RSD for retention time and peak area was less than 2 and the number of theoretical plates were more than 2000 (Table 1).
Table No. 2: System suitability parameters for Lamivudine and Zidovudine
|
Sr.No. |
Parameter |
Acceptance criteria |
Lamivudine |
Zidovudine |
||
|
Observed Value |
%RSD |
Observed Value |
%RSD |
|||
|
1 |
Retention Time |
%RSD ≤ 2% |
3.41 |
0.1721 |
6.18 |
0.3512 |
|
2 |
Area |
%RSD ≤ 2% |
13283 |
0.3171 |
18392 |
0.3741 |
|
3 |
Theoretical plates |
≥ 2000 |
4721 |
0.6261 |
3826 |
0.4562 |
Method validation
Linearity and Range
Linearity and range are the important parameters of analytical method that demonstrates the limit within which the intended method is to be used for its optimum performance. Considering the prime importance of linearity and the range, seven-point calibration curve of lamivudine (50-800 ng/mL) and zidovudine (100-1000 ng/ mL) were constructed. Different concentrations and peak area values are depicted in Table 3. Calibration curve when subjected to least square regression analysis yielded an equation; y = 263.83x - 269.73 for lamivudine and y = 378.55x - 7953.4 for zidovudine with correlation coefficient 0.999 and 0.997 respectively (Fig. 4 and 5). From the linearity study, it was revealed that, there is a linear relationship between response and amount of drug within the range 50-800 ng/mL for lamivudine and 100-1000 ng/mL for zidovudine.
Table No. 3: Linearity of Lamivudine and Zidovudine
|
Sr.No. |
Lamivudine |
Zidovudine |
||
|
Conc. (ng/mL) |
Peak Area |
Conc. (ng/mL) |
Peak Area |
|
|
1 |
50 |
13253 |
100 |
18381 |
|
2 |
100 |
26506 |
200 |
73524 |
|
3 |
200 |
53013 |
300 |
110285 |
|
4 |
300 |
80519 |
400 |
147047 |
|
5 |
400 |
106025 |
600 |
220571 |
|
6 |
600 |
157038 |
800 |
294094 |
|
7 |
800 |
212050 |
1000 |
367618 |
|
8 |
Slope |
263.83 |
Slope |
378.55 |
|
9 |
y-intercept |
269.73 |
y-intercept |
7953.4 |
|
10 |
R2 |
0.999 |
R2 |
0.997 |
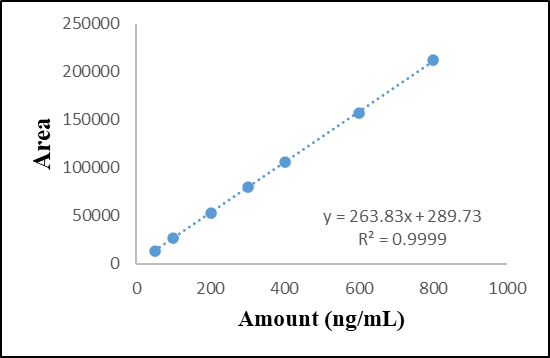
Fig. 4: Linearity curve of lamivudine
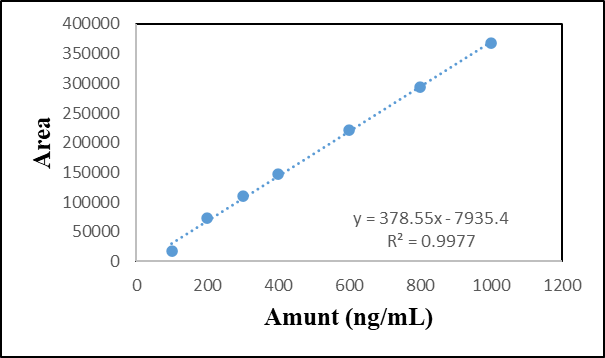
Fig. 5: Linearity curve of zidovudine
Accuracy (% Recovery)
Accuracy is the closeness of test results to the true value obtained by proposed method. The accuracy of an analytical method should be established over its calibration range so that at any point of determination, results obtained would be accurate. For lamivudine and zidovudine, accuracy was determined using recovery studies. At 80, 100 and 120 % standard addition, mean recovery of lamivudine and zidovudine was found to be 100.15 and 100.55 % respectively. The relative standard deviation (% RSD) was found to be less than 2 (Table 4). From the results of accuracy studies, it was concluded that the analytical technique showed good accuracy.
Table No. 4: Recovery studies of Lamivudine and Zidovudine
|
Sr. No. |
Sample |
Spiked level |
Amount present (ng/mL) |
Amount recovered (ng/mL) |
% Recovery |
Mean % Recovery |
% RSD |
|
1 |
Lamivudine |
80% |
320 |
319.98 |
99.99 |
100.07 |
0.7821 |
|
100% |
400 |
399.95 |
99.98 |
||||
|
120% |
480 |
480.10 |
100.02 |
||||
|
2 |
Zidovudine |
80% |
400 |
399.12 |
99.78 |
99.91 |
0.6878 |
|
100% |
500 |
499.92 |
99.98 |
||||
|
120% |
600 |
599.89 |
99.98 |
Precision
Precision was studied by analysis LQC, MQC and HQC STDs containing both the drugs at concentrations covering the entire calibration range. The results expressed in terms of % RSD for the intra- and inter-day precision study (Table 4 and 5). Percent RSD values of intra-day precision study were found to be 0.3728and 0.9182 for lamivudine and zidovudine respectively, whereas inter-day precision was 0.1037 and 0.9101respectively. It was concluded that the analytical technique showed good repeatability.
Table No 5: Intra-day precision data for Lamivudine and Zidovudine
|
Sr.No. |
Lamivudine |
Zidovudine |
||||||
|
Amount present (ng/mL) |
Amount recovered (ng/mL) |
% Assay |
% RSD |
Amount present (ng/mL) |
Amount recovered (ng/mL) |
% Assay |
% RSD |
|
|
1 |
50 |
49.27 |
98.54 |
0.3728 |
100 |
99.86 |
99.86 |
0.6352 |
|
2 |
400 |
399.76 |
99.94 |
0.9182 |
500 |
499.52 |
99.904 |
0.7262 |
|
3 |
800 |
800.12 |
100.015 |
0.2837 |
1000 |
999.6 |
99.96 |
0.9172 |
Table No 6: Inter-day precision data for Lamivudine and Zidovudine
|
Sr.No. |
Lamivudine |
Zidovudine |
||||||
|
Amount present (ng/mL) |
Amount recovered (ng/mL) |
% Assay |
% RSD |
Amount present (ng/mL) |
Amount recovered (ng/mL) |
% Assay |
% RSD |
|
|
1 |
50 |
49.23 |
98.46 |
0.7120 |
100 |
99.71 |
99.71 |
0.9101 |
|
2 |
400 |
400.12 |
100.03 |
0.6589 |
500 |
499.37 |
99.874 |
0.2090 |
|
3 |
800 |
799.31 |
99.91375 |
0.3488 |
1000 |
999.15 |
99.915 |
0.1037 |
LOD and LOQ
Limit of detection LOD (signal-to- noise ratio of 3) and limit of quantification LOQ (signal-to- noise ratio of 10) were measured based on the signal-to noise ratio. The LOD and LOQ values for lamivudine were 0.0723 and 0.4312 ng/mL, respectively and these values for zidovudine were 0.0543 and 0.5219 ng/mL.
Stability
The stability of lamivudine and zidovudine in the prepared sample was determined by analyzing LQC (lamivudine 400 ng/mL + zidovudine 500 ng/mL) at 1, 12, 24 and 48 h (Table No. 7). During stability testing, no significant change was observed in the content of lamivudine and zidovudine. Percent RSD was less than 2% indicating a good stability of the sample. Hence it was concluded that lamivudine and zidovudine solutions are stable for 48 h.
Table No. 7: Stability study of Lamivudine and Zidovudine
|
Sr.No. |
Time (h) |
Lamivudine |
Zidovudine |
||||
|
Amount recovered (ng/mL) |
% Assay |
% RSD |
Amount recovered (ng/mL) |
% Assay |
% RSD |
||
|
1 |
1 |
399.73 |
99.93 |
0.1123 |
499.93 |
99.986 |
0.7121 |
|
2 |
12 |
399.63 |
99.90 |
0.4589 |
499.38 |
99.876 |
0.6123 |
|
3 |
24 |
399.37 |
99.84 |
0.4597 |
499.23 |
99.846 |
0.4351 |
|
4 |
48 |
399.16 |
99.79 |
0.9597 |
499.12 |
99.824 |
0.6111 |
Estimation of lamivudine and zidovudine in pharmaceutical formulation
Proposed validated analytical method was successfully applied to the determination of lamivudine and zidovudine in pharmaceutical formulation. The results of the assay (n = 5) yielded 99.05 % for lamivudine and 99.27 % zidovudine. The observed concentration of lamivudine was found to be 198.11 ± 0.026 ng/mL (mean ± SD) these values for the zidovudine was 299.18 ± 0.018 ng/mL (Table no.9). The results of the assay indicate that the method is selective for the analysis of lamivudine and zidovudine without interference of the excipients.
Table no. 9: Analysis of pharmaceutical formulation
|
Sr.No. |
Amount present (ng/mL) |
Amount recovered (ng/mL) |
||
|
Lamivudine |
Zidovudine |
Lamivudine |
Zidovudine |
|
|
1 |
200 |
300 |
198.1 |
298.18 |
|
2 |
200 |
300 |
199.12 |
300.1 |
|
3 |
200 |
300 |
197.12 |
299.26 |
|
4 |
Average |
198.11 |
299.18 |
|
|
5 |
± S.D. |
0.026 |
0.018 |
|
|
6 |
% Assay |
99.05 |
99.72 |
|
CONCLUSION
An accurate, precise, simple yet sensitive RP-HPLC method was developed and validated for the simultaneous determination of lamivudine and zidovudine. Further, it was found that developed method could be used for the routine analysis of pharmaceutical composition containing lamivudine and zidovudine.
REFERENCES

Dr. Sachin Bhusari, Shivani Shinde, Pravin Wakte, Development and Validation of a Novel and Simple Isocratic HPLC Method for Simultaneous Estimation of Lamivudine and Zidovudine in Bulk and Pharmaceutical Formulation, Int. J. of Pharm. Sci., 2026, Vol 4, Issue 9, 2287-2296, https://doi.org/10.5281/zenodo.22847089
 10.5281/zenodo.22847089