

We use cookies to ensure our website works properly and to personalise your experience. Cookies policy
Department of Pharmaceutical Quality Assurance, Shri Sarvajanik Pharmacy College, Gujarat Technological University, Near Arvind Baug, Mehsana-384001. Gujarat, India.
Telmisartan is an angiotensin II receptor blocker used in the management of hypertension and in reducing the risk of cardiovascular events in patients with cardiovascular or vascular disease who are unable to tolerate angiotensin-converting enzyme inhibitors. The present study describes the development and validation of a simple, sensitive, accurate, and eco-friendly UV–visible spectrophotometric method for the estimation of telmisartan in pharmaceutical dosage forms. The proposed method was evaluated in accordance with International Council for Harmonization (ICH) guidelines for linearity, accuracy, precision, and robustness. The method demonstrated good linearity over the concentration range of 2–12 µg/mL, with a correlation coefficient of 0.9958. The accuracy of the method ranged from 99.62% to 100.58%. These results indicate that the developed method is reliable and suitable for the quantitative determination of telmisartan in pharmaceutical formulations. Thus, the proposed UV–visible spectrophotometric method may serve as a simple, cost-effective, and environmentally friendly analytical procedure for routine quality-control analysis of telmisartan.
Antihypertensive drugs play an essential role in the management of elevated blood pressure and the prevention of associated cardiovascular and renal complications, including stroke, heart failure, myocardial infarction, and chronic kidney disease. Among the available therapeutic agents, telmisartan is a widely used angiotensin II receptor blocker (ARB) with a prolonged duration of action, high affinity for angiotensin II type 1 (AT₁) receptors, and a favourable tolerability profile. By selectively inhibiting the binding of angiotensin II to AT₁ receptors, telmisartan reduces vasoconstriction, aldosterone secretion, and vascular resistance, thereby producing a sustained reduction in blood pressure. [1-3]
In addition to its antihypertensive activity, telmisartan has been reported to exhibit partial agonistic activity at peroxisome proliferator-activated receptor gamma (PPAR-γ). This additional pharmacological property may contribute to improvements in insulin sensitivity, lipid metabolism, and overall cardiovascular protection. [4-5] Consequently, telmisartan may be particularly beneficial in patients with hypertension who also have diabetes mellitus or an increased risk of cardiovascular disease. Reliable analytical methods are therefore important for the identification and quantitative estimation of telmisartan in pharmaceutical formulations, supporting routine quality control and ensuring the safety, efficacy, and consistency of the drug product. [6-7]
Drug Profile of Telmisartan
Telmisartan is a white, benzimidazole-derived angiotensin II receptor blocker with the molecular formula C₃₃H₃₀N₄O₂ and a molecular weight of 514.6169 g/mol. (Fig 1) It is freely soluble in methanol, slightly soluble in acetonitrile, and insoluble in water. Its partition coefficient is 3.2, pKa values are 3.5, 4.1, and 6.0, and its melting point is 261–269°C. The usual daily dose is 80 mg. Telmisartan should be stored in a tightly closed container at room temperature.[8-9]
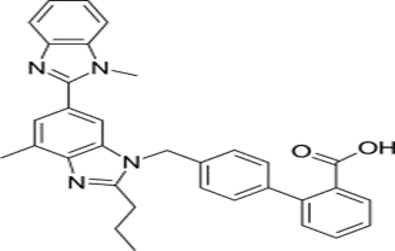
Figure 1: Structure of Telmisartan
Several analytical methods [10-26] have been reported for the estimation of telmisartan in bulk drug and pharmaceutical dosage forms. Early studies described simple and cost-effective UV–visible spectrophotometric procedures that were validated for linearity, accuracy, precision, specificity, ruggedness, and robustness. One such method obeyed Beer–Lambert’s law over the concentration range of 2–22 µg/mL and was successfully applied to telmisartan tablets. A review of the published literature indicates that most reported methods have been validated according to ICH recommendations using parameters such as specificity, linearity and range, accuracy, precision, robustness, limit of detection, and limit of quantification. However, differences in solvent composition, detection wavelength, calibration range, and sample preparation demonstrate the need for a simple, economical, sensitive, and reliable method suitable for routine quality-control analysis. Therefore, the present study focuses on the development and validation of a UV–visible spectrophotometric method for estimating telmisartan in pharmaceutical dosage forms over the concentration range of 2–12 µg/mL.
Methodology
Materials:
Telmisartan API (Gifted by, Cubic Analytical Solution, Ankleshwar, Gujarat India), Marketed formulation (TELMIRIDE-40, UNISON PHARMACEUTICALS PVT. Ltd., India) Whatman filter paper no. 41
Instrumentation:
A Shimadzu UV–visible spectrophotometer (Model 1800) was used for the analysis of telmisartan. The instrument contains deuterium and tungsten-halogen lamps as UV and visible light sources, respectively. A monochromator selects the required wavelength, and the radiation passes through the sample placed in a suitable cuvette. The detector measures the transmitted light, and the result is displayed as absorbance.
Preparation of Stock Solution
An accurately weighed quantity of 50 mg of telmisartan was transferred into a 50 mL volumetric flask. The drug was dissolved in methanol, and the solution was diluted up to the mark with the same solvent to obtain a stock solution with a concentration of 1,000 µg/mL.
Working solution of Telmisartan
Accurately transferred 1 mL stock solution of telmisartan in 10 mL volumetric flasks, dissolved in, and diluted to the mark with methanol to obtain a standard solution of 100 µg/mL. Then, accurately transferred 1 mL stock solution of telmisartan in 10 mL volumetric flasks, dissolved in, and diluted to the mark with methanol to obtain a standard solution of 10 µg/mL.
Preparation of Test Solution
Twenty telmisartan tablets were accurately weighed and finely powdered. A portion of the powder equivalent to 40 mg of telmisartan was transferred into a 100 mL volumetric flask. Approximately 30 mL of methanol was added, and the solution was sonicated for 10 minutes to ensure complete dissolution. The volume was then made up to the mark with methanol and mixed thoroughly. The resulting solution was filtered before analysis. The prepared solution was filtered through Whatman No. 41 filter paper, and the first few millilitres of the filtrate were discarded. Subsequently, 0.1 mL of the filtrate was transferred into a 10 mL volumetric flask and diluted to the mark with methanol to obtain a final telmisartan concentration of 4 µg/mL.
Selection of Analytical Wavelength
Standard working solutions of telmisartan at concentrations ranging from 2 to 12 µg/mL were prepared in methanol by suitable dilution. The solutions were scanned over the wavelength range of 200–400 nm using a UV–visible spectrophotometer. The maximum absorbance wavelength (λmax) of telmisartan was observed at 296 nm, which was selected as the analytical wavelength for further analysis.
Method Validation
The developed UV–visible spectrophotometric method for the estimation of telmisartan was validated according to International Council for Harmonisation (ICH) guidelines. The method was evaluated for linearity, accuracy, precision, robustness, limit of detection, and limit of quantification. [27]
Linearity
Linearity was assessed by preparing a series of telmisartan solutions at different concentration levels. Aliquots of 0.2, 0.4, 0.6, 0.8, 1.0, and 1.2 mL of the standard stock solution were separately transferred into a series of 10 mL volumetric flasks. Each solution was diluted to volume with methanol to obtain concentrations within the selected linearity range. The absorbance of each solution was measured at the analytical wavelength of 296 nm using methanol as the blank. A calibration curve was constructed by plotting absorbance against the corresponding concentration of telmisartan. Linearity was evaluated from the regression equation and correlation coefficient.
Accuracy
The accuracy of the developed method was evaluated using the standard-addition method. A pre-analyzed telmisartan tablet sample was spiked with known quantities of telmisartan standard corresponding to 80%, 100%, and 120% of the nominal sample concentration. The spiked samples were thoroughly mixed, extracted with methanol, and analyzed at 296 nm. The amount of telmisartan present was calculated using the regression equation obtained from the calibration curve. Accuracy was expressed as the percentage recovery of the added standard.
Precision
The repeatability of the method was evaluated by repeatedly analyzing a 4 µg/mL telmisartan solution and recording the absorbance responses. Intra-day precision was determined by analyzing telmisartan solutions at three concentration levels 4, 6, and 8 µg/mL three times on the same day. Inter-day precision was assessed by analyzing the same concentrations on three different days. The precision results were expressed as percentage relative standard deviation (%RSD).
Robustness
The robustness was studied by analyzing the samples of telmisartan with deliberate but slight variations in the method parameters. A change in the response to telmisartan was observed. The robustness of the method was studied by changing the wavelength by ±2 nm at a concentration of 4 μg/mL. The changes in the response of telmisartan were noted and compared with the original response.
Assay of Telmisartan Tablets
The applicability of the proposed method was evaluated by analyzing the commercially available Telmiride-40 tablets, labeled to contain 40 mg of telmisartan. Six aliquots of the prepared tablet sample solution were separately diluted with methanol and analyzed at the selected analytical wavelength. The amount of telmisartan present in the formulation was calculated using the calibration equation.
RESULTS AND DISCUSSION
A simple, accurate, and precise UV–visible spectrophotometric method was developed and validated in accordance with ICH guidelines for the estimation of telmisartan in pharmaceutical tablet dosage forms. The method was based on measuring the absorbance of telmisartan at 296 nm using methanol as the solvent and blank.
Linearity
The calibration curve for telmisartan was prepared by plotting absorbance against concentration over the range of 2–12 µg/mL. (Fig. 2 and table no. 1) A linear relationship was observed between telmisartan concentration and absorbance at 296 nm. (Fig. 3 and table no. 2) The method showed a correlation coefficient of 0.99, indicating good linearity within the selected concentration range.
Table No. 1: Linearity Data od developed method
|
Sr. No. |
Conc. of Telmisartan (µg/ mL) |
Mean absorbance at 296 nm ± SD (n= 6) |
% RSD |
|
1 |
2 |
0.102 ± 0.001 |
0.98 |
|
2 |
4 |
0.222 ± 0.002 |
0.90 |
|
3 |
6 |
0.431 ± 0.0035 |
0.81 |
|
4 |
8 |
0.605 ± 0.0050 |
0.83 |
|
5 |
10 |
0.775 ± 0.007 |
0.90 |
|
6 |
12 |
0.988 ± 0.0087 |
0.88 |
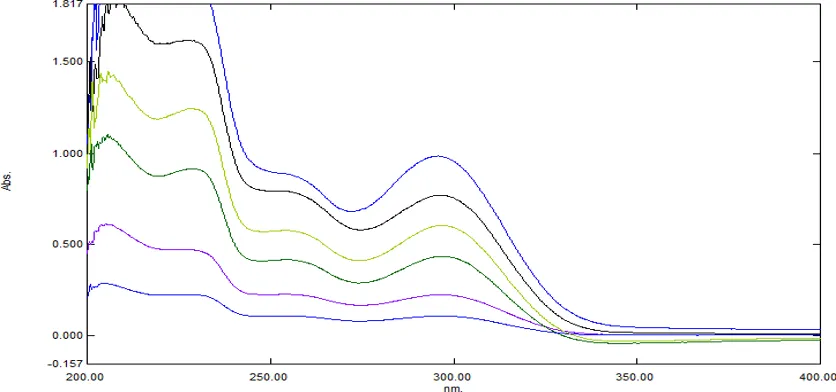
Figure 2: Overlain absorption spectra of Telmisartan (2-12 µg/mL in Methanol)
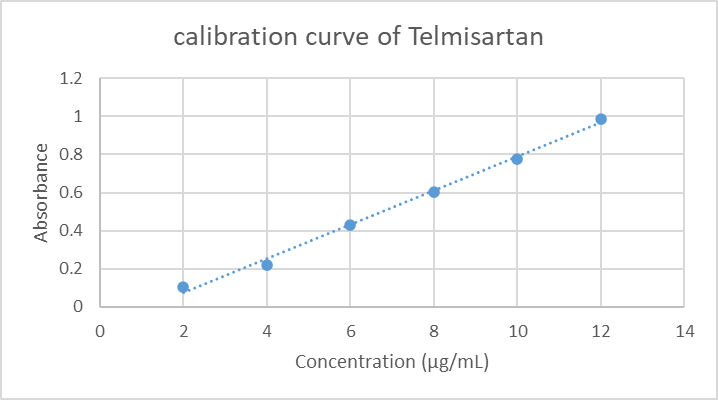
Figure 3: Calibration Curve of developed method
Table no. 2: Regression analysis data of Telmisartan
|
Parameters |
Absorbance |
|
Concentration Range (µg/ mL) |
02 - 12 |
|
Slope |
0.0895 |
|
Intercept |
-0.1058 |
|
Correlation co-efficient (R2) |
0.9958 |
Precision
The precision of the developed method was evaluated through repeatability, intra-day precision, and inter-day precision studies. The 4 µg/mL telmisartan solution was analyzed repeatedly to assess repeatability. Intra-day precision was determined by analyzing 4, 6, and 8 µg/mL solutions three times on the same day, whereas inter-day precision was evaluated by analyzing the same concentrations on three different days. The obtained absorbance responses were consistent, and the percentage relative standard deviation (%RSD) values were within the generally accepted limit of 2%. (table no. 3 and 4)These results indicate that the method has good repeatability and intermediate precision and is suitable for the routine estimation of telmisartan in pharmaceutical tablet dosage forms.
Table no. 3: Results of Repeatability
|
Sr. No. |
Absorbance of Telmisartan |
|
1 |
0.222 |
|
2 |
0.220 |
|
3 |
0.224 |
|
4 |
0.222 |
|
5 |
0.221 |
|
6 |
0.224 |
|
Mean |
0.222 |
|
SD |
0.0016 |
|
%RSD |
0.72 |
Table no. 4: Results of Precision (% RSD)
|
Drug |
Concentration (µg/ mL) |
Intra- day precision |
Inter- day precision |
||
|
Mean ± SD (n=3) |
%RSD |
Mean ± SD (n=3) |
%RSD |
||
|
Telmisartan |
4 |
0.225±0.001 |
0.44 |
0.227±0.001 |
0.44 |
|
6 |
0.433±0.0032 |
0.74 |
0.437±0.0026 |
0.60 |
|
|
8 |
0.61±0.0055 |
0.91 |
0.609±0.0055 |
0.90 |
|
Accuracy
The accuracy of the developed method was evaluated using the standard-addition method at 80%, 100%, and 120% concentration levels. The spiked telmisartan samples showed satisfactory recovery, with percentage recoveries ranging from 99.62% to 100.58%. (table no. 5) These results indicate good agreement between the added and recovered amounts of telmisartan.
Table no. 5: Accuracy Data for Telmisartan
|
Level |
Amt. of test (µg/ mL) |
Amt. of std. added (µg/mL) |
Total amount found ± SD |
% Recovery ± SD (n=3) |
% RSD |
|
80 % |
4 |
3.2 |
7.26 ± 0.03 |
100.42 % ± 0.43 |
0.42 |
|
100 % |
4 |
4 |
8.04 ± 0.050 |
100.58 % ± 0.63 |
0.62 |
|
120 % |
4 |
4.8 |
8.76 ± 0.058 |
99.62 % ± 0.66 |
0.66 |
Robustness
The method produced consistent absorbance responses under the altered conditions. The percentage relative standard deviation (%RSD) remained within the acceptable limit of 2%, (table no. 6) indicating that the method was not significantly affected by the selected variations.
Table no. 6: Results of robustness for Telmisartan
|
Wavelength |
Conc. (µg/mL) |
Telmisartan |
|
|
Absorbance ± SD (n=3) |
%RSD |
||
|
At 296 nm |
4 |
0.227±0.002 |
0.88 |
|
At 298 (+2 nm) |
4 |
0.230±0.0020 |
0.90 |
|
At 294 (-2 nm) |
4 |
0.227±0.0015 |
0.67 |
Assay of the Pharmaceutical Formulation
The proposed UV–visible spectrophotometric method was applied to the commercially available Telmiride-40 tablet formulation, labeled to contain 40 mg of telmisartan. The assay result was found to be 99.97% of the labeled claim, with a percentage relative standard deviation (%RSD) of 0.14%. (table no. 7) The high assay value, together with the low %RSD, indicates accurate and precise estimation of telmisartan in the tablet dosage form. The result also confirms that the method is reliable and suitable for routine quality-control analysis of telmisartan tablets.
Table no. 7: Assay result of the proposed method of formulation
|
Sr. No. |
Drug |
Amount taken (mg) |
Amount found (mg)±SD |
% Assay ± SD (n=6) |
% RSD |
|
1 |
TELMI |
4 |
4.09 ± 0.01 |
99.97 % ± 0.144338 |
0.14 |
CONCLUSION
A simple, accurate, precise, and robust UV–visible spectrophotometric method was successfully developed for the estimation of telmisartan in pharmaceutical tablet dosage forms. The method showed good linearity over the concentration range of 2–12 µg/mL at an analytical wavelength of 296 nm, with a correlation coefficient of 0.9958. The method demonstrated satisfactory accuracy, with percentage recoveries ranging from 99.62% to 100.58%. Precision studies showed good repeatability and reproducibility, with acceptable %RSD values. The method was also found to be robust against small deliberate changes in analytical conditions. The proposed method was successfully applied to Telmiride-40 tablets and showed an assay value of 99.97% of the labeled claim, with a %RSD of 0.14%. Therefore, the developed UV–visible spectrophotometric method is suitable for routine quality-control analysis of telmisartan in pharmaceutical dosage forms because it is simple, economical, reliable, and environmentally friendly.
Acknowledgment
I sincerely acknowledge Shri Sarvajanik Pharmacy College for providing the necessary facilities and support to complete this research work.
Abbreviation
API: Active Pharmaceutical ingredients; RSD: Relative standard deviation; SD: Standard deviation; STD: Standard; Cone.: Concentration; mL: Milliliter; μg: Microgram; %: Percentage; v/v: Volume by volume; mg: Milligram
REFERENCES


Mishva Patel, Prachi Patel, Dr. Khushbu Patel, Dr. C. N. Patel, Jinal Goswami, Development And Validation of an UV-Visible Spectrophotometric Method for the Estimation of Telmisartan in Tablet Dosage Form, Int. J. of Pharm. Sci., 2026, Vol 4, Issue 8, 5087-5095, https://doi.org/10.5281/zenodo.22201953
 10.5281/zenodo.22201953