

We use cookies to ensure our website works properly and to personalise your experience. Cookies policy
Department of Pharmaceutical Quality Assurance, BLDEA's SSM College of Pharmacy and Research Centre, Vijayapura, Karnataka, India 586103
Analytical method development and validation form a cornerstone of pharmaceutical quality assurance, ensuring the identity, purity, potency, and performance of drug substances and products. Taurolidine, a synthetic antimicrobial derivative of the amino acid taurine, is widely employed as a catheter-lock solution and in the management of peritonitis, yet no dedicated first-order derivative or area under curve (AUC) UV-spectrophotometric method has previously been reported for its estimation. The present study was therefore undertaken to develop and validate simple, rapid, accurate, and economical UV-spectrophotometric methods for the quantification of Taurolidine in bulk drug and marketed tablet formulations. Methanol was selected as the analytical solvent after comparative solubility screening against distilled water, dimethyl sulfoxide, and ethanol. Calibration was established over a concentration range of 15–90 µg/mL. The first-order derivative method exhibited excellent linearity (r² = 0.9980; slope 0.0446; intercept 0.0507), while the AUC method, measured between 200 and 300 nm, also demonstrated strong linearity (r² = 0.9940; slope 0.1792; intercept 0.2537). Both methods were validated as per International Council for Harmonisation (ICH) Q2(R1) guidelines for linearity, accuracy, precision, and robustness. Recovery studies at 80, 100, and 120% levels gave mean recoveries of 99.16–100.22% for the derivative method and 99.11–100.32% for the AUC method, with %RSD values below 2% in both cases. Application to marketed tablet formulations (20 mg label claim) gave assay values of 99.65 ± 0.54% (first-order derivative) and 99.21 ± 0.62% (AUC), both within pharmacopeial acceptance limits of 98–102%. The first-order derivative method showed marginally superior precision, whereas the AUC method offered comparable accuracy with operational simplicity. Both validated methods represent simple, sensitive, and cost-effective alternatives to chromatographic techniques for the routine quality control analysis of Taurolidine.
Analytical method development and validation constitute an essential component of analytical chemistry and play a decisive role in the discovery, development, and manufacture of pharmaceutical products. Official test methods emerging from these activities are routinely used by quality control laboratories to confirm the identity, purity, potency, and overall performance of drug products, all of which are essential prerequisites for ensuring drug safety and therapeutic efficacy. As regulatory expectations continue to tighten and pharmaceutical formulations grow increasingly complex, the demand for analytical procedures that are simple, rapid, sensitive, and economical—while still meeting internationally accepted validation criteria—has grown correspondingly.
1.1 Drug Profile: Taurolidine
Taurolidine is a synthetic antimicrobial compound derived from the amino acid taurine. It belongs to a class of broad-spectrum antimicrobial agents and exhibits activity against a wide range of Gram-positive and Gram-negative bacteria as well as fungi. The compound has found extensive clinical application in the prevention and treatment of infections associated with catheters, surgical procedures, and implanted medical devices, and it is particularly valued for its effectiveness in preventing catheter-related bloodstream infections (CRBSIs), where it is commonly employed as a catheter-lock solution. Beyond its antimicrobial action, Taurolidine possesses anti-inflammatory and anti-endotoxin properties that help mitigate tissue damage arising from microbial toxins.
Clinically, Taurolidine is used in the prevention and management of catheter-related infections, in the treatment of peritonitis (particularly among dialysis patients), and as an antimicrobial lock solution in indwelling medical devices. Reported adverse effects associated with its administration include local irritation, a burning sensation at the site of administration, nausea, hypersensitivity reactions, mild pain, and general discomfort.
1.2 Need for the Study
A number of analytical techniques including UV spectrophotometry, HPLC, RP-HPLC, LC-MS/MS, UPLC, RP-UPLC, and extraction spectroscopy have been reported for the estimation of Taurolidine in bulk and pharmaceutical dosage forms. However, most of these existing methods are expensive, time-consuming, and dependent on specialized instrumentation and trained personnel. To date, no specific first-order derivative or area under curve UV-spectrophotometric method has been reported for the estimation of Taurolidine. The present work was therefore undertaken to develop a straightforward, accurate, and precise first-order derivative method and area under curve method for Taurolidine using a UV-visible spectrophotometer, thereby providing the pharmaceutical industry with cost-effective alternatives to chromatographic techniques for routine quality control.
1.3 Aim and Objectives
The aim of the present work was to develop a simple, accurate, precise, and cost-effective UV-spectrophotometric method for the quantitative estimation of Taurolidine in bulk drug and pharmaceutical dosage forms. The specific objectives were as follows:
2. REVIEW OF LITERATURE
A number of prior investigations have informed the analytical and pharmacological context of the present work. Woolfson et al. developed a sensitive reverse-phase HPLC method with fluorescence detection for the analysis of taurolidine degradation products and metabolites; the method demonstrated excellent linearity, low detection limits, and good recovery from plasma, supporting its suitability for the reliable quantitative analysis of taurultam and taurinamide in biological matrices [16].
Ozbek et al. developed and validated a rapid reverse-phase HPLC method for the determination of cisplatin using a C18 column with UV detection at 204 nm; the method exhibited excellent linearity over the concentration range of 20–150 µg/mL and was validated in accordance with ICH guidelines, confirming its suitability for routine quantitative analysis [17].
Caruso et al. reported that Taurolidine exhibits broad-spectrum antimicrobial activity and effectively inhibits the adhesion of pathogens such as Escherichia coli and Staphylococcus aureus to epithelial cells, with the antimicrobial action mediated through active degradation products and strong binding to bacterial adhesion proteins [18].
Wang, Guo, and co-workers developed an optimized ultrasound-assisted extraction (UAE) method for taurine from Porphyra yezoensis, achieving a maximum yield of 13.0 mg/g under optimized conditions; the method demonstrated significantly higher extraction efficiency than conventional techniques, and the purified taurine was characterized using FTIR, mass spectrometry, and NMR analysis [19].
Collectively, these reports establish the pharmacological importance of Taurolidine and taurine-related compounds, while also confirming that chromatographic techniques although sensitive remain resource and time intensive, reinforcing the rationale for a simpler UV-spectrophotometric alternative such as the one developed in the present study.
3. DRUG PROFILE
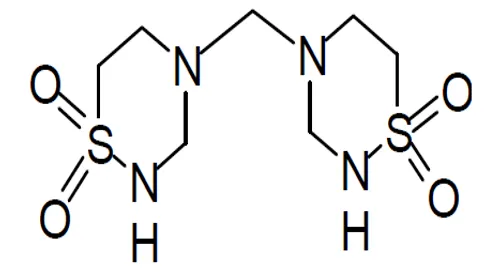
IUPAC NAME: 4-[(1,1-dioxo-1,2,4-thiadiazinan-4-yl)methyl]-1,2,4-thiadiazinane 1,1-dioxide.
Molecular Formula: C7H16N4O4S2.
MOLECULAR WEIGHT: 284.36g\mol
CATEGORY: Taurolidine is a broad spectrum antimicrobial agent. It is commonly used for prevention and treatment of infection.
4. MATERIALS AND METHODS
4.1 Materials
A working standard of Taurolidine was procured from SM Pharma and Chemicals, Mumbai, India. Analytical-grade methanol and distilled water were used as solvents throughout the study. A Shimadzu UV-1900 UV-visible spectrophotometer fitted with matched 1 cm quartz cells was used for all spectrophotometric measurements.
4.2 Selection of Analytical Medium
Solubility and stability were the principal criteria applied for the selection of the analytical medium; the chosen solvent was required to completely dissolve the drug while maintaining its stability for a sufficient duration. Preliminary solubility trials were carried out using distilled water, dimethyl sulfoxide (DMSO), ethanol, and methanol. Taurolidine formed a precipitate in distilled water and was incompletely dissolved in DMSO and ethanol. Methanol, in contrast, completely dissolved the drug and produced good absorbance characteristics, and was therefore selected as the analytical solvent for the entire study.
4.3 Preparation of Standard Stock Solution
A standard stock solution of Taurolidine was prepared by accurately weighing 50 mg of the drug, dissolving it in methanol, and transferring the solution to a 50 mL volumetric flask; the volume was made up to the mark with methanol to obtain a stock solution of 1000 µg/mL. Working solutions in the concentration range of 15–90 µg/mL were prepared by appropriate dilution of the stock solution with methanol.
4.4 Determination of Wavelength of Maximum Absorption (λmax)
A standard solution of Taurolidine (15 µg/mL) was scanned separately over the wavelength range of 200–300 nm, and the absorbance was recorded. The drug exhibited an absorbance of 0.079 A within this scanning range, which was used as the basis for subsequent derivative and AUC measurements.
4.5 First-Order Derivative Method
Standard solutions of Taurolidine in the concentration range of 15–90 µg/mL were scanned, and the corresponding first-order derivative spectra were recorded. A calibration curve was constructed by plotting the derivative amplitude against the corresponding drug concentration.
4.6 Area Under Curve (AUC) Method
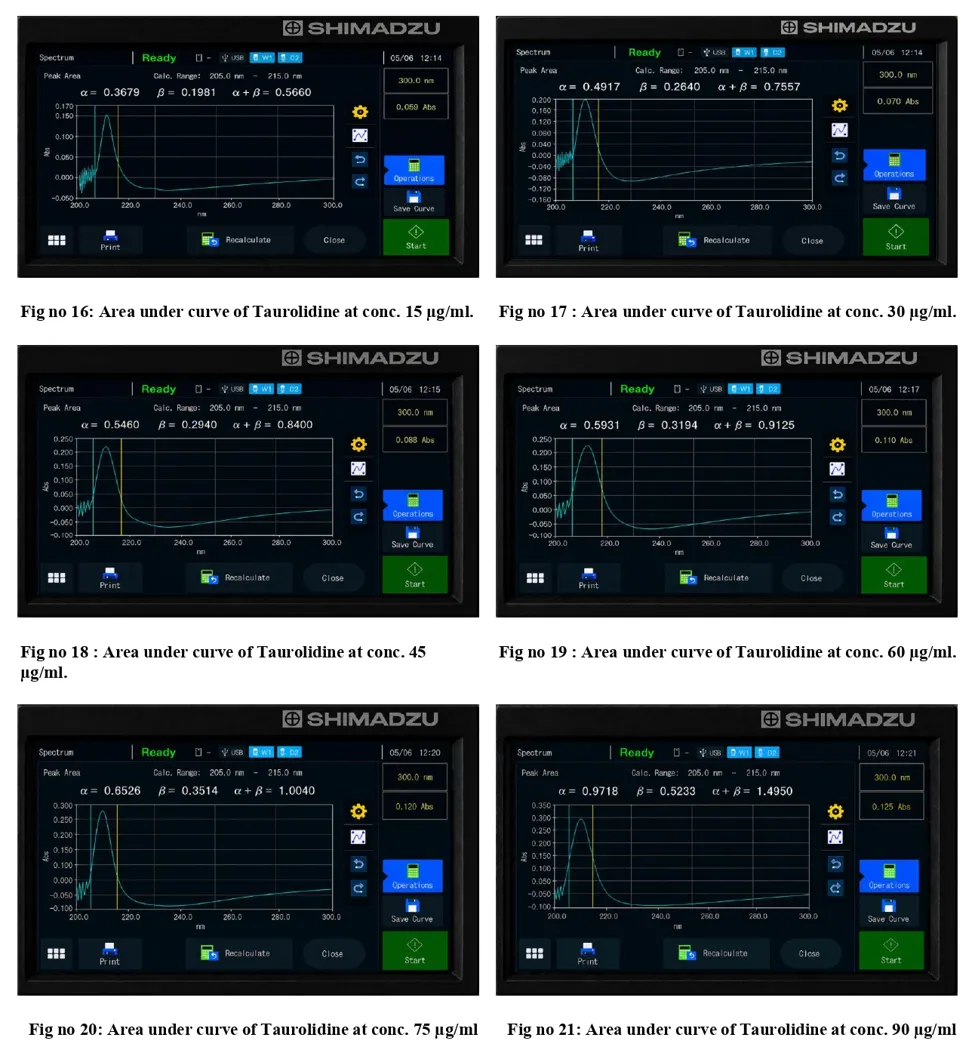
For the AUC method, the area under the absorption curve was calculated over the wavelength range of 200–300 nm for each standard solution in the concentration range of 15–90 µg/mL. The area under the curve for the 15 µg/mL solution was found to be 0.5660 within this wavelength range; a calibration curve was then constructed by plotting AUC values against the corresponding drug concentration.
4.7 Assay of Marketed Tablet Formulations
Ten tablets of Taurolidine, each containing 20 mg of drug, were accurately weighed and finely powdered. A quantity of powder equivalent to 50 mg of Taurolidine (575 mg of powdered sample) was transferred into a 50 mL volumetric flask and dissolved in a small volume of methanol. The resulting solution was filtered through Whatman filter paper to remove insoluble excipients, and the filtrate was diluted to volume with methanol to obtain a stock solution of 1000 µg/mL. Suitable aliquots of this stock solution were further diluted with methanol in 10 mL volumetric flasks to obtain working solutions in the concentration range of 15–90 µg/mL (15, 30, 45, 60, 75, and 90 µg/mL), which were used to construct the assay calibration curves for both the first-order derivative and AUC methods.
4.8 Method Validation
Both developed methods were validated as per the International Council for Harmonisation (ICH) Q2(R1) guidelines with respect to linearity, accuracy, precision, sensitivity, and robustness. Linearity was assessed across the concentration range of 15–90 µg/mL. Accuracy was determined by recovery studies performed at 80%, 100%, and 120% of the target concentration. Precision was evaluated in terms of intra-day and inter-day %RSD values, and robustness was assessed by introducing small, deliberate variations in analytical conditions and observing their effect on the assay outcome.
5. RESULTS AND DISCUSSION
5.1 First-Order Derivative Method
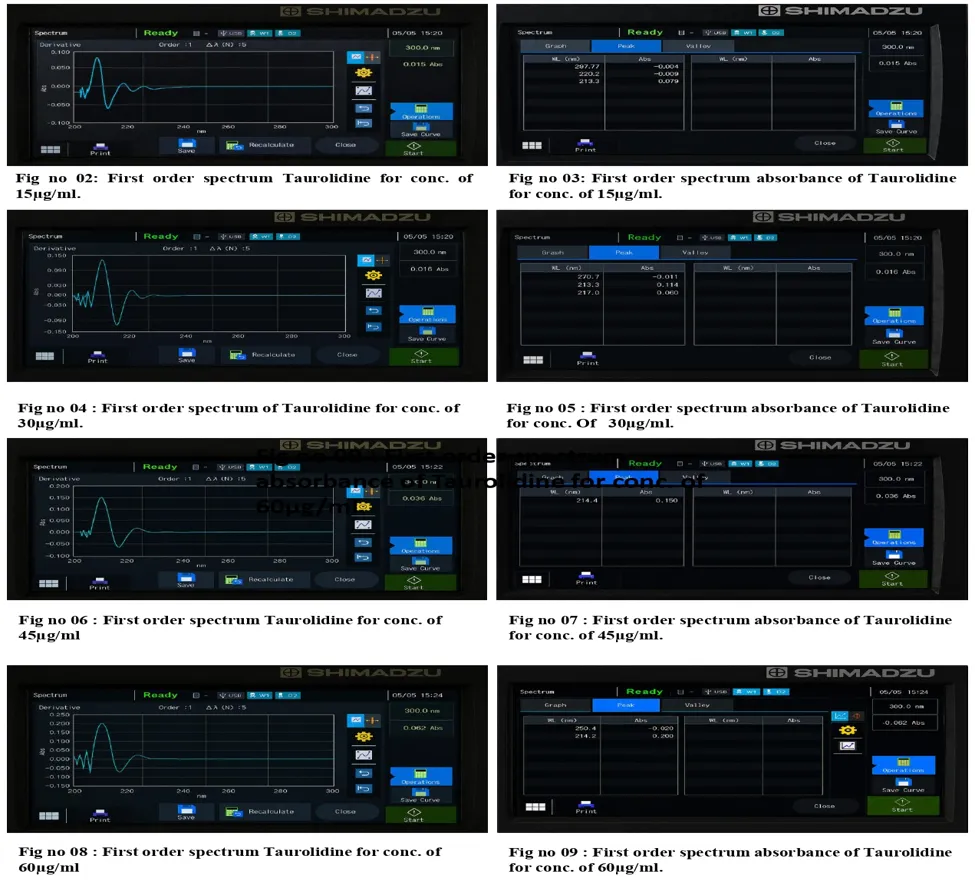
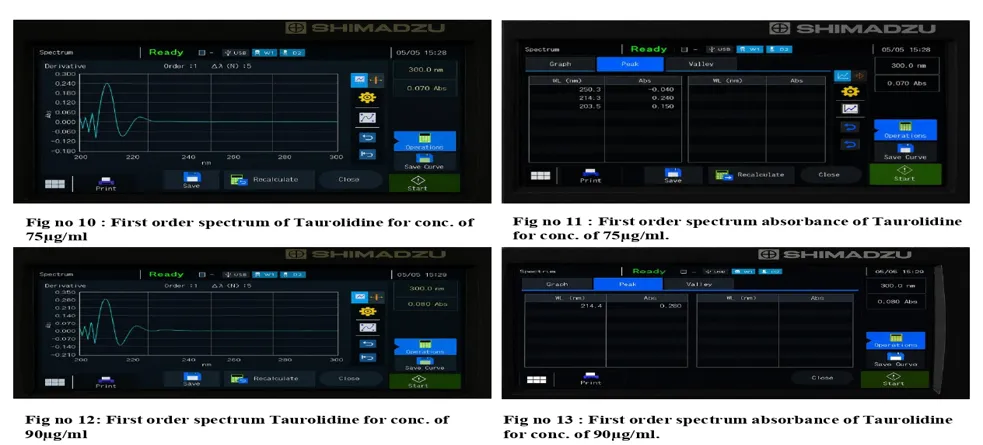
The calibration curve for Taurolidine using the first-order derivative method was constructed over the concentration range of 15–90 µg/mL, as summarized in Table 1.
Table 1. Standard calibration data for Taurolidine by the first-order derivative method
|
S. No. |
Concentration (µg/mL) |
Absorbance |
|
1 |
15 |
0.079 |
|
2 |
30 |
0.114 |
|
3 |
45 |
0.150 |
|
4 |
60 |
0.200 |
|
5 |
75 |
0.240 |
|
6 |
90 |
0.280 |

Fig No. 1 - Calibration graph for Taurolidine by first order derivative method
The calibration equation obtained was y = 0.0273x + 0.0339 (R² = 0.998), confirming a strong linear relationship between absorbance and drug concentration across the studied range. The optical and regression parameters of the calibration curve are summarized in Table 2.
Table 2. Optical and regression parameters of the calibration curve — first-order derivative method
|
Parameter |
Value |
|
Linearity range (µg/mL) |
15–90 |
|
Slope |
0.0446 |
|
Intercept |
0.0507 |
|
Regression coefficient (r²) |
0.9980 |
The method exhibited excellent linearity, with the correlation coefficient (r² = 0.9980) confirming direct proportionality between absorbance and concentration. The slope and intercept values remained consistent across replicate trials, indicating robustness of the calibration model. Accuracy, evaluated by recovery studies at 80%, 100%, and 120% levels, fell within the acceptable range, with mean recoveries between 99.16% and 100.22%. Precision studies
confirmed method reliability, with %RSD values consistently below 2%, while stability studies demonstrated that drug solutions remained stable throughout the analysis period
Application of the method to marketed tablet formulations (20 mg label claim) is summarized in Table 3
Table 3. Assay calibration data for Taurolidine tablets by the first-order derivative method
|
S. No. |
Concentration (µg/mL) |
Absorbance |
|
1 |
15 |
0.250 |
|
2 |
30 |
0.302 |
|
3 |
45 |
0.356 |
|
4 |
60 |
0.410 |
|
5 |
75 |
0.465 |
|
6 |
90 |
0.509 |

Fig No.14- Calibration graph for the assay of Taurolidine by First order derivative method.
The assay value obtained for the marketed formulation was 99.65 ± 0.54% of the label claim, with a %RSD of 0.71, comfortably within the pharmacopeial acceptance limit of 98–102%
5.2 Area Under Curve (AUC) Method
For the AUC method, the area under the absorption curve was measured over the wavelength range of 200–300 nm for standard solutions across the concentration range of 15–90 µg/mL, as summarized in Table 4.
Table 4. Standard calibration data for Taurolidine by the area under curve method
|
Sr. No. |
Concentration (µg/mL) |
Area Under Curve (AUC) |
|
1 |
15 |
0.5660 |
|
2 |
30 |
0.7557 |
|
3 |
45 |
0.8400 |
|
4 |
60 |
0.9125 |
|
5 |
75 |
1.0040 |
|
6 |
90 |
1.4950 |
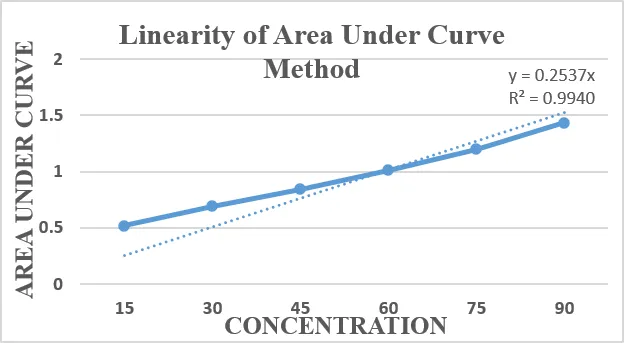
Fig 15.- Calibration graph for Taurolidine by area under curve method
The optical and regression parameters obtained for the AUC calibration curve are summarized in Table 5.
Table 5. Optical and regression parameters of the calibration curve — AUC method
|
Parameter |
Value |
|
Linearity range (µg/mL) |
15–90 |
|
Slope |
0.1792 |
|
Intercept |
0.2537 |
|
Regression coefficient (r²) |
0.9940 |
The correlation coefficient obtained for the AUC method (r² = 0.9940) was marginally lower than that of the derivative method but still indicative of strong linearity, with slope and intercept values that were consistent across trials. Accuracy results revealed mean recoveries between 99.11% and 100.32%, confirming that formulation excipients did not interfere with the estimation. Precision studies again reported %RSD values below 2%, confirming repeatability of the method.
Application of the AUC method to the assay of marketed tablet formulations is summarized in Table 6.
Table 6. Assay calibration data for Taurolidine tablets by the area under curve method
|
Sr. No. |
Concentration (µg/mL) |
Absorbance |
|
1 |
15 |
0.7563 |
|
2 |
30 |
0.9893 |
|
3 |
45 |
1.3012 |
|
4 |
60 |
1.5986 |
|
5 |
75 |
1.8975 |
|
6 |
90 |
2.0914 |
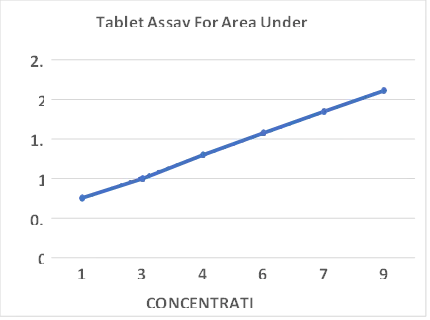
Fig No. 22- Calibration graph for the assay of Taurolidine by AUC method.
The assay of marketed tablets by the AUC method gave an average value of 99.21 ± 0.62% of label claim, with a %RSD of 0.89, again within the pharmacopeial acceptance limits.
5.3 Comparative Evaluation
Both the first-order derivative and AUC methods proved effective for the quantification of Taurolidine in bulk drug and tablet dosage forms, with assay values close to 100% of the label claim in both cases, confirming their accuracy and reliability. The first-order derivative method demonstrated slightly superior precision, as reflected in its lower %RSD values, suggesting that it may be preferable for critical applications where reproducibility is paramount. The AUC method, while marginally less precise, remains an equally valid and simpler alternative, offering practical advantages in quality control laboratories handling high sample throughput. Overall, both validated methods are simple, accurate, precise, cost-effective, and compliant with ICH guidelines, positioning them as suitable alternatives to more expensive chromatographic techniques for the routine pharmaceutical analysis of Taurolidine.
6. CONCLUSION
This study successfully developed and validated two UV-spectrophotometric methods—the first-order derivative method and the area under curve (AUC) method—for the estimation of Taurolidine in bulk drug and tablet formulations. Analytical methods of this kind are essential for ensuring the quality, safety, and efficacy of pharmaceutical products, and UV spectrophotometry was selected for its simplicity, economy, and wide applicability in routine quality control, offering a practical alternative to more advanced chromatographic techniques.
Both methods were validated in accordance with ICH Q2(R1) guidelines and satisfied all key validation criteria. Linearity was excellent across the studied concentration range, recovery values were close to 100%, confirming the absence of excipient interference, and precision studies yielded low %RSD values. Robustness testing further confirmed that minor deliberate variations in analytical conditions did not materially affect assay accuracy.
The first-order derivative method demonstrated slightly better linearity and precision compared with the AUC method, although both approaches proved accurate, reliable, and cost-effective. These validated methods are therefore well suited to the routine quality control analysis of Taurolidine in bulk drug and pharmaceutical dosage forms, and may be recommended to quality control laboratories as simple, economical alternatives to chromatographic techniques.
ACKNOWLEDGEMENTS
The authors gratefully acknowledge Dr. S. R. Karajgi, Professor and Head, Department of Pharmaceutical Quality Assurance, for guidance and supervision throughout this work, and BLDEA's SSM College of Pharmacy and Research Centre, Vijayapura, for providing the necessary laboratory facilities.
CONFLICT OF INTEREST
The authors declare no conflict of interest.
REFERENCES



Akash Alandikar, Shripad Potdar, Ajay Shahapur, Danesh Takkod, Rakshit Hulamani, Dharmanna Salutagi, Achhegav Rajkumar, Adarsh Patil, Santosh Karajgi, Development and Validation of First-Order Derivative and Area Under Curve Method by UV-Spectrophotometry for Quantification of Taurolidine in Pharmaceuticals, Int. J. of Pharm. Sci., 2026, Vol 4, Issue 7, 3600-3611. https://doi.org/10.5281/zenodo.21424362
 10.5281/zenodo.21424362