

We use cookies to ensure our website works properly and to personalise your experience. Cookies policy
Department of Pharmaceutical Analysis, Deccan School of Pharmacy, Goshamahal, Aghapura, Goshamahal Rd, near Nampally, Hyderabad, Telangana 500001.
A New Accurate, precise, Validated Analytical Method was developed for the Estimation of Mirabegron and Solifenacin Succinate in bulk and marketed pharmaceutical Dosage Form by Using UV-Visible Spectroscopy and RP-HPLC method. In UV method the maximum absorption of Mirabegron and Solifenacin Succinate was found to be 236nm and 250nm respectively. The UV Method was validated as per the ICH Guidelines. In HPLC method, the chromatographic conditions were successfully developed for the separation of Mirabegron and Solifenacin Succinate by using Symmetry C18, 5µm (4.6mm x 150mm), flow rate was 1.0 ml/min, and mobile phase was Phosphate buffer (0.02M) pH-3.8, Methanol and Acetonitrile were taken in the ratio of 60: 20: 20 % v/v, detection wavelength was 260nm. The retention times of Mirabegron and Solifenacin Succinate were found to be 2.324mins and 4.314mins respectively. The % purity of Mirabegron and Solifenacin Succinate was found to be 99.8%. The analytical method was validated according to ICH guidelines (ICH, Q2 (R1)). The linearity study of Mirabegron and Solifenacin Succinate was found in concentration range of 12µg/ml-36µg/ml and 13µg/ml -39µg/ml and correlation coefficient (r2) was found to be 0.9995 and 0.9998 respectively. The precision study was precise, robust, and repeatable. Hence the suggested UV and RP-HPLC method can be used for routine analysis of Mirabegron and Solifenacin Succinate in bulk and Pharmaceutical dosage form.
Mirabegron is a monocarboxylic acid amide obtained by formal condensation of the carboxy group of 2-amino-1, 3-thiazol-4-ylacetic acid with the anilino group of (1R)-2-{[2-(4-amino phenyl) ethyl] amino}-1-phenyl ethanol. Used for the treatment of overactive bladder syndrome. It has a role as a beta-adrenergic agonist. It is a member of 1, 3-thiazoles, an aromatic amide, a member of ethanolamines and a monocarboxylic acid amide1. Mirabegron is indicated for the treatment of overactive bladder (OAB) - with symptoms of urge urinary incontinence, urgency, and urinary frequency - either alone or in combination with Solifenacin. It is also indicated for the treatment of neurogenic detrusor over activity (NDO) in pediatric patients 3 years of age and older and weighing 35kg or more2. Mirabegron is a medication used in the management of overactive bladder. It is in the sympathomimetic class of medications. It received approval from the US Food and Drug Administration (FDA) in June 2012 for treating overactive bladder with symptoms of urge urinary incontinence, urgency, and urinary frequency3. The IUPAC Name of Mirabegron is 2-(2-amino-1, 3-thiazol-4-yl)-N-[4-[2-[[(2R)-2-hydroxy-2-phenyl ethyl] amino] ethyl] phenyl] acetamide. The Chemical Structure of Mirabegron is shown in follows
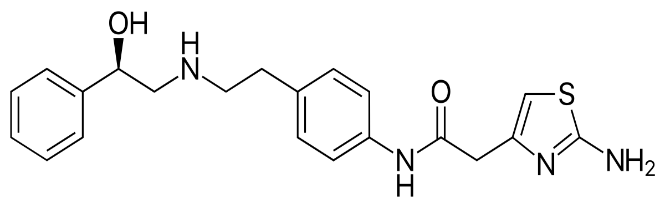
Figure: 1: Chemical Structure of Mirabegron
Solifenacin is a member of isoquinolines. Solifenacin is a competitive muscarinic receptor antagonist indicated to treat an overactive bladder with urinary incontinence, urgency, and frequency. It has a long duration of action as it is usually taken once daily4. Solifenacin was granted FDA approval on 19 November 2004. Solifenacin is a Cholinergic Muscarinic Antagonist. The mechanism of action of Solifenacin is as a Cholinergic Muscarinic Antagonist. Solifenacin is an anticholinergic and antispasmodic agent used to treat urinary incontinence and the overactive bladder syndrome5. Solifenacin has not been implicated in causing liver enzyme elevations or clinically apparent acute liver injury. The IUPAC Name of Solifenacin Succinate is [(3R)-1-aza bicycle [2.2.2] octan-3-yl] (1S)-1-phenyl-3, 4-dihydro-1H-isoquinoline-2-carboxylate; Butanedioic acid6. The Chemical Structure of Solifenacin Succinate is shown in following Figure-1.
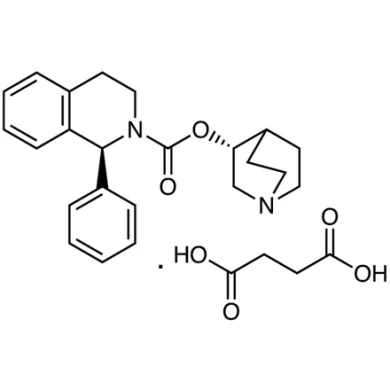
Figure: 2: Chemical Structure of Solifenacin Succinate
MATERIALS AND METHODS
UV Experiment:
Table: 1: List of Instruments
| Sr. No. | Name of Instrument | Instrument Model | Name of Manufacturer |
|---|---|---|---|
| 1 | UV-Visible double beam spectrophotometer | UV 1800 | Elico India |
| 2 | HPLC | 1575 | Hitachi LaChrome |
| 3 | Ultra Sonicator | -------- | Entrech electronics limited |
| 4 | Digital pH Meter | ------- | Lab India |
| 5 | Vacuum filtration kit | -------- | Lab India |
Table: 2: List of Chemicals
| S.No. | Name | Specifications | Manufacturer/Supplier | |
|---|---|---|---|---|
| Purity | Grade | |||
| 1. | Doubled distilled water | 99.99% | HPLC | Sd fine-Chem ltd; Mumbai |
| 2. | Methanol | 99.9% | HPLC | Loba Chem; Mumbai. |
| 3. | Dipotassium hydrogen phosphate | 96% | L.R. | Sd fine-Chem ltd; Mumbai |
| 4. | Acetonitrile | 99.9% | HPLC | Loba Chem; Mumbai. |
| 5. | Potassium dihydrogen orthophosphate | 99.9 | L.R. | Sd fine-Chem ltd; Mumbai |
| 6. | orthophosphoric acid | 99.9 | L.R. | Sd fine-Chem ltd; Mumbai |
Preparation of Standard Solution of Mirabegron
10 mg of Mirabegron was weighed accurately and transferred into 100 ml volumetric flask. About 10 ml of HPLC grade methanol was added and sonicated to dissolve. The volume was made up to the mark with same solvent. The final solution contained about 50 μg/ml of Mirabegron.
Preparation of Standard Solution of Solifenacin Succinate
10 mg of Solifenacin Succinate was weighed accurately and transferred into 100 ml volumetric flask. About 10 ml of HPLC grade methanol was added and sonicated to dissolve. The volume was made up to the mark with same solvent. The final solution contained about 40 μg/ml of Solifenacin Succinate7.
HPLC Experiment:
Table: 3: List of Equipments
| S.No. | Instrument | Model No. | Software | Manufacturer’s Name |
|---|---|---|---|---|
| 1 | HPLC Alliance | Waters 2695 | Empower | Waters |
| 2 | UV Double Beam Spectrophotometer |
UV 3000 | UV Win 5 | Lab India |
| 3 | Digital Weighing Balance |
BSA224SCW | - | Sartorius |
| 4 | pH meter | AD102U | - | Lab India |
| 5 | Ultra Sonicator | SE60US | - | - |
| 6 | Suction Pump | VE115N | - | - |
Table: 4: List of Chemical/Reagents
| S.No. | Chemical | Manufacturer | Grade |
|---|---|---|---|
| 1 | Water | Merck | HPLC Grade |
| 2 | Methanol | Merck | HPLC Grade |
| 3 | Acetonitrile | Merck | HPLC Grade |
| 4 | Potassium dihydrogen orthophosphate | Merck | A.R |
Preparation of Phosphate buffer: (pH: 3.8): Weighed 0.136 grams of KH2PO4 was taken into a 1000ml beaker, dissolved and diluted to 1000ml with HPLC water, adjusted the pH to 3.8 with ortho phosphoric acid.
Preparation of Mobile Phase: A mixture of pH 3.8 Phosphate buffer 600 mL (60%), 200 mL of MEOH (20%) and 200 mL of Acetonitrile are taken and degassed in ultrasonic water bath for 15 minutes. Then this solution is filtered through 0.45 µ filter under vacuum filtration8.
Diluent Preparation: Mobile phase is used as Diluent.
Preparation of the individual Mirabegron standard preparation: 10mg of Mirabegron working standard was accurately weighed and transferred into a 10ml clean dry volumetric flask and about 2ml of Diluent is added. Then it is sonicated to dissolve it completely and made volume up to the mark with the diluent. (Stock solution). Further 10.0 ml from the above stock solution is pipette into a 100 ml volumetric flask and was diluted up to the mark with diluent.
Preparation of the individual Solifenacin Succinate standard preparation: 10mg of Solifenacin Succinate working standard was accurately weighed and transferred into a 10ml clean dry volumetric flask and about 2ml of Diluent is added. Then it is sonicated to dissolve it completely and made volume up to the mark with the diluent. (Stock solution). Further 10.0ml from the above stock solution is pipette into a 100 ml volumetric flask and was diluted up to the mark with diluent.
Preparation of Sample Solution: (Tablet) Accurately 10 tablets are weighed and crushed in mortar and pestle and weight equivalent to 10 mg of Mirabegron and Solifenacin Succinate (marketed formulation) sample into a 10mL clean dry volumetric flask and about 7mL of Diluents is added and sonicated to dissolve it completely and made volume up to the mark with the same solvent. (Stock solution) Further 3 ml of above stock solution was pipetted into a10ml volumetric flask and diluted up to the mark with diluent.
RESULTS AND DISCUSSION
UV Analysis
Method Development:
Selection of Wavelength:
The λmax of the two ingredients i.e. Mirabegron & Solifenacin Succinate, were found to be 236 nm and 250 nm respectively in methanol as solvent system9. The isobestic point for the drugs was found at 250 nm.
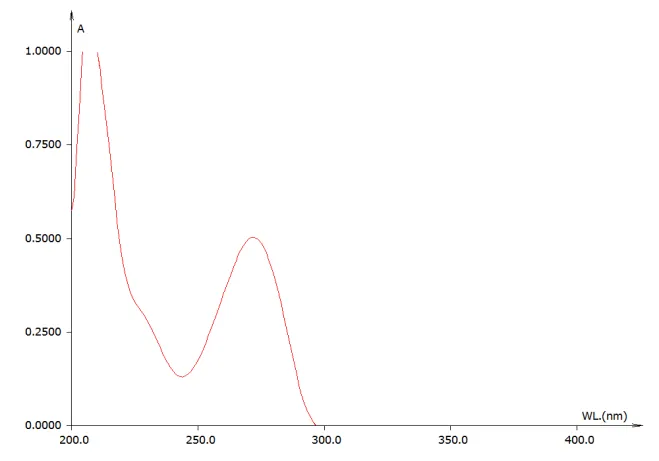
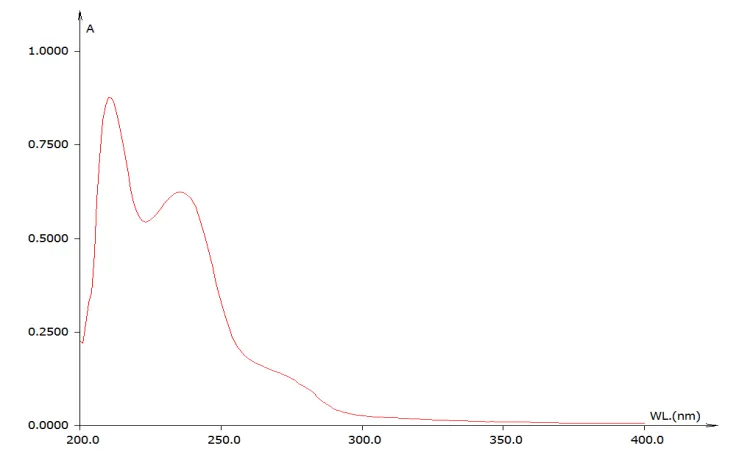
Figure: 3: Mirabegron (236nm) Fig-4:- Solifenacin Succinate (250nm)
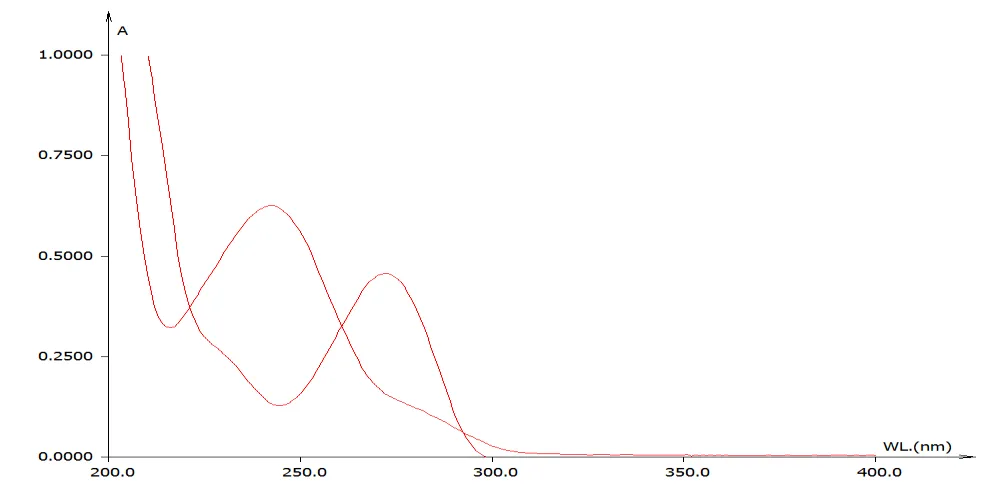
Figure: 5: Isobestic Point of Mirabegron & Solifenacin Succinate (265nm)
Validation of the Developed Method According to I.C.H Guidelines
Following parameters were taken into consideration for validation of proposed methods10:
1. Linearity
Preparation of Calibration Curve for Mirabegron & Solifenacin Succinate
Standard solutions of Mirabegron in the concentration range of 2 μg/ml to 80 μg/ml were obtained by transferring (0.2,1,2,3,4,5,6,7,8 ml) of Mirabegron stock solution (100 ppm) to the series of 10 ml volumetric flasks and standard solutions of Solifenacin Succinate in the concentration range of 5 μg/ml to 70 μg/ml were obtained by transferring (0.5,1,2,3,4,5,6,7 ml) of Solifenacin Succinate stock solution (100 ppm) to the series of 10 ml volumetric flasks. The volumes in each volumetric flask were made up with the solvent system and mixed.
The absorbances of the solutions were measured at 236 nm and 250 nm against the solvent system as blank and calibration curves were plotted. The Beer- Lambert’s law is linear in concentration range of 2 to 80 μg/ml at 236 nm and 2 to 80 μg/ml at 250 nm for Mirabegron. The Beer- Lambert’s law is linear in concentration range of 5 to 70 μg/ml at 236 nm and 5 to 70 μg/ml at 250 nm for Mirabegron11. The results are shown in Table no. 5 and 6.
Table: 5: Absorptivities of Mirabegron
| Conc. (μg/ml) | At 236nm |
|---|---|
| 2 | 0.083 |
| 10 | 0.326 |
| 20 | 0.628 |
| 30 | 0.934 |
| 40 | 1.251 |
| 50 | 1.546 |
| 60 | 1.839 |
| 70 | 2.135 |
| 80 | 2.459 |
[Figure - see the formatted PDF]
Figure: 6: Calibration Curve for Mirabegron at 236nm
Table: 6: Absorptivities of Solifenacin Succinate
| Conc. (μg/ml) |
At 250nm |
|---|---|
| 5 | 0.161 |
| 10 | 0.302 |
| 20 | 0.581 |
| 30 | 0.887 |
| 40 | 1.176 |
| 50 | 1.471 |
| 60 | 1.749 |
| 70 | 2.041 |
[Figure - see the formatted PDF]
Figure: 7: Calibration Curve for Solifenacin Succinate at 250nm.
2. Range
Range of an analytical method is the interval between the upper and lower levels (including these levels) that have been demonstrated to be determined with precision, accuracy and linearity using the method as written. It includes working range, linearity range and target range and 100% concentration or test concentration12.
3. Accuracy
The results of analysis, obtained in three group containing three replicate experiments with API and different tablet dosage forms, had good agreement with the labelled amount of the drug13.
METHOD:
In nine different 10 ml volumetric flasks, 1 ml of the pre-analyzed tablet solution (100 μg/ml) was taken and added 1, 2, 3 ml of standard solution of bulk (API) mixture (100μg/ml) and the volume was made up to 10 ml with methanol. The results are shown in Table no.7.
Table: 7: Data of Recovery Studies
| Mix. | WL. (nm) |
Conc. of Tablet Soln (ppm) |
Std. Added (ppm) |
Abs. | Amt. Found (mg) |
% Recovery |
Mean Recovery ± S.D. |
|---|---|---|---|---|---|---|---|
| 1 | 236 | 2.079 | 1 | 0.569 | 4.066 | 99.35 | MIR |
| 250 | 9.996 | 10 | 0.678 | 19.987 | 99.91 | 99.383 ± 0.752 |
|
| 236 | 2.079 | 1 | 0.568 | 4.050 | 98.55 | ||
| 250 | 9.996 | 10 | 0.677 | 19.964 | 99.68 | ||
| 236 | 2.079 | 1 | 0.570 | 4.081 | 100.10 | MIR | |
| 250 | 9.996 | 10 | 0.679 | 20.01 | 100.140 | 99.782 ± 0.216 |
|
| 2 | 236 | 2.079 | 2 | 0.851 | 6.082 | 100.075 | |
| 250 | 9.996 | 20 | 1.014 | 29.892 | 99.480 | ||
| 236 | 2.079 | 2 | 0.853 | 6.068 | 99.725 | ||
| 250 | 9.996 | 20 | 1.017 | 30.001 | 100.025 | ||
| 236 | 2.079 | 2 | 0.852 | 6.097 | 100.450 | ||
| 250 | 9.996 | 20 | 1.015 | 29.915 | 99.595 | ||
| 3 | 236 | 2.079 | 3 | 1.131 | 7.977 | 98.300 | |
| 250 | 9.996 | 30 | 1.350 | 39.879 | 99.610 | ||
| 236 | 2.079 | 3 | 1.134 | 8.024 | 99.083 | ||
| 250 | 9.996 | 30 | 1.353 | 39.947 | 99.836 | ||
| 236 | 2.079 | 3 | 1.133 | 8.008 | 98.817 | ||
| 250 | 9.996 | 30 | 1.352 | 39.924 | 99.760 |
4. Precision
Repeatability was assessed using: Six time repetition of target concentration 100 % that is (37.5µg/ml). Intermediate precision can be assessed by intra-day and inter day analysis14.
4.1 Repeatability
METHOD:
In the study of the repeatability precision which was conducted on the solution which has the concentration value 100 % of the target concentration (n = 6). The results are shown in Table-8.
Table: 8: Data of Repeatability of Absorbances
| S. No. | Conc. μg/ml |
Wavelength (nm) |
Abs. | Mean ± S.D. | % RSD |
|---|---|---|---|---|---|
| 1 | (MIR 1 + SOL 10) μg/ml | 236 | 1.067 | MIR | SOL |
| 250 | 1.272 | 7.547 ± 0.033 |
0.437 | ||
| 2 | 236 | 1.065 | |||
| 250 | 1.212 | ||||
| 3 | 236 | 1.066 | |||
| 250 | 1.272 | ||||
| 4 | 236 | 1.068 | MIR | SOL | |
| 250 | 1.274 | 37.553 ± 0.036 |
0.096 | ||
| 5 | 236 | 1.067 | |||
| 250 | 1.273 | ||||
| 6 | 236 | 1.064 | |||
| 250 | 1.270 |
5. Limit of Detection and Limit of Quantification
The detection limit (LOD) and quantitation limit (LOQ) may be expressed as15:
L.O.D. = 3.3 (SD/S) & L.O.Q. = 10 (SD/S)
Where, SD = Standard deviation of the response and S = Slope of the calibration curve
The slope S may be estimated from the calibration curve of the Analyte.
CONCLUSION:
The LOD was found to be 0.2682 μg/ml and 0.2542 μg/ml and LOQ was found to be 0.7698 μg/ml and 0.6365 μg/ml for Mirabegron and Solifenacin Succinate respectively which represents that sensitivity of the method is high.
Estimation of Mirabegron and Solifenacin Succinate in Pharmaceutical dosage form
Twenty tablets were taken and the I.P. method was followed to determine the average weight.
METHOD:
Above weighed tablets were finally powdered and triturated well. A quantity of powder equivalent to 120 mg of drugs were transferred to 100 ml volumetric flask, and mixed with 70 ml of methanol and solution was sonicated for 10 minutes there after volume was made up to 100 ml with same solvent system. The solution was filtered through Whatman filter paper. Then 10 ml of the above filtrated solution was diluted to 100 ml with the solvent system .From this stock solution (1ml) was transferred to five different 10 ml volumetric flasks and volume was made up to 10 ml with same solvent system16.
The absorbances of these solutions were measured at 236 nm and at 250 nm using methanol as blank.
CONCLUSION:
The amount of drug in tablet was found to be 49.563 mg/tab for Mirabegron and 4.642 mg/tab for Solifenacin Succinate respectively.
HPLC Analysis:
Method Development:
Optimized Chromatographic Method:
Optimized Chromatographic Conditions:
Column : Symmetry C18, 5µm (4.6mm x 150mm)
Mobile phase ratio: Phosphate buffer (0.02M) pH-3.8: Methanol: Acetonitrile (60:20:20%v/v)
Detection wavelength : 260nm
Flow rate : 1.0ml/min
Injection volume : 20μl
Column temperature : Ambient
Auto sampler temperature: Ambient
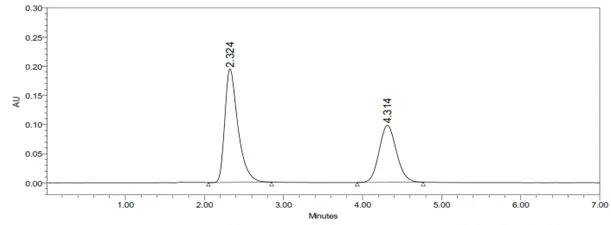
Figure: 8: Optimized Chromatographic Condition
Validation of Analytical Method:
System Suitability: System Suitability was the checking of a system to ensure system performance before or during the analysis of unknowns. Parameters such as tailing factor, resolution, plate count and reproducibility are determined and compared against the specification suitable for the method17.
Table: 9: Data of System Suitability Test for Mirabegron
| S.No. | Injection No. | RT | Area | USP Plate Count | USP Tailing | Resolution |
|---|---|---|---|---|---|---|
| 1 | Injection 1 | 2.327 | 946257 | 5245 | 1.3 | 8.6 |
| 2 | Injection 2 | 2.328 | 946325 | 5326 | 1.2 | 8.7 |
| 3 | Injection 3 | 2.319 | 946859 | 5124 | 1.3 | 8.9 |
| 4 | Injection 4 | 2.320 | 945875 | 5296 | 1.3 | 8.6 |
| 5 | Injection 5 | 2.323 | 946396 | 5248 | 1.2 | 8.9 |
| 6 | Injection 6 | 2.328 | 946548 | 5295 | 1.3 | 8.7 |
| Mean | 946376.7 | |||||
| S.D | 325.8936 | |||||
| %RSD | 0.034436 |
Table: 10: Data of System Suitability Test for Solifenacin Succinate
| S.No. | Injection No. | RT | Area | USP Plate Count | USP Tailing |
|---|---|---|---|---|---|
| 1 | Injection 1 | 4.331 | 112543 | 3854 | 1.4 |
| 2 | Injection 2 | 4.341 | 111652 | 3965 | 1.5 |
| 3 | Injection 3 | 4.299 | 112854 | 3874 | 1.3 |
| 4 | Injection 4 | 4.313 | 111485 | 3698 | 1.5 |
| 5 | Injection 5 | 4.325 | 113526 | 3785 | 1.4 |
| 6 | Injection 6 | 4.341 | 112985 | 3965 | 1.6 |
| Mean | 112507.5 | ||||
| S.D | 795.4945 | ||||
| %RSD | 0.707059 |
Linearity: Linearity is the ability of the method to elicit test results that are directly proportional to analyte concentration within a given range. Linearity is generally reported as the variance of the slope of the regression line18.
Table: 11: Chromatographic Data for Linearity Study of Mirabegron
| Concentration μg/ml |
Average Peak Area |
|---|---|
| 12 | 523864 |
| 18 | 764875 |
| 24 | 999874 |
| 30 | 1235658 |
| 36 | 1488542 |
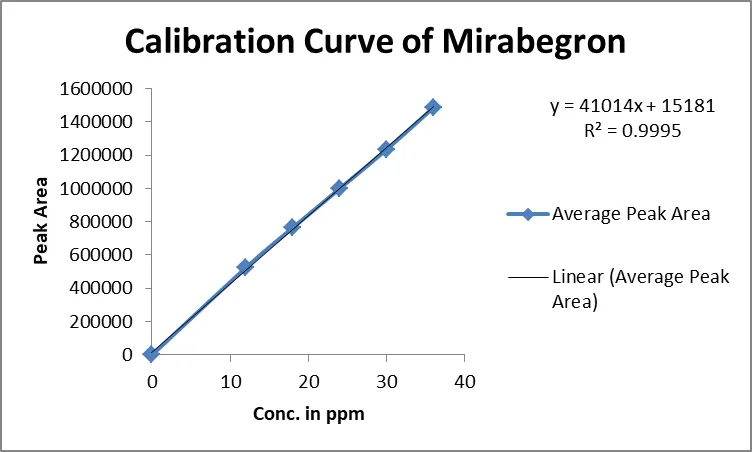
Figure: 9: Calibration Curve of Mirabegron
Table: 12: Chromatographic Data for Linearity Study of Solifenacin Succinate
| Concentration μg/ml |
Average Peak Area |
|---|---|
| 13 | 65698 |
| 19.5 | 98254 |
| 26 | 128587 |
| 32.5 | 160648 |
| 39 | 191874 |
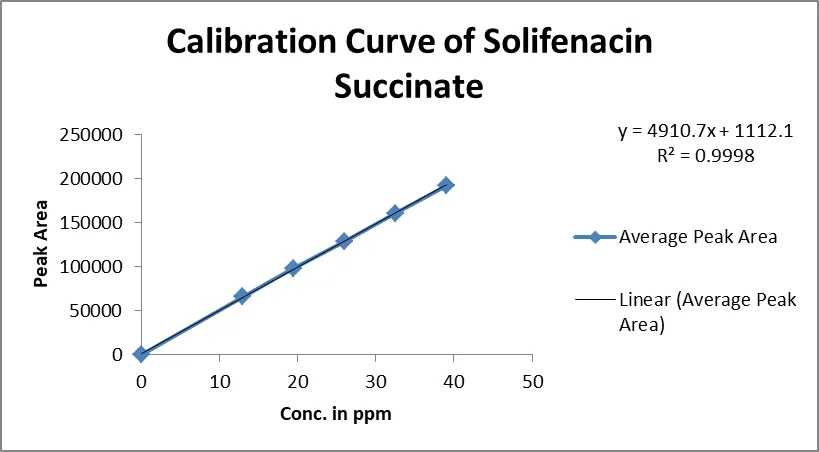
Figure: 10: Calibration Curve of Solifenacin Succinate
Accuracy: The accuracy was performed for this method by conducting the recovery studies were carried out by adding three different concentration level 50%, 100%, 150% respectively. The % recovery was found and tabulated in 13 and 14 to be in the range 98-102%19.
Table: 13: Accuracy Results of Mirabegron
| %Concentration (at specification Level) | Area | Amount added (mg) | Amount found (mg) | % Recovery | Mean Recovery |
|---|---|---|---|---|---|
| 50% | 508367 | 12 | 12.024 | 100.200% | 100.150% |
| 100% | 999100.3 | 24 | 23.989 | 99.954% | |
| 150% | 1496200.3 | 36 | 36.110 | 100.305% |
Table: 14: Accuracy Results of Solifenacin Succinate
| %Concentration (at specification Level) |
Area | Amount Added(mg) |
Amount Found(mg) |
% Recovery | Mean Recovery |
|---|---|---|---|---|---|
| 50% | 65093.67 | 13 | 13.029 | 100.223% | 100.280% |
| 100% | 129339.3 | 26 | 26.111 | 100.426% | |
| 150% | 178242.7 | 39 | 36.070 | 100.194% |
Precision:
The precision of an analytical procedure expresses the closeness of agreement (degree of scatter) between a series of measurements obtained from multiple sampling of the same homogeneous sample under the prescribed conditions20.
Repeatability:
Obtained five (5) replicates of 100% accuracy solution as per experimental conditions. Recorded the peak areas and calculated % RSD.
Table: 15: Results of Repeatability for Mirabegron:
| S. No. | Peak Name | Retention time | Area (µV*sec) |
Height (µV) |
USP Plate Count | USP Tailing | Resolution |
|---|---|---|---|---|---|---|---|
| 1 | Mirabegron | 2.321 | 946253 | 155465 | 5326 | 1.36 | 8.25 |
| 2 | Mirabegron | 2.317 | 947845 | 154578 | 5246 | 1.37 | 8.26 |
| 3 | Mirabegron | 2.323 | 945867 | 155845 | 5478 | 1.35 | 8.34 |
| 4 | Mirabegron | 2.322 | 948572 | 155698 | 5425 | 1.38 | 8.37 |
| 5 | Mirabegron | 2.324 | 949857 | 154857 | 5326 | 1.36 | 8.39 |
| Mean | 947678.8 | ||||||
| Std. Dev | 1649.66 | ||||||
| %RSD | 0.174074 |
Table: 16: Results of Repeatability for Solifenacin Succinate:
| S. No. | Peak Name | Retention time | Area (µV*sec) |
Height (µV) |
USP Plate Count | USP Tailing |
|---|---|---|---|---|---|---|
| 1 | Solifenacin Succinate | 4.304 | 111563 | 13254 | 3869 | 1.42 |
| 2 | Solifenacin Succinate | 4.300 | 111254 | 13425 | 3852 | 1.43 |
| 3 | Solifenacin Succinate | 4.308 | 111672 | 13254 | 3896 | 1.45 |
| 4 | Solifenacin Succinate | 4.310 | 112654 | 13265 | 3962 | 1.42 |
| 5 | Solifenacin Succinate | 4.314 | 113123 | 13154 | 3874 | 1.48 |
| Mean | 112053.2 | |||||
| Std. Dev | 795.2614 | |||||
| %RSD | 0.709718 |
Intermediate Precision21:
Table: 17: Results of Intermediate Precision for Mirabegron
| S.No. | Peak Name | RT | Area (µV*sec) | Height (µV) | USPPlate Count | USPTailing | Resolution |
|---|---|---|---|---|---|---|---|
| 1 | Mirabegron | 2.328 | 956325 | 156325 | 5246 | 1.35 | 8.24 |
| 2 | Mirabegron | 2.326 | 958741 | 157854 | 5367 | 1.38 | 8.26 |
| 3 | Mirabegron | 2.327 | 957542 | 156986 | 5265 | 1.34 | 8.47 |
| 4 | Mirabegron | 2.326 | 956895 | 158547 | 5384 | 1.39 | 8.29 |
| 5 | Mirabegron | 2.331 | 957486 | 156985 | 5297 | 1.35 | 8.34 |
| Mean | 957397.8 | ||||||
| Std. Dev. | 899.5091 | ||||||
| % RSD | 0.093954 |
Table: 18: Results of Intermediate Precision for Solifenacin Succinate
| S.No. | Peak Name | Rt | Area (µV*sec) | Height (µV) | USPPlate count | USPTailing |
|---|---|---|---|---|---|---|
| 1 | Solifenacin Succinate | 4.335 | 121231 | 13458 | 3896 | 1.52 |
| 2 | Solifenacin Succinate | 4.336 | 121457 | 13674 | 3785 | 1.54 |
| 3 | Solifenacin Succinate | 4.334 | 123142 | 13485 | 3969 | 1.58 |
| 4 | Solifenacin Succinate | 4.337 | 121325 | 13958 | 3859 | 1.57 |
| 5 | Solifenacin Succinate | 4.340 | 123654 | 13875 | 3789 | 1.59 |
| Mean | 122161.8 | |||||
| Std. Dev | 1145.733 | |||||
| % RSD | 0.937882 |
Method Robustness: Influence of small changes in chromatographic conditions such as change in flow rate (± 0.1ml/min), Temperature (±20C), Wavelength of detection (±5nm) & acetonitrile content in mobile phase (±2%) studied to determine the robustness of the method are also in favour of (Table-19 & 20, % RSD < 2%) the developed RP-HPLC method for the analysis of Mirabegron (API)22.
Table: 19: Result of Method Robustness
| Change in Parameter | % RSD |
|---|---|
| Flow (1.1 ml/min) | 0.96 |
| Flow (0.9 ml/min) | 0.84 |
| Temperature (270C) | 0.81 |
| Temperature (230C) | 0.94 |
| Wavelength of Detection (265 nm) | 0.56 |
| Wavelength of detection (255 nm) | 0.17 |
Table: 20: Result of Method Robustness
| Change in Parameter | % RSD |
|---|---|
| Flow (1.1 ml/min) | 0.58 |
| Flow (0.9 ml/min) | 0.64 |
| Temperature (270C) | 0.72 |
| Temperature (230C) | 0.91 |
| Wavelength of Detection (265 nm) | 0.86 |
| Wavelength of detection (255 nm) | 0.78 |
Limit of Detection (LOD) & Limit of Quantification (LOQ):
The detection limit (LOD) and quantitation limit (LOQ) may be expressed as23:
L.O.D. = 3.3 (SD/S) & L.O.Q. = 10 (SD/S)
Where, SD = Standard deviation of the response & S = Slope of the calibration curve
CONCLUSION:
The Minimum concentration level at which the analyte can be reliable detected (LOD) & quantified (LOQ) were found to be 1.377µg/ml & 4.174µg/ml respectively for Mirabegron. The LOD was found to be 1.079μg/ml and LOQ was found to be 3.272μg/ml for Solifenacin Succinate which represents that sensitivity of the method is high.
Estimation of Mirabegron & Solifenacin Succinate in Pharmaceutical Dosage Form
Twenty tablets were taken and the I.P. method was followed to determine the average weight. Finally the weighed tablets are powdered and triturated well by using mortar and pestle. A quantity of powder which is equivalent to the 100mg of drugs were transferred to a clean and dry 100ml of volumetric flask and add 70 ml of mobile phase and the resulted solution was sonicated for 15 minutes by using ultra Sonicator, Then the final volume was make up to the mark with the mobile phase24. The final solution was filtered through a selected membrane filter (0.45 µm) and in order to sonicate to degas the mobile phase (Solvent system). From this above stock solution (1 ml) was transferred to five different 10 ml volumetric flasks and volume was made up to 10 ml with same solvent system (Mobile phase).
The prepared solutions were injected in five replicates into the HPLC system and the observations were recorded.
A duplicate injection (Blank Solution) of the standard solution also injected into the HPLC system and the chromatograms and peak areas were recorded and calculated. The obtained data are shown in Table 21.
Assay % =
AT WS DT P
-------------- x ----------x --------- x ----------x Average weight = mg/tab
AS DS WT 100
Where:
AT = Test Preparation Peak Area
AS = Standard preparation Peak Area
WS = Working standard weight taken in mg
WT = Sample weight taken in mg
DS = Standard solution dilution
DT = Sample solution dilution
P = Working standard percentage purity
The assay was performed as explained in the previous chapter (Above). The results which are obtained are following25:
Table: 21: Assay of Mirabegron & Solifenacin Succinate Dosage Form
| Brand Name of Dosage forms | Labelled Amount of Drug (mg) Mirabegron/Solifenacin Succinate |
Mean (±SD) amount (mg) found by the proposed method (n=6) | Mean (± SD) Assay (n = 6) |
|---|---|---|---|
| Megatas Plus 50 Combikit (Intas Pharmaceuticals Ltd) | 50mg / 5mg | 49.586 (± 0.06) /4.686 (± 0.07) | 99.865 (±0.245) /99.658 (±0.354) |
Stability Studies
The specificity of the method can be demonstrated by applying stress conditions using acid, alkaline, peroxide, thermal, UV, water degradations. The sample was exposed to these conditions the main peak of the drug was studied for peak purity that indicating the method effectively separated the degradation products from the pure active ingredient26-27. The results were shown in figures-22 and 23.
Table: 22: Results of Forced Degradation Studies of Mirabegron
| S.No. | Stress Condition | Peak Area | % of Degraded Amount | % of Active Amount | Total % of Amount |
|---|---|---|---|---|---|
| 1 | Standard | 946124 | 0 | 100% | 100% |
| 2 | Acidic | 903311.889 | 4.525 | 95.475 | 100% |
| 3 | Basic | 910710.578 | 3.743 | 96.257 | 100% |
| 4 | Oxidative | 893670.885 | 5.544 | 94.456 | 100% |
| 5 | Thermal | 907947.896 | 4.035 | 95.965 | 100% |
| 6 | Photolytic | 940030.961 | 0.644 | 99.356 | 100% |
Table: 23: Results of Forced Degradation Studies of Solifenacin Succinate
| S.No. | Stress Condition | Peak Area | % of Degraded Amount | % of Active Amount | Total % of Amount |
|---|---|---|---|---|---|
| 1 | Standard | 111541 | 0 | 100% | 100% |
| 2 | Acidic | 107459.714 | 3.659 | 96.341 | 100% |
| 3 | Basic | 108837.246 | 2.424 | 97.576 | 100% |
| 4 | Oxidative | 107932.648 | 3.235 | 96.765 | 100% |
| 5 | Thermal | 105581.364 | 5.343 | 94.657 | 100% |
| 6 | Photolytic | 109739.612 | 1.615 | 98.385 | 100% |
SUMMARY AND CONCLUSION
Summary of UV Method:
The standard solutions of Mirabegron and Solifenacin Succinate in Methanol (10μg/ml) subjected to a scan individually at the series of wavelengths of 200 nm to 400 nm. Absorption maximum of Mirabegron and Solifenacin Succinate was found to be at 236 nm and 250nm respectively. Therefore, 265nm was selected as Isobestic Point of Mirabegron and Solifenacin Succinate for the present study. The calibration curve of Mirabegron and Solifenacin Succinate was found to be linear in the range of 2-80 μg/ml at 236 nm and 250nm respectively. Therefore, it was clear that Mirabegron and Solifenacin Succinate can be determined without interference of any irrelevant substance in single component pharmaceutical products. The used technique was initially attempted on bulk (Standard) drugs in their synthetic sample and concentrations were estimated.
The % recovery was carried out at 3 levels, 80%, 100% and 120% of Mirabegron and Solifenacin Succinate standard concentration. Three samples were prepared for each recovery level. The solutions were then analysed, and the percentage recoveries were found to be satisfactory within the acceptable limits as per the content of the label claim for marketed tablet dosage form. The newly developed method was validated according to the ICH guidelines and the method validation parameters.
The developed method was subjected to do the various method validation parameters such as specificity, accuracy, precision, linearity and range, limit of detection and limit of quantification, robustness and ruggedness etc.
Summary of HPLC Method:
To develop a precise, linear, specific & suitable stability indicating RP-HPLC method for simultaneous analysis of Mirabegron and Solifenacin Succinate different chromatographic conditions were applied & the results observed are presented in previous chapters.
Isocratic elution is simple, requires only one pump & flat baseline separation for easy and reproducible results. So, it was preferred for the current study over gradient elution.
In HPLC method, the chromatographic conditions were successfully developed for the separation of Mirabegron and Solifenacin Succinate by using Symmetry C18, 5µm (4.6mm x 150mm), flow rate was 1.0 ml/min, and mobile phase was Phosphate buffer (0.02M) pH-3.8, Methanol and Acetonitrile were taken in the ratio of 60: 20: 20 % v/v, detection wavelength was 260nm. The retention times of Mirabegron and Solifenacin Succinate were found to be 2.324mins and 4.314mins respectively. The % purity of Mirabegron and Solifenacin Succinate was found to be 99.8%. The analytical method was validated according to ICH guidelines (ICH, Q2 (R1)). The linearity study of Mirabegron and Solifenacin Succinate was found in concentration range of 12µg/ml-36µg/ml and 13µg/ml -39µg/ml and correlation coefficient (r2) was found to be 0.9995 and 0.9998 respectively.
Detection wavelength was selected after scanning the standard solution of drug over 200 to 400nm. From the U.V spectrum of Mirabegron and Solifenacin Succinate it is evident that most of the HPLC work can be accomplished in the wavelength range of 240-300 nm conveniently. Further, a flow rate of 1 ml/min & an injection volume of 20 µl were found to be the best analysis.
The result shows the developed method is yet another suitable method for assay & stability which can help in the simultaneous analysis of Mirabegron and Solifenacin Succinate in different formulations.
REFERENCES

Husna Kanwal Qureshi, Saniya Banu, Development and Validation of New Analytical RP-HPLC Method for Simultaneous Estimation of Mirabegron and Solifenacin Succinate in Bulk and Marketed Pharmaceutical Dosage Form, Int. J. of Pharm. Sci., 2026, Vol 4, Issue 10, 4360-4374. https://doi.org/10.5281/zenodo.23722026
 10.5281/zenodo.23722026