
We use cookies to ensure our website works properly and to personalise your experience. Cookies policy
School of Pharmacy, Dr. A.P.J. Abdul Kalam University, Indore
RP-HPLC analyzes Griseofulvin pills. Griseofulvin was separated at 25ºC at 0.7 ml/min using a Younglin (S.K) isocratic System UV Detector and C18 column (250mm×4.6 mm i.d, 5?m 260nm acetonitrile/water (pH 2.4) 80: Linearity (r2 = 0.997) was found from 20-100?. The Griseofulvin LOD and LOQ were 0.53?g/ml and 1.62?g/ml, respectively. Results confirmed procedure sensitivity. The drug delivered 99.58 percent Griseofulvin. For labeling, it estimated medication amounts. Griseofulvin recovered 97.74-101.80 at 80, 100, and 120%. Trials showed repeatability, accuracy, and RSD < 2. A low R.S.D. implies method accuracy and reproducibility. Changing mobile phase composition and flow rate to verify technique durability. In pharmaceutical formulation, tablet excipients did not impact chromatography. Assessing RP-HPLC ICH compliance.
Introduction
Drug development requires analytical method development and validation. Consider accuracy, precision, sensitivity, selectivity, robustness, ruggedness, sample size, analyte concentration,time, cost, and equipment availability when choosing an analytical method.
Development of Methods
Some analysis uses art and literature. More effective approaches match samples and gear. Method specifications, instrumentation, and purpose must be chosen during development. Detect drug solubility, column, mobile phase, detectors, quantization. Development considers all method parameters. Many reasons exist to develop a new analysis method. Non-methodable matrix analytes exist. Some methods fail. Costly, time-consuming, energy-intensive, or unautomatable procedures exist. Some methods miss samples. Tech boosts ROI, analyte detection, limits, accuracy, and precision. Analytical methods may need legal or scientific alternatives. Select “analyteparameters” and tools. To maximize method, analyze analytes. Develop methods using only well-identified, documented, and pure analytical standards. Safety measures lower risks. Finally, instrumental, classical, and wet-chemical analyses are measured.Chemical gravimetric and volumetric analyses measure mass or solution. HPLC, NMR, and spectrophotometers measure electricity and radiation.
Development and Validation of RP-HPLC Method for Determination of Griseofulvin in Tablet Dosage form.
Table 1.1: Instrument Specification
|
Instruments |
Younglin (S.K) |
|
Software |
Autochro-3000 |
|
Injector |
Rheodyne Injector |
|
Column |
C18 column with 250 mm × 4.6 mm id and 5µm particle size |
|
Detector |
UV detector |
|
Injection volume |
20µl |
2.Reagents&Material
KDPP, orthophosphoric acid, HPLC-grade acetonitrile, water. Locally bought hetero Drugs Limited gliseofulvin. A precision weighing scale (Wensar Instruments, Hyderabad) and micro pipette (10-100 µl) were used in labs for the study. Hot air ovens can dry glassware cleaned with acetone, acetic anhydride, and hot water. A 25ºC working environment was maintained. Melting point analysis verified sample structure and purity.
Table 1.2: Different Trials of Chromatographic Condition
|
Fig. No. |
Column used |
Mobile phase, Flow Rate and Wavelength |
Inj. Vol. |
Observation |
Conclusion |
|
1 |
Primesil C18 (250 ×4.6mm, 5.0μ) |
Water: Acetonitrile (20:80), WL: 259nm, Flow rate 0.5ml, PH 2 |
20µl |
Sharp peak were not obtained |
Hence rejected |
|
2 |
Primesil C18 (250 ×4.6mm, 5.0μ) |
Water:Acetonitrile (10:90), WL: 261 nm, Flow rate 0.1ml, PH 2.5 |
20µl |
Sharp peak were not obtained |
Hence rejected |
|
3 |
Primesil C18 (250 ×4.6mm, 5.0μ) |
Water: Acetonitrile (20:80), WL: 260nm, Flow rate 0.7ml, PH 2.4 |
20µl |
Sharp peak were obtained |
Hence selected |
|
4 |
Primesil C18 (250 ×4.6mm, 5.0μ) |
Water:Acetonitrile (20:80), WL: 260nm, Flow rate 0.7ml, PH 2.4 |
20µl |
Sharp peak were obtained |
Hence selected |
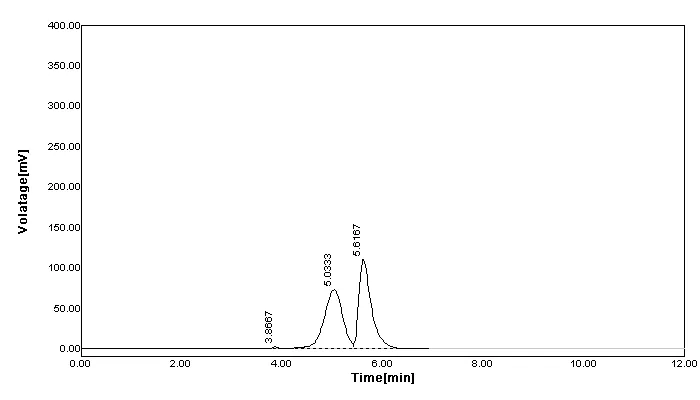
Figure 1.1: Chromatogram of Trial 1
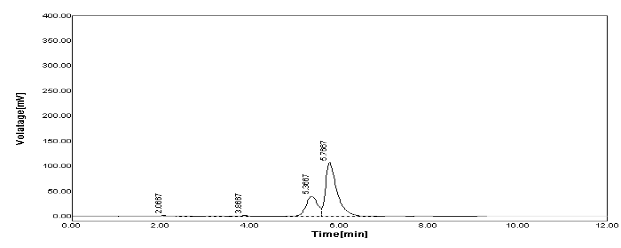
Figure 1.2: Chromatogram of Trial 2
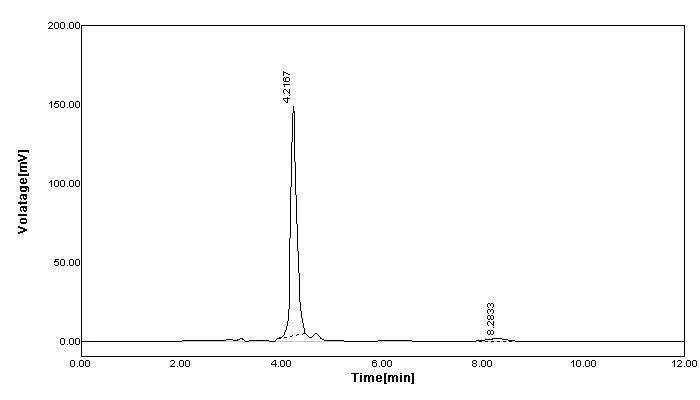
Figure 1.3: Chromatogram of Final Graph
3.HPLC Apparatus and Chromatographic Conditions
Chromatographic separation was achieved using a C-18 column (250mm × 4.6mm id.,5µm particle size) of Younglin (S.K) Gradient system that is equipped with UV Detector. Sonicator (Labindia Instruments).
Table 1.3: Chromatographic Condition
|
Sr.no. |
Parameter |
Description |
|
1 |
Stationary Phase |
C18 column with 250 mm × 4.6 mm id and 5µm particle size |
|
2 |
Mobile Phase |
Acetonitrile: Water(80:20) pH2.4 adjusted with 0.05%OPA |
|
3 |
Flow Rate |
0.7 ml/min |
|
4 |
Detection wavelength |
260nm |
|
5 |
Detector |
UV detector |
|
6 |
Injector |
Rheodyne Injector |
|
7 |
Injection volume |
20µl |
|
8 |
Column Temperature |
Ambient |
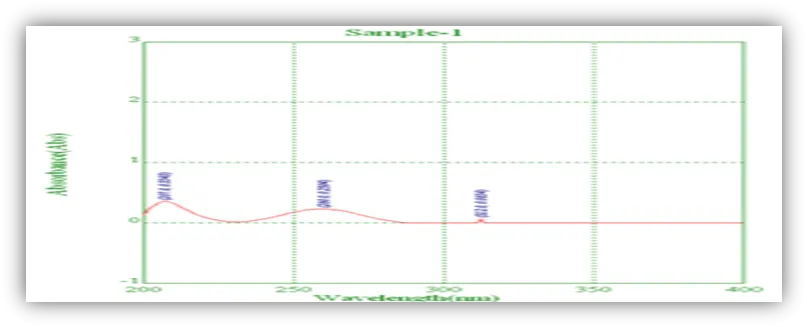
Figure 1.4: Overlaid Spectrum of Griseofulvin
4.Preparation of Sample Solutions:
Standard stock solution:
Griseofulvin, 10mg precisely weighed, was sonicated for 10 minutes in a 10ml volumetric flask with 10ml Mobile phase. A 1000 µg/ml standard stock solution is produced.
1) Mix 0.2 ml stock I with 10 ml mobile phase (20 µg/ml GRISEOFULVIN).
2) Mix 0.4 ml stock I with 10 ml mobile phase (40 µg/ml GRISEOFULVIN).
Step 3: Mix 0.6 ml stock I with 10 ml mobile phase (60 µg/ml GRISEOFULVIN).
4) Mix 0.8 ml stock I with 10 ml mobile phase (80µg/ml GRISEOFULVIN).
Step 5: Mix 1 ml stock I with 10 ml mobile phase (100 µg/ml GRISEOFULVIN).
5. Application Proposed Method to Marketed Formulation:
6.SamplePreparation:
Weighted and ground 20 pills. A 100.0 ml volumetric flask was filled with 10 mg of correctly weighed Griseofulvin tablet powder after 15 min of sonication with enough diluent. The sample was filtered using 0.45 µm Whatmann paper. Dilute 2.0 ml stock solution to 10.0 ml. Five surgeries were performed.After stationary phase equilibration, 20µl sample solutions were injected and chromatograms were obtained. Estimate Griseofulvin content from sample peak area and standard. For label claim, multiply Au x Wstd x Avg.Wt % by 100Wtab x L.C. Example peak area Standard peak area Wstd = stock Griseofulvin weight (mg).Weight of tablet powder.
Chromatogram and statistical data are shown in Figure 1.5 and Table 1.4.
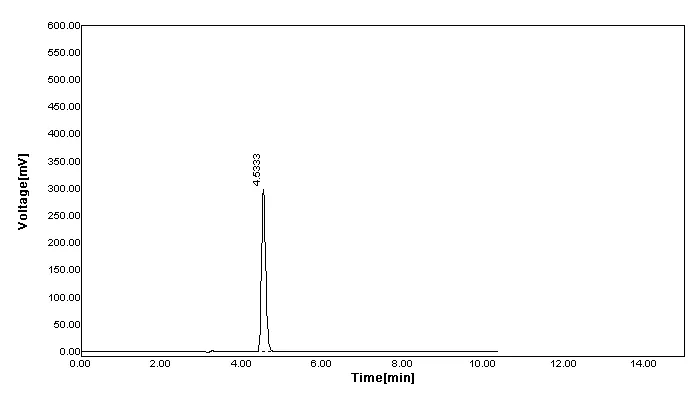
Figure 1.5: Chromatogram of Marketed Formulation of Griseofulvin
Table 1.4: Observation And Results of Estimation in Marketed Formulation
|
Sr No. |
Conc. |
Area |
Amt. found |
% lable claim |
|
1 |
60 |
1610.11 |
59.49 |
99.15 |
|
2 |
60 |
1624.53 |
60.01 |
100.02 |
|
|
|
Mean |
1617.32 |
99.58 |
|
|
|
SD |
10.20 |
0.02 |
|
|
|
% RSD |
0.63 |
0.02 |
N=2
7. Check Griseofulvin.
For separation, reverse phase HPLC was easier, harder, and more likely to generate well-resolved peaks at the proper retention period and pH. Improving Griseofulvinon HPLC resolution requires adjusting λ max, mobile phase, and flow rate.
Method accuracy is how well observational data match sample analytes. Sample concentrations were 80%, 100%, and 120%. Three samples per level yielded six ICH-legal results. Table 1.5 and Figures 1.6–1.8 show RSD % and chromatogram.
Table 1.5: Result of Recovery Study of Griseofulvin
N=2
|
Conc. |
Amt added(µg/ml) |
Amt found (µg/ml) |
%recovery |
Mean recovery |
Mean added (µg/ml) |
Mean found |
%RSD |
|
|||||||
|
80% |
16 |
36.21 |
101.32 |
15.99 |
16 |
36.99 |
1.90 |
|
|||||||
|
16 |
37.78 |
98.63 |
|
||||||||||||
|
100% |
20 |
39.74 |
98.74 |
19.64 |
20 |
74.28 |
0.72 |
|
|||||||
|
20 |
39.54 |
97.74 |
|
||||||||||||
|
120% |
24 |
43.96 |
99.59 |
24.17 |
24 |
44.20 |
1.55 |
|
|||||||
|
|
24 |
44.42 |
101.80 |
|
|
|
|
||||||||
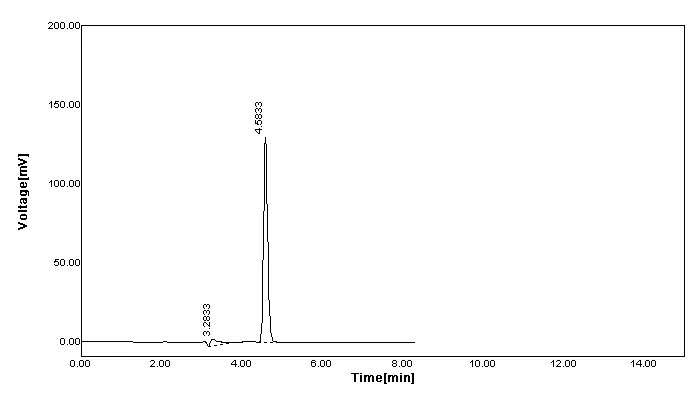

Figure 1.6: RP-HPLC Chromatogram of Griseofulvin for Recovery Study at 80% level

Figure 1.7: RP-HPLC Chromatogram of Griseofulvin for Recovery Study at 100% level
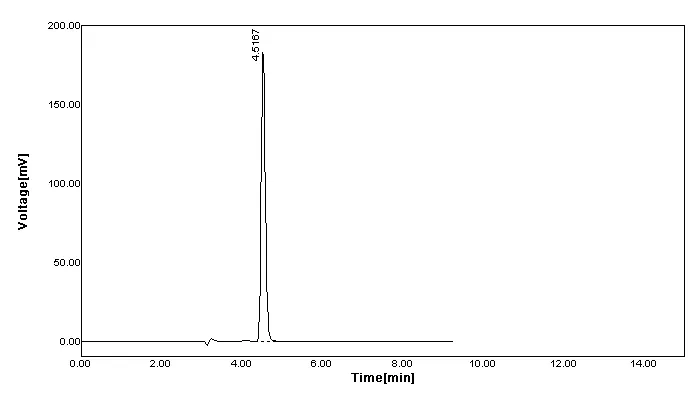
Figure 1.8: RP-HPLC Chromatogram of Griseofulvin for Recovery Study at 120% level
|
Acceptance Criteria: Mean % Recovery at each level should be between 98.0 % to 102.0% |

Figure 1.9: Chromatogram of Interday Precision for Griseofulvin (40 MCG)
Homogeneous sample analysis. Precision of relative standard deviation. Three peak reference solution injection medication responses assessed system accuracy. Fig: 1.9,1.10, 1.11 & 1.12, 1.13, 1.14 shows inter-day and intra-day chromatograms, and Table: 1.6, & 1.7 indicates peak area RSD from three replicate injections for precision, three single-dose batch samples were processed. Intermediate precision labs have analysts, equipment, and intraday/interday precision.Griseofulvin was evaluated daily at 40, 60, and 80 µg/ml for interday and intraday precision. Three-day daily variation testing employed three concentrations. The results are in Table1.6&1.7.
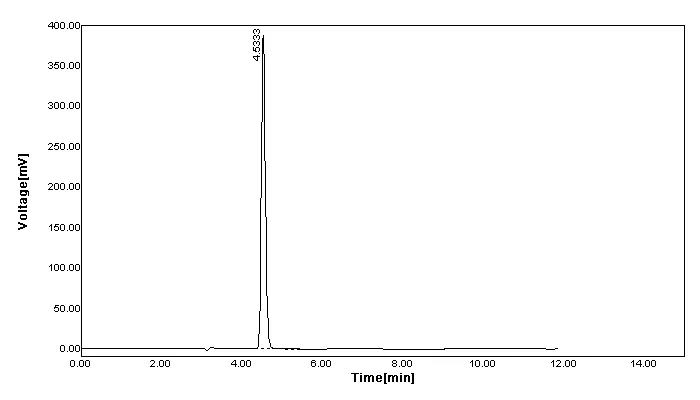
Figure 1.10: Chromatogram of Interday Precision for Griseofulvin (60 MCG)

Figure 1.11: Chromatogram of Interday Precision for Griseofulvin (80 MCG)
Table 1.6: Interday Precision Study of Griseofulvin.
|
Conc. (µg/ml) |
Peak area |
Mean area |
S. D |
%RSD |
||
|
Trial 1 |
Trial 2 |
|||||
|
40 |
1050.04 |
1070.65 |
1060.35 |
14.57 |
1.37 |
|
|
60 |
1624.72 |
1652.5 |
1638.61 |
19.64 |
1.20 |
|
|
80 |
2156.3 |
2126.29 |
2141.30 |
21.22 |
0.99 |
|
N=2

Figure 1.12: Chromatogram of Intraday Precision for Griseofulvin (40 MCG)

Figure 1.13: Chromatogram of Intraday Precision for Griseofulvin (60 MCG)

Figure 1.14: Chromatogram of Interday Precision for Griseofulvin (80 MCG)
Table 1.7: Intraday Precision Studies of Griseofulvin.
|
Conc. (µg/ml) |
Peak area |
Mean area |
S.D |
%RSD |
||
|
Trial 1 |
Trial 2 |
|||||
|
40 |
539.37 |
548.69 |
544.03 |
6.59 |
1.21 |
|
|
60 |
1535.21 |
1555.39 |
1545.36 |
14.27 |
0.92 |
|
|
80 |
2553.11 |
2560.32 |
2556.72 |
5.10 |
0.20 |
|
N=2
|
Acceptance Criteria: The %RSD of the peak area of Griseofulvin obtain from Three replicate injection should NMT 2% |
1.Repeatability:
Table 1.8: Repeatability study of Griseofulvin
|
Sr. no. |
Conc. |
Peak area |
Amt found |
% amt found |
|
1 |
40 |
1010.35 |
9.45 |
97.68 |
|
2 |
40 |
1032.13 |
6.65 |
24.13 |
|
3 |
40 |
1033.12 |
9.66 |
99.32 |
|
|
|
|
|
|
|
|
|
Mean |
9.59 |
73.71 |
|
|
|
S.D. |
0.12 |
42.95 |
|
|
|
%RSD |
1.24 |
58.27 |
N=3
II: Range/Linearity
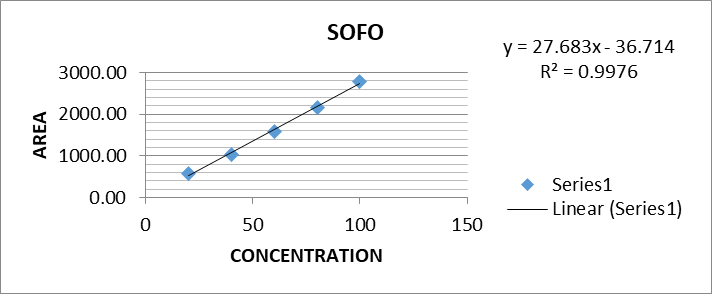
Figure 1.15: Calibration Curve of Griseofulvin
Table 1.9: Linearity Studies of Griseofulvin
|
Sr.No. |
Concentration µg/ml |
Area |
%RSD |
|
1 |
20 |
567.98 |
0.22 |
|
2 |
40 |
1034.08 |
0.56 |
|
3 |
60 |
1534.08 |
1.17 |
|
4 |
80 |
2164.20 |
0.32 |
|
5 |
100 |
2771.20 |
0.12 |
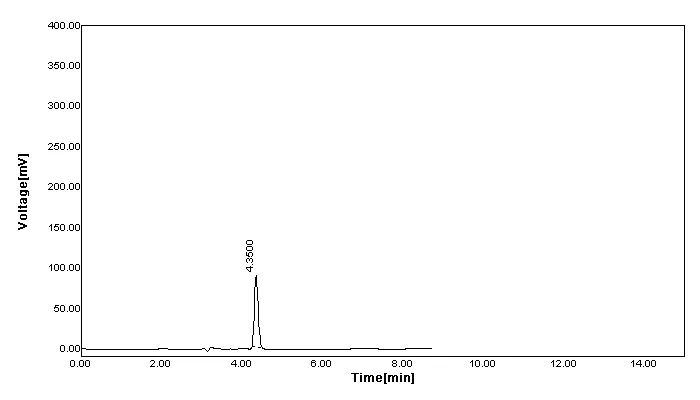
Figure 1.16: Chromatogram of Linearity of Griseofulvin (20µg/ml)
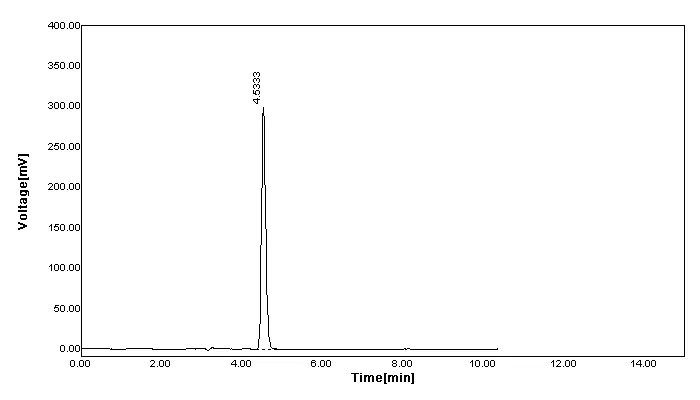
Figure 1.17: Chromatogram of Linearity for Griseofulvin (40µg/ml)
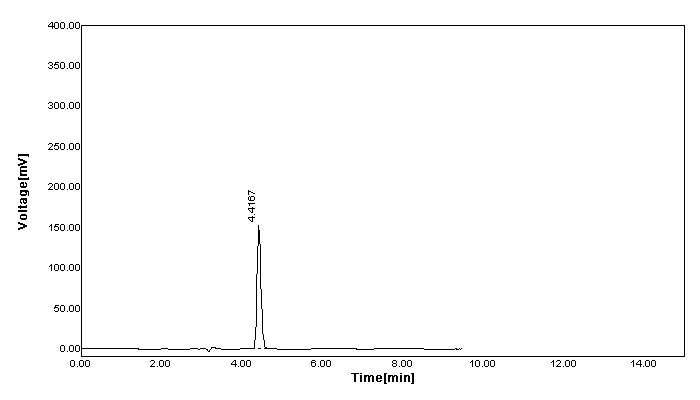
Figure 1.18: Chromatogram of Linearity for Griseofulvin (60µg/ml)
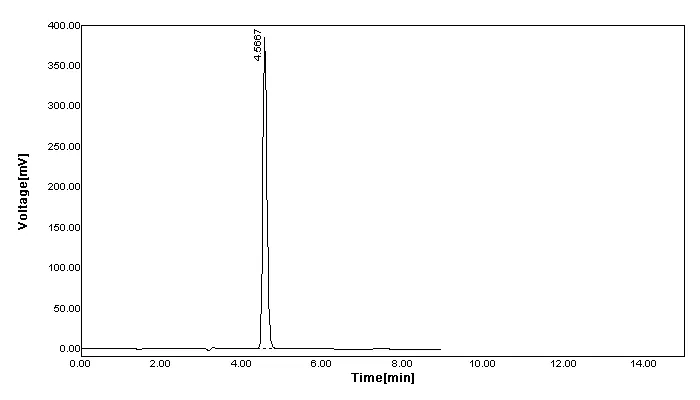
Figure 1.19: Chromatogram of Linearity for Griseofulvin (80µg/ml)
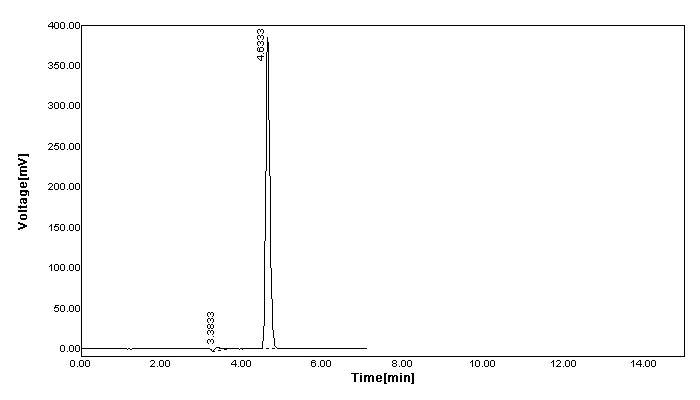
Figure 1.20: Chromatogram of Linearity for Griseofulvin (100µg/ml)
Table 1.10: Linearity Results of Griseofulvin
|
Conc. µg/ml |
20 |
40 |
60 |
80 |
100 |
|
Peak Area |
567.08 |
1038.14 |
1570.72 |
2159.37 |
2769.52 |
|
Correlation |
0.99 |
||||
Table 1.11: Calibration Parameter of Griseofulvin
|
Parameter |
Result |
|
Slop |
27.68 |
|
Intercept |
36.71 |
|
Correlation co-efficient |
0.997 |
|
Acceptance Criteria: The Correlation coefficient (R2) shall be NLT 0.999 and % curve fitting NLT 99% for Griseofulvin. |
III.Robustness
Table 1.12: Robustness Study of Griseofulvin
|
A: flow rate=0.6 |
|
B: flow rate=0.8 |
|||||||||||||
|
Sr. no. |
Conc (µg/ml) |
Peak area |
|
Sr. no. |
Conc (µg/ml) |
Peak area |
|||||||||
|
1 |
40 |
1038.71 |
1 |
40 |
1011.11 |
||||||||||
|
2 |
40 |
1040.1 |
2 |
40 |
1027.01 |
||||||||||
|
|
Mean |
1039.41 |
|
Mean |
1019.06 |
||||||||||
|
|
S.D. |
0.98 |
|
S.D. |
11.24 |
||||||||||
|
|
%RSD |
0.09 |
|
%RSD |
1.10 |
||||||||||
|
Mobile phase Volume 79+21 |
|
Mobile phase Volume81+19 |
|||||||||||||
|
Sr. no. |
Conc.(µg/ml) |
Peak area |
|
Sr. no. |
Conc (µg/ml) |
Peak area |
|||||||||
|
1 |
40 |
1006.7 |
|
1 |
40 |
1014.39 |
|||||||||
|
2 |
40 |
1011.22 |
|
2 |
40 |
1024.35 |
|||||||||
|
|
Mean |
1008.96 |
|
|
Mean |
1019.37 |
|||||||||
|
|
S.D. |
3.20 |
|
|
SD |
7.04 |
|||||||||
|
|
%RSD |
0.32 |
|
|
%RSD |
0.69 |
|||||||||
|
Wavelength Change=259 |
|
Wavelength change =261 |
|||||||||||||
|
Sr No. |
Conce µg/ml |
Peak Area |
|
Sr. No. |
Conc(µg/ml) |
Peak Area |
|||||||||
|
1 |
40 |
1030.75 |
|
1 |
40 |
1069.4 |
|||||||||
|
2 |
40 |
1023.65 |
|
2 |
40 |
1089.34 |
|||||||||
|
|
Mean |
1027.20 |
|
|
Mean |
1079.37 |
|||||||||
|
|
SD |
5.02 |
|
|
SD |
14.10 |
|||||||||
|
|
%RSD |
0.49 |
|
|
%RSD |
1.31 |
|||||||||
N=2
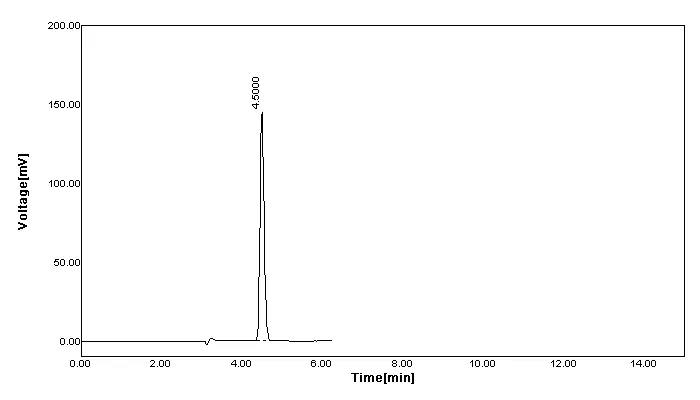
Figure 1.21: Chromatogram of Robustness (Flow Rate: 0.6 ml/min)
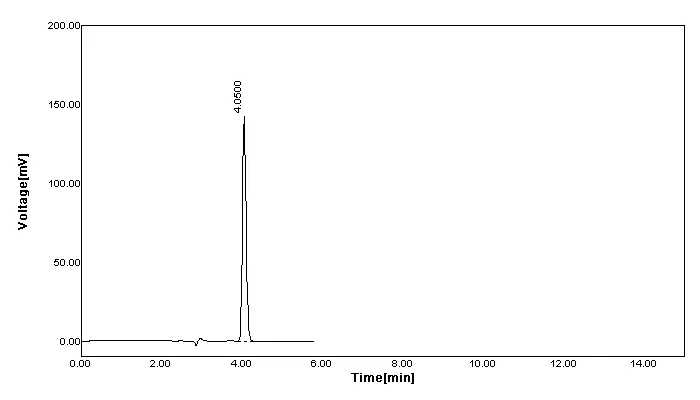

Figure 1.23: Chromatogram of Robustness (Mobile Phase Composition-79:21)
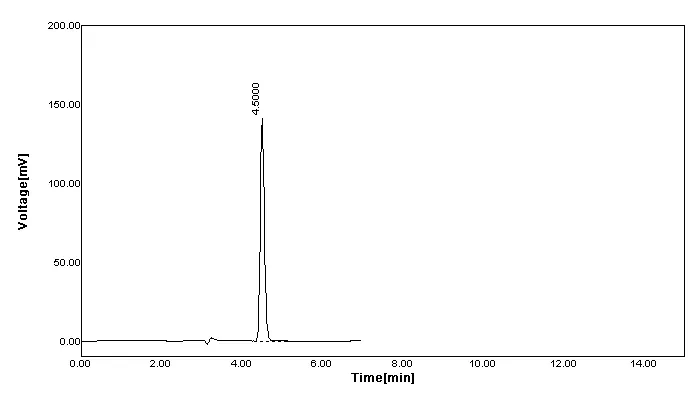
Figure 1.24: Chromatogram of Robustness (Mobile Phase Composition-81:19)

Figure 1.25: Chromatogram of Robustness (Wavelength 259)
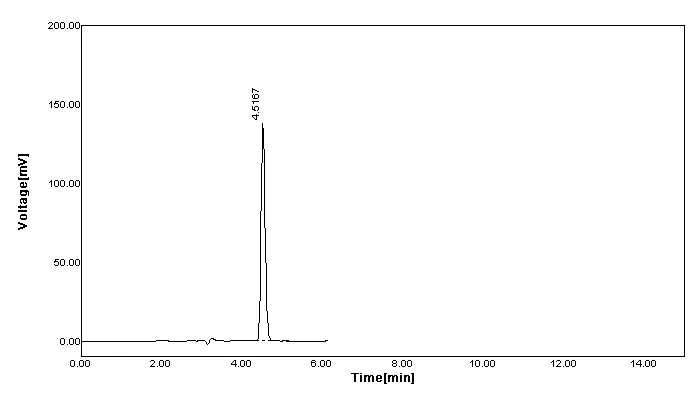
Figure 1.26: Chromatogram of Robustness (Wavelength 261)
Table 1.13: Summary of Validation Parameter
|
Parameter |
Results |
|||||||||
|
Linearity range (μg/ml) |
20-100μg/ml |
|||||||||
|
Linearity equation (Y = mX +C) |
y = 27.68x - 36.71 |
|||||||||
|
Limit of detection (μg) |
0.53μg/ml |
|||||||||
|
Limit of quantitation (μg) |
1.62μg/ml |
|||||||||
|
% Recovery (n = 3) |
99.58% |
|||||||||
|
Precision (%R.S.D.) |
Less than 2 |
|||||||||
|
0.20-1.21 0.99-1.37 73.71 |
|||||||||
|
|
|||||||||
IV. LOD/LQ:
LOD is the lowest detectable analyte concentration.
To calculate LOD, use the formula: 3.3 σ/S, where σ is the response standard deviation, S is the calibration curve slope, and Griseofulvin is 0.53 µg/ml
Limit of Quantity Lowest accurately measured analyte concentration.
LOQ formula: 10 σ/S, where σ = response standard deviation, S = calibration curve slope, and Griseofulvin = 1.62 µg/ml.
Validating Parameters
RP-HPLC Tablet Griseofulvin Determination Method Development and Validation.
CONCLUSION
RP-HPLC evaluation of pure and tablet Griseofulvin. RP-HPLC works faster, cheaper, and simpler than HPLC. Precision, durability, and accuracy improved by RP-HPLC. Griseofulvin can be tested in pharmaceutical formulations using these procedures.
Griseofulvin RP-HPLC development. Precision, robustness, and resistance were better with RP-HPLC. Griseofulvin Tablet analysis works using these methods.
REFERENCES


Krishana Alanse, Vinita Mathankar, Govind Soni, Rakesh Jatav, Development and Validation of RP-HPLC Method for the Determination of Griseofulvin in Tablet Dosage Form, Int. J. of Pharm. Sci., 2026, Vol 4, Issue 6, 517-533. https://doi.org/10.5281/zenodo.20268986
 10.5281/zenodo.20268986