

We use cookies to ensure our website works properly and to personalise your experience. Cookies policy
Appasaheb Birnale College of Pharmacy, Sangli – 416416.
A simple, accurate, and validated UV spectrophotometric and RP-HPLC method was developed for the estimation of diflunisal in bulk and laboratory-prepared mixtures. The UV method, optimized at 315 nm, showed excellent linearity over the concentration range of 10–50 µg/mL (R² = 0.998), with LOD and LOQ values of 3.52 µg/mL and 10.67 µg/mL, respectively. The RP-HPLC method utilized a Waters X Terra RP18 column with an acetonitrile: sodium dihydrogen phosphate buffer (90:10, pH 3.5) mobile phase at a flow rate of 1.0 mL/min, producing a retention time of 2.8 min and good linearity (R² = 0.9915). Accuracy studies yielded recoveries between 97.90% and 99.75%, while precision studies showed %RSD values below 2%. Assay results demonstrated recoveries of 100.80% and 99.89% by UV spectrophotometry and RP-HPLC, respectively. The developed methods were found to be reliable, economical, and suitable for routine quality control analysis of diflunisal.
Diflunisal (2′,4′-difluoro-4-hydroxybiphenyl-3-carboxylic acid; C₁₃H₈F₂O₃; MW 250.19 g/mol) is a fluorinated derivative of salicylate belonging to the non-steroidal anti-inflammatory drug (NSAID) class.(1,2) As a primary inhibitor of cyclooxygenase enzymes COX-1 and COX-2, diflunisal prevents the biosynthesis of prostaglandins from arachidonic acid, thereby exerting analgesic, anti-inflammatory, and antipyretic effects.(3–5) Its difluoro phenyl substituent confers enhanced potency and a prolonged duration of action compared to conventional salicylates.
Beyond its established role in the management of rheumatoid arthritis, osteoarthritis, and mild-to-moderate pain, diflunisal has gained renewed clinical significance as a transthyretin (TTR) kinetic stabilizer for the treatment of transthyretin amyloid polyneuropathy (ATTR). By binding to the T4-binding sites of the TTR tetramer, it retards amyloidogenic dissociation and delays disease progression, significantly expanding its therapeutic reach beyond traditional anti-inflammatory activity.(6–9)
A review of the literature revealed that various analytical methods have been reported for the estimation of diflunisal in bulk drugs, pharmaceutical formulations, and biological samples(10–12)Among these, UV spectrophotometry is a simple and cost-effective technique widely used for quantitative analysis and stability studies.(13–15) On the other hand, High-Performance Liquid Chromatography (HPLC) is another method that can be utilized to carry out stability-indicating analysis using a simple and stable approach called isocratic elution compared to gradient elution(16–20)Bioanalytical methods using plasma are employed to study the pharmacokinetics and pharmacodynamics of a drug; however, their applicability in stability studies is limited. (21,22)Each of these methods varies in complexity, sensitivity, and cost, providing scientists with diverse options for drug analysis. Research indicates that alternative testing methods can be costly due to the need for specialized equipment, expensive solvents, specific reagents, and extensive maintenance. In contrast, the developed RP-HPLC method was simple, rapid, accurate, and reproducible, making it effective for determining diflunisal in bulk and laboratory mixture.
IUPAC Name– 2′,4′-Difluoro-4-hydroxybiphenyl-3-carboxylic acid
Molecular Formula– C₁₃H₈F₂O₃
Molecular Weight– 250.19 g/mol
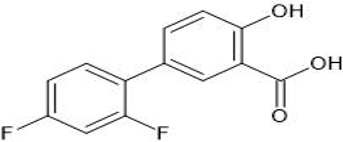
Figure 1: Structure of Diflunisal
MATERIAL AND METHODS:
Diflunisal (API) standard (100% purity) was obtained from Arti Labs, Mumbai, India, as a gift sample. HPLC-grade acetonitrile (Gemini Associates), methanol (Loba Chemie), sodium dihydrogen phosphate (Loba Chemie), and double-distilled water (in-house) were used throughout. All chemicals were of analytical or HPLC grade unless otherwise stated.
Instrument:
Shimadzu UV-1900, a double-beam spectrophotometer with a fixed bandwidth and a 1 cm quartz cell, was used to record spectral and absorbance measurements. A Jasco PU-2080 Plus HPLC system equipped with a Jasco UV-2070 Plus detector was used for RP-HPLC method development.
ANALYTICAL METHOD DEVELOPMENT:
Solubility Study and Solvent Selection
Diflunisal solubility was assessed in various solvents at 25 ± 2°C. The drug was found to be highly soluble in methanol and ethanol, while showing limited solubility in distilled water; therefore, methanol was selected for UV analysis.
Preparation of Standard Solution
A standard stock solution was prepared by dissolving 10 mg of diflunisal in 100 mL of diluent (methanol for UV analysis and acetonitrile: water, 50:50, for HPLC). An aliquot of 1 mL was further diluted to 10 mL to obtain a final concentration of 100 µg/mL.
Preparation of Sample Solution
A laboratory mixture containing diflunisal and pharmaceutical excipients was prepared and finely powdered. An accurately weighed quantity equivalent to 10 mg of diflunisal was transferred to a 100 mL volumetric flask, dissolved in diluent with sonication, and diluted to volume. A suitable aliquot was further diluted to obtain the required concentration for analysis.
Selection of Detection Wavelength
A 100 µg/mL diflunisal solution was scanned in the range of 200–400 nm using a UV spectrophotometer. The maximum absorbance was observed at 315 nm, which was selected as the analytical wavelength for subsequent studies.
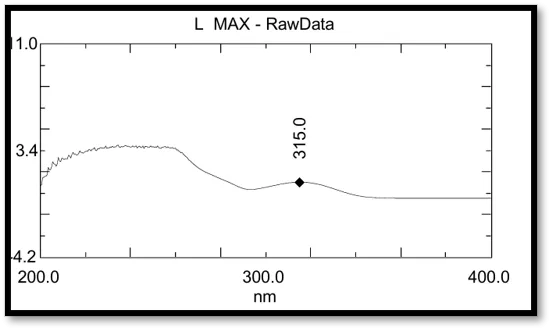
Figure 2: UV-Visible Spectra of Diflunisal (λ max = 315 nm)
Validation Parameters of UV Spectrometer:
The linearity, accuracy, precision, LOD, LOQ, and robustness of this method were all validated.(23,24)
Linearity:
The linearity was ascertained by examining five distinct levels of the calibration curve within the range of 10–50 µg/mL. Each solution's absorbance was measured at 315 nm. Plotting the absorbance vs. concentration calibration curve allowed for determining the regression line equation and correlation coefficient for diflunisal.
LOD & LOQ:
The limit of detection and limit of quantification were applied to assess the sensitivity of the diflunisal reading acquired using the proposed method. The formula LOD = 3.3 × σ/S and LOQ = 10 × σ/S, where "σ" indicates standard deviation and "S" stands for slope, was used to obtain the LOD and LOQ.
Precision:
Diflunisal was analyzed on the same day to determine intra-day precision, and on various days to assess inter-day precision. The percentage RSD was then calculated.
Accuracy:
To assess accuracy, recovery studies were conducted at three distinct levels: 80%, 100%, and 120%. Each level's solution was prepared in triplicate, and the percentage RSD was determined for each level.
Robustness:
The proposed method's robustness was tested by altering the wavelength (±2 nm) while keeping the other parameters constant.
Optimized RP-HPLC Chromatographic Conditions
RP-HPLC analysis was performed using a Jasco PU-2080 Plus system equipped with Chroma stage software. Chromatographic separation was achieved on a Waters X Terra RP18 column (250 × 4.6 mm, 5 µm). The mobile phase consisted of acetonitrile and sodium dihydrogen phosphate buffer (pH 3.5) in a ratio of 90:10 (v/v), delivered in isocratic mode at a flow rate of 1.0 mL/min. Detection was carried out at 315 nm, with the column maintained at 40°C. A 20 µL injection volume was used for each analysis, and the total run time was 10 minutes. Acetonitrile and double-distilled water (50:50, v/v) were used as the diluent throughout the study.
Selection of Mobile Phase:
A variety of solvents were assessed to optimize the drug's chromatographic peak for clarity and uniformity. After systematic evaluation of three mobile phase compositions, acetonitrile: sodium dihydrogen phosphate buffer (90:10 v/v) at pH 3.5 was found to produce the sharpest, most symmetrical diflunisal peak with optimal retention time and baseline stability
Preparation of Buffer:
Weighed and transferred 3.90 grams of sodium dihydrogen phosphate into a 1000 mL beaker, dissolved and diluted to 1000 mL with vacuum-filtered double-distilled water. Adjusted the pH to 3.5 with orthophosphoric acid.
Method Validation by RP-HPLC(25,26)
System Suitability:
Diflunisal was analyzed in six different injections to assess the technique's suitability. For standard solutions, the retention time, area, peak symmetry, column efficiency, and theoretical plates were calculated.
Specificity:
To confirm that diluents or excipients do not interfere with the drug peak, both the standard solution and the sample solution were prepared following the established method and subsequently analysed.
Linearity:
Linearity Study
A stock solution of diflunisal (1000 µg/mL) was prepared by dissolving 10 mg of the drug in a suitable solvent and making up the volume to 10 mL. An aliquot of this solution was further diluted to obtain a working standard solution of 100 µg/mL. Calibration standards in the concentration range of 10–50 µg/mL were prepared and analyzed. Linearity was evaluated by plotting concentration versus peak area, and the regression equation along with the correlation coefficient (R²) was determined.
Precision:
A 30 µg/mL standard solution was made and injected into the system six times. After recording a chromatogram, the Peak Area's %RSD was calculated.
Intermediate Precision:
To calculate the intermediate precision, the responses of a standard peak on the same day and another day with the same solution concentration were analyzed.
Accuracy:
Using a known amount of drug, sample solutions were created with drug concentrations of 80%, 100%, and 120% relative to the working concentration in triplicate using the analysis method. The sample solutions were then examined using the method to ascertain the method's accuracy. The recovery percentage was estimated.
LOD & LOQ:
Five sets of linearity concentrations were analyzed, and LOD & LOQ were calculated using the following equations as per ICH Q2(R1) guidelines, based on the response and slope of a regression equation.
Robustness:
The stability of the method was evaluated by systematically varying critical parameters, including flow rate (±0.1 mL/min) and wavelength (±2 nm). These controlled adjustments allowed for the assessment of the method's robustness, ensuring reliability and reproducibility across different experimental conditions. The consistency of the results obtained under these variations confirmed the method's accuracy and suitability for analytical applications.
Assay:
ICH guidelines state that the assay method must be able to measure the active pharmaceutical component without interference when excipients, contaminants, and degradation products are present.
RESULT AND DISCUSSION:
UV Spectrophotometer
Linearity:
The linearity of standard preparations of diflunisal was established, yielding a correlation coefficient of 0.998. The linear regression equation was determined to be y = 0.0104x + 0.0901. Within the specified concentration range, the correlation coefficient was required to be no less than 0.997, confirming a strong linear relationship between the drug concentration and the corresponding absorbance.
TABLE 2: LINEARITY OF DIFLUNISAL BY UV
|
Sr. No |
Con (µg/mL) |
Absorbance |
Mean |
SD |
%RSD |
||
|
R1 |
R2 |
R3 |
|||||
|
|
10 |
0.188 |
0.191 |
0.191 |
0.19 |
0.0017 |
0.91 |
|
|
20 |
0.302 |
0.306 |
0.307 |
0.305 |
0.0026 |
0.87 |
|
|
30 |
0.414 |
0.419 |
0.421 |
0.418 |
0.0036 |
0.86 |
|
|
40 |
0.501 |
0.508 |
0.512 |
0.507 |
0.01 |
1.10 |
|
|
50 |
0.61 |
0.619 |
0.625 |
0.618 |
0.01 |
1.22 |
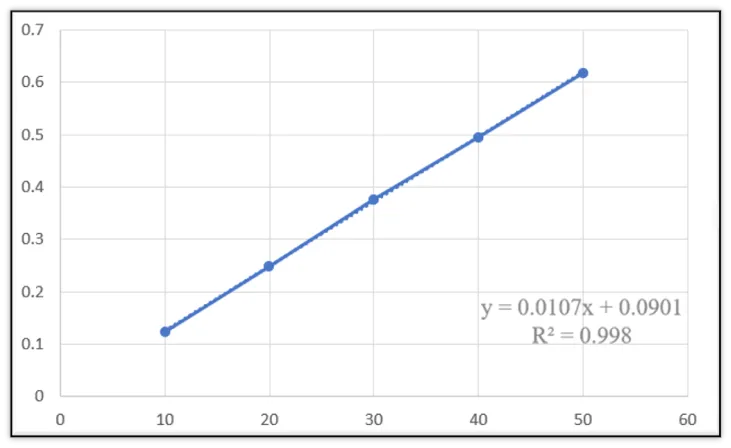
Figure 3: Calibration Curve of Diflunisal by UV Spectrophotometry
LOD & LOQ:
The results indicated that the limit of detection (LOD) and limit of quantification (LOQ) for diflunisal were determined to be 3.52 µg/mL and 10.67 µg/mL, respectively, demonstrating the method's sensitivity for drug analysis.
Precision:
The precision of the analytical method for diflunisal was evaluated through intra-day and inter-day studies. Precision was expressed in terms of relative standard deviation (RSD). For intra-day precision, the sample was analyzed six times within the same day, while inter-day precision was assessed by repeating the analysis on the following days. The results demonstrated the method's reproducibility and reliability.
TABLE 3: RESULTS OF INTRADAY AND INTERDAY PRECISION (UV)
|
Conc. (µg/mL) |
Intraday Abs. |
Interday Abs. |
|
30 |
0.365 |
0.329 |
|
30 |
0.368 |
0.330 |
|
30 |
0.362 |
0.325 |
|
30 |
0.365 |
0.328 |
|
30 |
0.368 |
0.327 |
|
30 |
0.362 |
0.325 |
|
Mean |
0.365 |
0.327 |
|
SD |
0.003 |
0.002 |
|
%RSD |
0.82 |
0.81 |
Accuracy:
The percentage recovery at 80%, 100%, and 120% concentration levels was found to be 98.59%, 98.78%, and 98.83%, respectively. These values fall within the acceptable recovery range of 98%–102%, indicating the accuracy and reliability of the method. The detailed results are presented in Table 4.
TABLE 4: RESULTS OF THE ACCURACY STUDY (UV)
|
Level |
Absorbance |
Calculated Conc. (µg/mL) |
Mean Conc. |
% Recovery |
SD |
%RSD |
|
80% |
0.429 |
39.18 |
|
97.95 |
|
|
|
0.430 |
39.42 |
35.44 |
98.55 |
0.001 |
0.23 |
|
|
0.431 |
39.71 |
|
99.28 |
|
|
|
|
100% |
0.553 |
48.97 |
|
97.94 |
|
|
|
0.556 |
49.52 |
49.39 |
99.04 |
0.0015 |
0.27 |
|
|
0.554 |
49.68 |
|
99.36 |
|
|
|
|
120% |
0.662 |
58.74 |
|
97.90 |
|
|
|
0.668 |
59.31 |
59.30 |
97.77 |
0.003 |
0.45 |
|
|
0.665 |
59.85 |
|
99.75 |
|
|
Robustness:
To assess system suitability, a standard solution of 30 µg/mL was prepared, and the effect of wavelength variation was studied. The data obtained from these studies are presented in Table 5, demonstrating the method's reliability under varying conditions.
TABLE 5: RESULTS OF ROBUSTNESS STUDY (UV)
|
Conc. (µg/mL) |
Wavelength (nm) / Absorbance |
313 nm |
315 nm |
317 nm |
|
30 |
Rep 1 |
0.362 |
0.365 |
0.358 |
|
30 |
Rep 2 |
0.363 |
0.368 |
0.360 |
|
30 |
Rep 3 |
0.361 |
0.362 |
0.357 |
|
|
Mean |
0.362 |
0.365 |
0.358 |
|
|
%RSD |
0.28 |
0.82 |
0.43 |
RP-HPLC System Suitability Parameters:
System Suitability
System suitability testing was performed to verify the performance and reliability of the chromatographic system. Six replicate injections of a standard diflunisal solution (50 µg/mL) were analyzed, and parameters such as repeatability, sensitivity, and resolution were evaluated. The results met the acceptance criteria, confirming the suitability of the RP-HPLC system for routine analysis.
TABLE 6: RESULTS OF SYSTEM SUITABILITY (RP-HPLC)
|
Sr. No |
Conc. (µg/ml) |
R1 |
R2 |
R3 |
Mean |
±SD |
%RSD |
|
1 |
50 |
531200 |
530500 |
530556 |
530752 |
388.9884 |
0.0598410 |
|
2 |
50 |
535200 |
535850 |
536500 |
535850 |
530.722 |
0.0990431 |
|
3 |
50 |
529500 |
530100 |
530128 |
529909.33 |
354.7694 |
0.0546636 |
|
4 |
50 |
507000 |
507500 |
507578 |
507359.33 |
313.6261 |
0.0504720 |
|
5 |
50 |
529900 |
530200 |
530422 |
530174 |
261.9694 |
0.0403447 |
|
6 |
50 |
530700 |
530750 |
530820 |
530750 |
49.2160 |
0.0076919 |
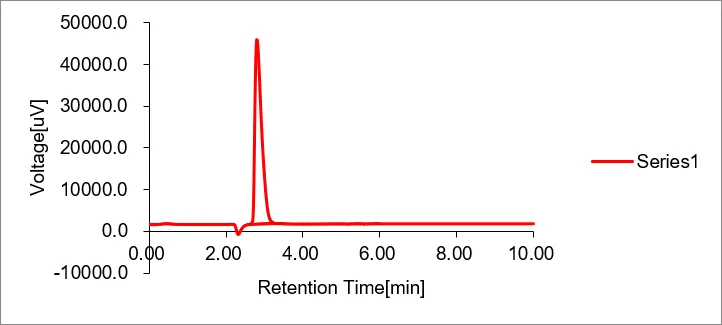
Figure 4: Standard Chromatogram of Diflunisal Peak (RP-HPLC)
Method Validation by RP-HPLC
Linearity:
To assess the linearity of diflunisal, a series of diluted solutions were prepared from a standard stock, covering concentrations from 10 to 50 µg/mL. The calibration data generated the equation y = 12575x − 115107, with an R² value of 0.9915, demonstrating a strong linear correlation. The calibration curve for diflunisal, obtained via HPLC, is illustrated in Figure 7.
TABLE 7: LINEARITY OF DIFLUNISAL BY RP-HPLC
|
Sr. No |
Conc. (µg/ml) |
Absorbsnce |
Mean |
±SD |
%RSD |
||
|
R1 |
R2 |
R3 |
|||||
|
1 |
10 |
22940.6 |
23094.3 |
23090.8 |
23041.900 |
87.75 |
0.38 |
|
2 |
20 |
139171.3 |
140472.1 |
141845.7 |
140496.367 |
1337.37 |
0.95 |
|
2 |
20 |
139171.3 |
140472.1 |
141845.7 |
140496.367 |
1337.37 |
0.95 |
|
3 |
30 |
241754.7 |
241930.1 |
243426.3 |
242370.367 |
918.66 |
0.38 |
|
4 |
40 |
371218.3 |
369188.3 |
372279.7 |
370895.433 |
1570.79 |
0.42 |
|
5 |
50 |
535686.5 |
539751.8 |
532934.1 |
536124.133 |
3429.85 |
0.64 |
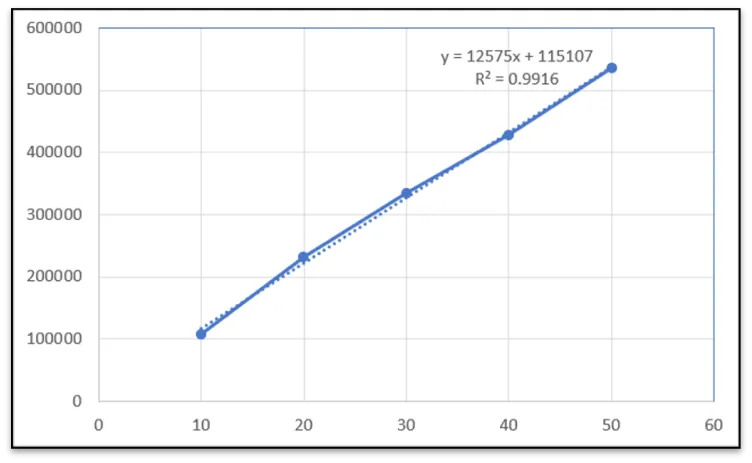
Figure 7: Calibration Curve of Diflunisal by RP-HPLC
LOD & LOQ:
The results demonstrated that the limit of detection (LOD) and limit of quantification (LOQ) for diflunisal were 5.58 µg/mL and 16.90 µg/mL, respectively. These values confirm the method's high sensitivity and suitability for precise drug analysis.
Precision:
The precision of the developed method was assessed based on the relative standard deviation (%RSD), which serves as a measure of repeatability. The %RSD values obtained were within the acceptable limit, not exceeding 2%, indicating the method's reliability. The detailed precision results are presented in Tables 8 & 9.
TABLE 8: RESULTS OF PRECISION (INTRADAY) – RP-HPLC
|
Sr. No |
Conc. (µg/ml) |
R1 |
R2 |
R3 |
Mean |
±SD |
%RSD |
|
1 |
10 |
23050.2 |
22980.5 |
23090.8 |
23040.50 |
55.36 |
0.24 |
|
2 |
20 |
140200.5 |
139850.3 |
140500.6 |
140183.80 |
325.45 |
0.23 |
|
3 |
30 |
242500.2 |
241950.7 |
242800.3 |
242417.07 |
429.18 |
0.18 |
|
4 |
40 |
371500.4 |
370800.6 |
371900.2 |
371400.40 |
552.31 |
0.15 |
|
5 |
50 |
536200.5 |
535600.2 |
536800.3 |
536200.33 |
600.05 |
0.11 |
TABLE 9: RESULTS OF PRECISION (INTERDAY) – RP-HPLC
|
Sr. No |
Conc. (µg/ml) |
D1 |
D2 |
D3 |
Mean |
±SD |
%RSD |
|
1 |
10 |
22840.2 |
23150.5 |
22980.8 |
22990.50 |
155.40 |
0.68 |
|
2 |
20 |
138900.5 |
141200.3 |
140400.6 |
140167.13 |
1167.62 |
0.83 |
|
3 |
30 |
240800.2 |
243600.7 |
242500.3 |
242300.40 |
1410.96 |
0.58 |
|
4 |
40 |
368500.4 |
372800.6 |
371200.2 |
370833.73 |
2174.00 |
0.59 |
|
5 |
50 |
532200.5 |
538600.2 |
535800.3 |
535533.67 |
3208.28 |
0.60 |
Accuracy:
A known quantity of standard was spiked into pre-analyzed samples and subjected to the recommended HPLC procedure to conduct recovery studies at three levels: 80%, 100%, and 120%. The mean percentage recovery was calculated based on the obtained data, and the results are presented in Table 10.
TABLE 10: RESULTS OF THE ACCURACY STUDY (RP-HPLC)
|
Level |
Peak Area |
Calculated Conc. (µg/mL) |
Mean Conc. |
% Recovery |
SD |
%RSD |
|
80% |
377,682.5 |
39.18 |
39.44 |
97.95 |
0.26 |
0.87 |
|
380,694.5 |
39.42 |
98.56 |
||||
|
384,348.3 |
39.71 |
99.29 |
||||
|
100% |
507,616.0 |
49.52 |
49.39 |
99.04 |
0.37 |
0.92 |
|
500,700.8 |
48.97 |
97.94 |
||||
|
509,628.0 |
49.68 |
99.36 |
||||
|
120% |
623,593.5 |
58.74 |
59.63 |
97.90 |
0.55 |
1.10 |
|
630,761.3 |
59.31 |
98.85 |
||||
|
637,548.8 |
59.85 |
99.75 |
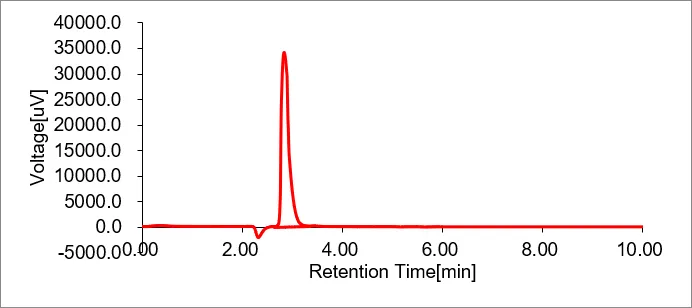
Figure 10: Chromatogram of Diflunisal for Accuracy (80%)
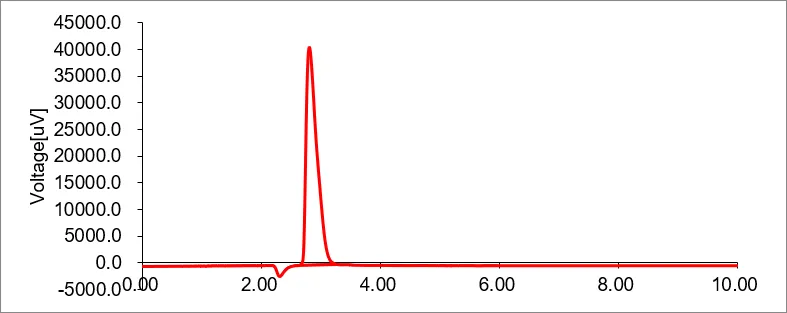
Figure 11: Chromatogram of Diflunisal for Accuracy (100%)
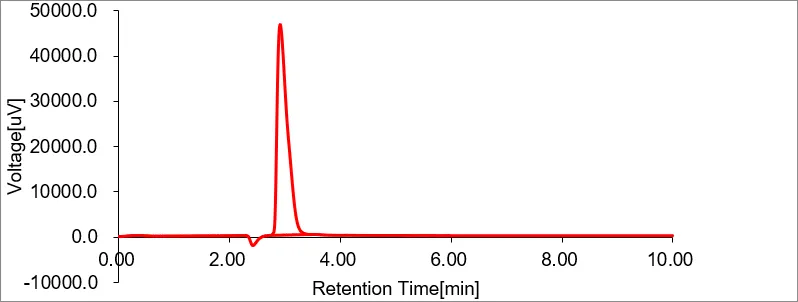
Figure 12: Chromatogram of Diflunisal for Accuracy (120%)
Robustness:
Robustness was evaluated by assessing the impact of minor but significant variations in specific analytical parameters that could affect selectivity or quantitative results. The following parameters were varied individually, and their effects on the system suitability test were analyzed:
• Flow rate: ±0.1 mL/min
• Wavelength: ±2 nm
The results of these assessments are presented in Table 11.
Table 11: RESULTS OF THE ROBUSTNESS STUDY (RP-HPLC)
|
Sr. No. |
Parameter |
AREA (µ. v. sec) |
Mean |
SD |
%RSD |
||
|
1 |
Wavelength (313 nm) |
551,398 |
566,318 |
558,112 |
558,609 |
7472.5 |
1.33 |
|
2 |
Wavelength 317nm |
491,243 |
483,520 |
487,767 |
487,510 |
3867.9 |
0.79 |
|
3 |
Flow rate 0.9ml/min |
578,228 |
586,969 |
581,451 |
582,216 |
4420.4 |
0.76 |
|
4 |
Flow rate 1.1ml/min |
471,134 |
482,897 |
476,550 |
476,860 |
5887.5 |
1.23 |
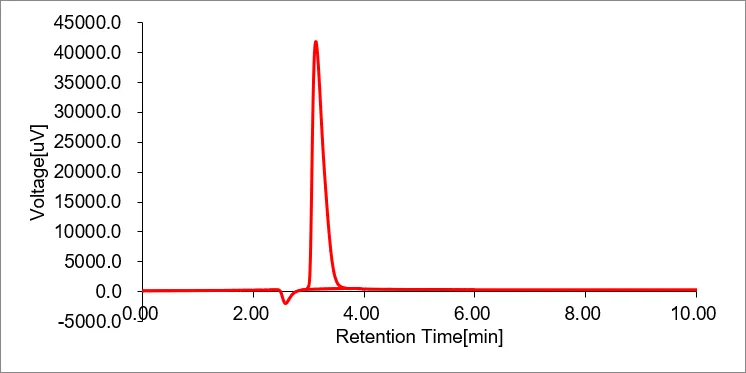
Figure 13: Chromatogram of Diflunisal for Robustness (F 0.9 mL/min)
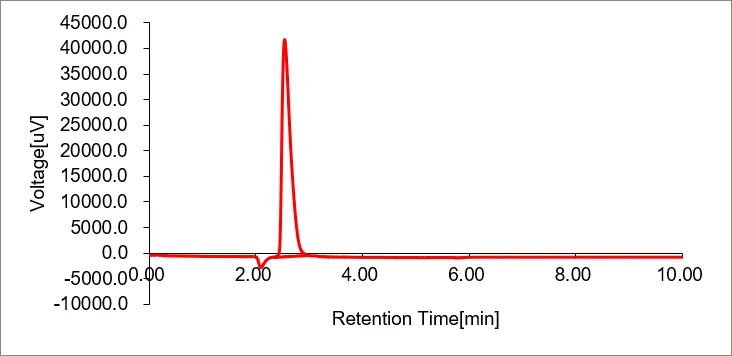
Figure 14: Chromatogram of Diflunisal for Robustness (F 1.1 mL/min)
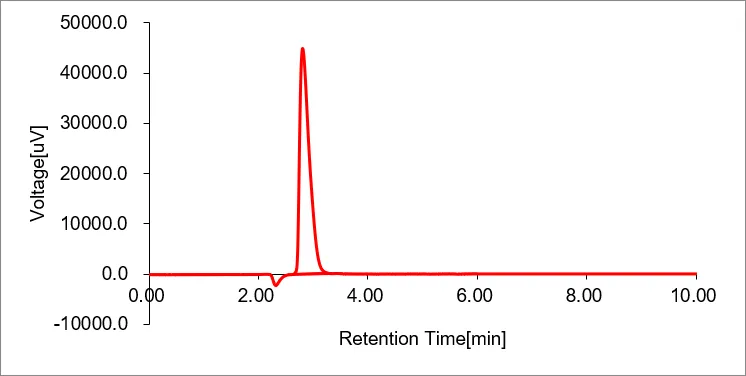
Figure 15: Chromatogram of Diflunisal for Robustness (W 313 nm)
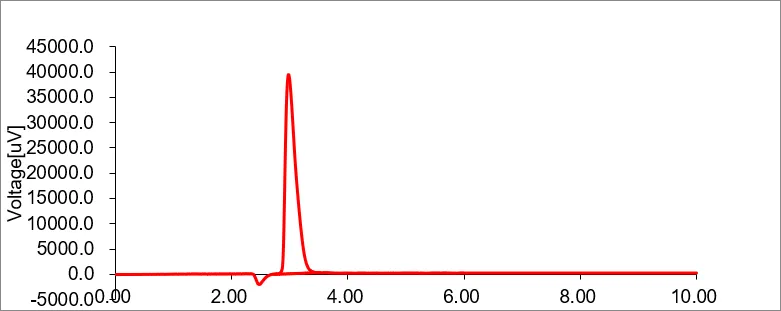
Figure 16: Chromatogram of Diflunisal for Robustness (W 317 nm)
Assay:
Assay procedures are developed to quantify the concentration of a specific substance in a sample. In this study, the assay was conducted to determine the active ingredient's concentration in the laboratory mixture. The recovery percentage was calculated by comparing the measured concentration in the sample with the known spiked amount, providing an assessment of the assay's accuracy. The recovery percentage by UV spectrophotometry was determined to be 100.80% and by RP-HPLC was determined to be 99.89%.
CONCLUSION
The present study successfully developed and validated a robust, accurate, and precise RP-HPLC and UV spectrophotometric method for the quantitative determination of diflunisal in bulk and laboratory mixture. The UV spectrophotometric analysis established a linear calibration curve with a correlation coefficient of 0.998 at 315 nm, confirming excellent linearity. The method demonstrated high sensitivity with LOD and LOQ values of 3.52 µg/mL and 10.67 µg/mL, respectively.
The RP-HPLC method was optimized using a mobile phase of acetonitrile and sodium dihydrogen phosphate buffer (90:10) under isocratic elution, achieving a retention time of 2.8 minutes. The linearity range was 10–50 µg/mL with a correlation coefficient of 0.9915. The precision study indicated low %RSD values (<2%), confirming reproducibility. Accuracy assessment through recovery studies showed values between 97.90% and 99.75%, ensuring method reliability. Robustness evaluation revealed minimal variations under deliberate changes in analytical parameters.
The validated methods conform to ICH Q2(R1) guidelines and provide a cost-effective, reproducible, and reliable approach for routine quality control analysis of diflunisal in pharmaceutical formulations.
ACKNOWLEDGMENT:
I would like to express my gratitude to the management of Appasaheb Birnale College of Pharmacy, Sangli, for providing the necessary facilities and resources to conduct this research. I also thank Mr. Sushant P. Kokane for his guidance and Mr. Nitin. V. Kokare for his valuable support throughout the study.
REFERENCES


S. M. Hake, S. P. Kokane, N. V. Kokare, Development and Validation of UV Spectrophotometric and RP-HPLC Methods for the Quantitative Analysis of Diflunisal in Bulk and Laboratory Mixture, Int. J. of Pharm. Sci., 2026, Vol 4, Issue 8, 4414-4427. https://doi.org/10.5281/zenodo.22120258
 10.5281/zenodo.22120258