

We use cookies to ensure our website works properly and to personalise your experience. Cookies policy
1,2 Centre for Pharmaceutical Sciences, UCESTH, JNTUH, Kukatpally, Hyderabad.
3 SSA, Central Drugs Testing Laboratory, Hyderabad
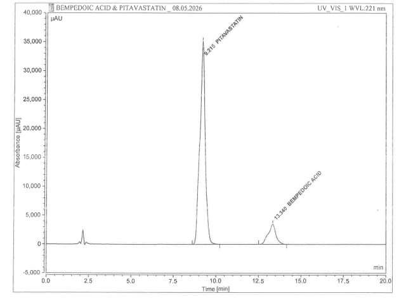
The present study focused on establishing and validating a reliable RP-UPLC method for the simultaneous quantification of Bempedoic acid and Pitavastatin calcium in bulk drug. Chromatograph analysis was performed on a C18 column (250 mm x 4.6 mm, 5 µm) using a mobile phase comprising potassium dihydrogen phosphate buffer in acetone at pH 4.5, Adjusted with KOH, in a 50:50 (v/v). The mobile phase was pumped at a flow rate of 1 mL/min under ambient temperature conditions. UV detection was performed at 221 nm. The developed method provided satisfactory separation of both analytes, with retention times of 9.215 min for Pitavastatin calcium and 13.345 min for Bempedoic acid. The analytical procedure was evaluated in accordance with applicable ICH recommendations. The method exhibited a satisfactory linear response over five concentration levels and demonstrated good precision, with low percentage relative standard deviation (RSD%) values. Accuracy was assessed by recovery studies at 50%, 100% and 150% concentration levels, resulting in recoveries within the range of 98-102 % for both drugs. The robustness of the procedure was examined by intentionally modifying the flow rate by ±0.1 mL/min. The method remained suitable under the investigated conditions. Forced degradation studies indicated appreciable degradation of the analytes under acidic and oxidative conditions. The developed procedure was capable of distinguishing the degradation products from the respective drug peaks, supporting its ability to monitor the stability of Bempedoic acid and Pitavastatin calcium. In conclusion, the developed RP-UPLC procedure provides a simple, rapid, accurate, precise, and economical analytical approach for the simultaneous determination of Bempedoic acid and Pitavastatin calcium in bulk drug. Owing to its satisfactory validation characteristics and ability to differentiate degradation products from the drug substances, the method can be considered appropriate for routine quality assessment and batch-release testing.
Ultra-Performance Liquid Chromatography (UPLC), commonly known as Ultra-High-Performance Liquid Chromatography (UHPLC), represents an advanced development of conventional HPLC. The technique utilizes very small stationary-phase particles, generally below 2 µm, together with high-pressure pumping systems to achieve enhanced chromatographic efficiency and rapid separation. First commercialized in 2004 (Waters ACQUITY UPLC), UPLC broke the traditional HPLC limits by enabling much higher plate counts and faster runs. In practice, UPLC achieves dramatically shorter analysis times and lower solvent use, often 5–10× faster runs and 5–15× less solvent use compared to a matched HPLC method [1]. Peaks are narrower and taller (higher efficiency, improved sensitivity), and thousands of theoretical plates per meter are common. These advances have led to broad industry uptake: by 2010 almost all LC instrument vendors offered UHPLC systems and modern pharmacopeial guidelines now permit using sub-2 µm columns in place of older HPLC columns under defined conditions [2].
UPLC is now standard in high-throughput pharmaceuticals, bioanalysis, environmental and food labs. This introduction reviews UPLC’s history, physical principles (van Deemter, efficiency, sensitivity), instrumentation, column chemistries, method considerations, and comparison to conventional HPLC, concluding with applications and best practices [3].
Historical Background
Since the 1960s, liquid chromatography has undergone systematic evolution alongside process in chromatogram theory and instrumental design. The advantage of using finer particles for enhanced column efficiency was anticipated as early as 1941 by Martin and Synge. This concept was put into practice in the mid-1960s, when packing materials with particle size <1 was tested by Piel (1966) and Bidlingmeyer (1969) using either gravity elution or extremely high operating pressures [4]. During 1970-1980, HPLC reached a mature stage with columns packed with 5-10 µm materials, and subsequently, 3 µm packings were introduced in the 1990s.A landmark development was reported in 2003 with Agilent`s introduction of Zorbax Rapid Resolution HT columns containing 1.8 µm particles, which first crossed the 2 µm threshold. In 2004, Waters Corp. launched its AQUITY UPLC system designed for sub-2 µm columns operating at 15,000 psi and trademarked the acronym UPLC. Around the same period, Jim Jorgenson introduced the designation UHPLC and demonstrated exceptionally high column efficiency, exceeding 200,000 theoretical plates, using capillary columns operated under pressures of approximately 4,000 bar.
Instruments capable of delivering pressures in the range of 15-19 kpsi were commercialized shortly thereafter, making sub-2 µm separations a routine practice. In 2010, a major transition was evident, as almost all modern LC systems were manufactured with UHPLC compatibility, low extra column dispersion, and high-pressure tolerant pumping modules. Regulatory guidelines have also been updated to reflect this shift; for example, the 2014 revision of USP <621> permits the replacement of conventional HPLC columns with sub-2 µm counterparts in numerous isocratic procedures [5].
1.1 Principles: Particles, Efficiency and Van Deemter
UPLC’s gains stem from particle size. Smaller particles (e.g., 1.7 µm vs 5 µm) drastically the use of smaller stationary-phase particles improve chromatographically performance by increasing the number of theoretical plates per unit length and minimizing the spreading of analyte bands.
According to the Van Deemter relationship, the plate height (H), which represents the height equivalent to a theoretical plate (HETP), is influenced by eddy diffusion (A), longitudinal diffusion (B/u), and mass transfer resistance (C*u). The A and C contributions are dependent on the particle size of the column packing material. The plate number for a given column length. Smaller particles also allow higher optimal linear velocities: van Deemter curves flatten and shift right, and UPLC can run much faster flows with minimal loss in efficiency. In practice, sub-2 µm columns routinely produce very narrow peaks (high N) and tall peak heights; efficiency (N) of 200,000–400,000 per meter is achievable. Resolution is improved (R_s ∝ √N * selectivity).
In simplified terms, narrower peaks (H smaller) increase sensitivity: peak height ∝ 1/width at equal area. Key trade-offs include much higher backpressure: pressure drop ∝ (flow particle {-2}), So UPLC systems must handle ~15,000–19,000 psi (1000–1300 bar). In summary, UPLC fundamentally leverages sub-2 µm and core-shell particles to multiply column efficiency, raising throughput and sensitivity [6].
1.2 Instrumentation
A UPLC system is architecturally similar to HPLC but optimized for high pressure and low dispersion.
I)Pump: binary (or quaternary) high-pressures mixing pumps (>1000 bar rating) with minimal dwell volume is required [6-8].
II) Plumbing: stainless or PEEK tubing with minimized ID and length reduces extra-column volume (Ideally < 20 µL) [7-8].
III) Injector/Autosampler: low-volume injector loops or direct injection micro-syringes are used; zero-dead-volume valves and narrow-bore sample loops (~1–10 µL) minimize dispersion.
IV) Column oven: Typical temperatures 30–50 °C; temperature control can reduce viscosity and help offset viscous heating in long runs.
V) Columns: UPLC columns are shorter/smaller than typical HPLC. Common formats are 2.1 mm ID × 30–150 mm length, packed with 1.3–1.9 µm particles (fully porous or core-shell) [9].
VI) Detectors: standard UV/VIS, PDA or MS detectors are used. Microbore flow cells (e.g., 0.1–1 µL cell volume) improve sensitivity and reduce band spreading.
VII) Pressure limits: modern UPLC systems routinely handle 15,000–19,000 psi, though typical runs use lower pressures (e.g., 300–1200 bar). Notably, all components must withstand these pressures; many UHPLC systems use reinforced pistons, metal-free fluid paths, and specialized ferrules. Because system dispersion must be very low to reap the benefits of UPLC, system dwell volume, mixing volume and dead volumes are minimized by design [10].
UPLC columns cover similar chemistries as HPLC, but with fine particles or novel designs.
I) Fully porous particles: Traditional silica or hybrid silica packing with 1.3–1.9 µm diameters (e.g., Waters BEH columns, Agilent Infinity Lab) are common. These give maximal efficiency but at very high pressure.
II) Core-shell (superficially porous) particles: These have solid silica cores (e.g., 1.6–2.7 µm outer diameter) and thin porous shells. Core-shell columns (e.g., 1.7 µm Halo®, 2.6 µm Kinetex®) deliver near-UPLC efficiencies at much lower pressure (often<600 bar for 2.6 µm core-shell). Thus, they performance features of HPLC AND UHPLC [12-14].
III) Monolithic and polymer columns exist but are less common for UPLC.
Available stationary phase chemistries include all reversed-phase and specialized phases: C18/C8 alkyls (broad utility), phenyl (π–π interactions), PFP/fluoro-phenyl, cyano, HILIC phases for polar analytes, strong cation/anion exchange, and biocompatible or polar-embedded phases. Pore size is chosen by analyte: 60–120 Å for small molecules; 150–300 Å for peptides; ≥300 Å for intact proteins. Very narrow-bore (1.0 mm) and larger-bore (3.0 mm) UPLC columns exist for trace analysis or increased load ability, respectively. All UPLC columns require ultra-pure, 0.2 µm-filtered mobile phases to avoid clogging their small frits [16]
1.4 Mobile Phase and Method Development
Mobile phases in UPLC are the same solvents/buffers as in HPLC, but with tighter control and often steeper gradients due to faster runs. Common LC-MS grade solvents include water, acetonitrile, and methanol, with additives such as dilute acids or low-molarity buffers for pH adjustment [17].
I) Solvent purity and degassing are critical: even tiny particulates or salt precipitates (≥0.2 µm) can block UPLC frits. Use high-grade solvents (0.22 µm filtration) and freshly prepared buffers.
II) Flow rates: are scaled to column dimensions. A rule of thumb for 2.1 mm ID, 1.7–1.9 µm columns are ~0.3–0.6 mL/min for reversed-phase. These flows maintain linear velocities near the optimum. Very short columns (e.g., 30 mm) permit higher flows (1–2 mL/min) for ultrafast peaks, whereas 50–150 mm columns might run at 0.2–0.8 mL/min depending on pressure constraints [18].
III) Temperature: Operating at moderately elevated temperature (e.g., 30–40 °C) can reduce viscosity (lower pressure) and sometimes improve peak shape. Buffer pH should respect column stability (commonly pH 2–8 for silica) [19].
IV) Method scaling: When translating an HPLC method to UPLC, one generally keeps stationary phase chemistry the same, then adjusts flow and gradient for the new column dimensions. Under USP guidelines, isocratic methods can often be transferred to UPLC with minimal revalidation by applying established scaling rules. However, gradient methods usually require re-optimization [20].
UPLC
Table 1.1: UPLC. (Sources: manufacturer data and reviews.)
|
Metric |
UPLC/UHPLC (sub-2 µm) |
|
Max Pressure |
15,000–19,000 psi (1000–1300 bar) |
|
Particle Size |
Sub-2 µm (1.3–1.9 µm) fully porous; 1.3–2.6 µm core–shell |
|
Efficiency (N) |
~100,000–400,000 plates/m (dramatically higher) |
|
Analysis Time |
Rapid (often 1–10× faster; sub-5 min gradients common) |
|
Solvent Use |
Much lower (≈20–80% of HPLC volume) |
|
Sensitivity (UV) |
Higher: narrower peaks yield 3–10× signal increase |
|
Detection LOD |
5–10× lower LOD (due to concentration of analyte in smaller volume peak) |
|
Precision |
Often better: RT RSD 0.1–0.5%, area <0.1%RSD |
|
Column Lifetime |
Comparable in sample volumes, but more sensitive to particulates |
|
Instrument Cost |
Higher (specialized high-pressure systems) |
|
Robustness |
Requires careful plumbing, filtering; maintenance more critical (e.g., guard columns) |

Fig.1.1 Instrumentation of UPLC Diagram
Table 1.2: Common validation Criteria for RP-UPLC Method
|
Validation Parameter |
Acceptance Recommendation |
|
Retention Factor (K') |
The analyte peak must be clearly separated from other peaks and from the void. In general, K' ≥ 2. |
|
Repeatability (%RSD) |
RSD should be ≤ 1%; it is preferable to have N ≥ 5 injections. |
|
Relative Retention Time |
Not essential as the resolution is already reported. |
|
Resolution (Rs) |
The resolution between the main peak and the nearest interfering peak should be more than 2. |
|
Tailing Factor (T) |
It should be T ≤ 2. |
|
Column Efficiency (N) |
The number of theoretical plates should generally be > 2000. |
Table 1.3: System Suitability Parameters with Acceptance Limits
|
Characteristics |
Acceptance Limit |
|
Accuracy/Trueness |
Individual recovery within 98–102% |
|
Precision |
RSD ≤ 2% |
|
Repeatability |
RSD ≤ 2% |
|
Intermediate Precision |
RSD ≤ 2% |
|
Limit of Detection (LOD) |
Signal-to-noise ratio should be greater than 2 or 3 |
|
Limit of Quantification (LOQ) |
S/N > 10 |
|
Linearity |
Correlation coefficient R² > 0.999 |
2.DRUG PROFILE
2.1. BEMPEDOIC ACID:
Bempedoic acid is an oral lipid-lowering agent primarily used to reduce elevated LDL cholesterol levels. It is mainly used to manage hypercholesterolemia. This drug comes under the category of adenosine triphosphate (ATP) citrate lyase (ACL) inhibitors. It is indicated as an adjunct to dietary therapy and maximally tolerated statin treatment for the reduction of LDC-C levels in adults with primary hypercholesterolemia or established cardiovascular disease who require additional LDL-C lowering (21).
It is a prodrug in nature. After administration, it gets converted to its pharmacologically active form, Bempedoyl-CoA, with the help of the enzyme very long-chain acyl-C0A synthetase-1 (ACSVL1). This enzyme is present predominantly in the liver. Bempedoic acid inhibits ATP-citrate lyase, an enzyme involved in cholesterol synthesis before HMG-CoA reductase. This reduces cholesterol production in the liver and increases LDL receptors on liver cells, helping to remove LDL-C from the blood. This results in higher removal of LDL-cholesterol from the blood circulation (22).
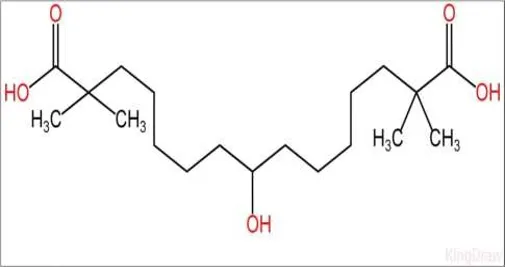
Fig 2.1: Structure of Bempedoic Acid
IUPAC Name: 8-Hydroxy-2,2,14,14-tetramethylpentadecanedioic acid.
Molecular Formula: C19H36O5

Molecular Weight: 344.49 g/mol
CAS Number: 738606-46-7
Description: A white to off-White crystalline powder.
Solubility: Highly soluble in ethanol and soluble in methanol, acetonitrile, and potassium dihydrogen phosphate, but practically insoluble in water [23].
Mechanism of Action:
Bempedoic acid is a first-in-class ATP-citrate lyase (ACL) inhibitor used to reduce LDL-C levels. It is a prodrug that is converted in the liver to its active form, bempedoyl-CoA, by very long chain acyl-CoA synthetase-1(ACSVL).
The active metabolite inhibits ATP-citrate lyase, an enzyme located upstream of HMG-CoA reductase in hepatic cholesterol synthesis. Inhibition of ACL decreases hepatic cholesterol synthesis, thereby increasing LDL receptor expression on hepatocytes. The increased number of LDL receptors enhances the removal of circulating LDL cholesterol from the bloodstream, thereby lowering plasma LDL-C levels. Consequently, it has a lower incidence of muscle related adverse effects compared with statins, making it a suitable option for statin-intolerant patients.
Table 2.1: Pharmacokinetics
|
Parameter |
Description |
|
Absorption |
Bempedoic acid is rapidly absorbed following oral administration, reaching peak plasma concentration (Tmax) at approximately 3.5 hours. |
|
Bioavailability |
Good oral absorption; food has no clinically significant effect. |
|
Protein binding |
Approximately 99%, primarily to plasma proteins. |
|
Distribution |
Volume of distribution is approximately 18 L, indicating limited tissue distribution. |
|
Metabolism |
Primarily metabolized in the liver by glucuronidation through UGT2B7 and converted to the active metabolite by ACSVL1. Minimal CYP450 involvement. |
|
Elimination |
It is eliminated predominantly in the urine as metabolites, with a minor fraction excreted through feces. |
|
Elimination half-life |
Approximately 21 hours. Steady-state achieved after approximately 7 days of once-daily dosing. |
Adverse Reactions:
Common adverse reactions observed during clinical studies include: respiratory tract infection, Muscle spasms, Abdominal pain, Hyperuricemia (increased serum uric acid), Gout, Elevated liver enzymes (ALT and Anaemia, Increased blood urea nitrogen, Tendon rupture (rare but serious), Fatigue, Headache.
Serious adverse effects:
Hyperuricemia leading to gout, Elevated hepatic transaminases, Hypersensitivity reactions (rare)
Drug Interactions: Bempedoic acid has relatively few clinically significant drugs. interactions because it is not extensively metabolized by cytochrome P450 enzymes.
Table 2.2: Dosage and Administration
|
Parameter |
Recommendation |
|
Recommended adult dose |
180 mg orally once daily |
|
Route of administration |
Oral |
|
Administration |
May be taken with or without food. Swallow tablets whole with water. |
|
Combination therapy |
Can be used alone or in combination with statins and/or ezetimibe. |
|
Missed dose |
Take as soon as remembered on the same day. If it is almost time for the next dose, skip the missed dose and continue the regular schedule. Do not double the dose. |
|
Renal impairment |
No dose adjustment is generally required in mild or moderate renal impairment. |
|
Hepatic impairment |
No dose adjustment is generally required in mild or moderate hepatic impairment; use is not recommended in severe hepatic impairment due to limited clinical data. |
|
Storage |
Store at 20–25°C, protected from excessive moisture and light. |
2.2 PITAVASTATIN CALCIUM:
Pitavastatin calcium is a synthetic lipid-modifying compound classified among the statin drugs. It exerts its therapeutic action by inhibition HMG-CoA reductase and is primarily indicated for the management of elevated cholesterol levels and mixed lipid abnormalities, thereby contributing to the prevention of cardiovascular complications.
Its therapeutic efficacy is attributed to its ability to substantially lower plasma concentrations of low-density lipoprotein cholesterol (LDL-C), total cholesterol, triglycerides, and apolipoprotein B, Accompanied by an elevation in high-density lipoprotein cholesterol (HDL-C).
Pitavastatin calcium reduces cholesterol levels by competitively inhibiting HMG-CoA reductase, thereby suppressing hepatic cholesterol synthesis and increasing LDL-receptor expression on hepatocytes. This enhances the hepatic clearance of circulating LDL-C and lowers plasma LDL-C levels. Its limited metabolism through the cytochrome P450 system, particularly CYP2C9 with minimal CYP3A4 involvement, results in a relatively low potential for drug–drug interactions.
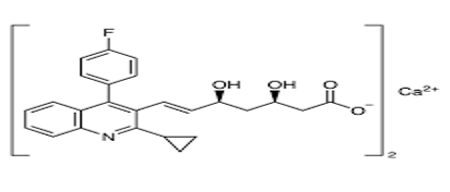
Fig 2.2: Structure of Pitavastatin calcium

Mechanism of Action
Pitavastatin calcium competitively inhibits HMG-CoA reductase, the rate-limiting enzyme involved in hepatic cholesterol biosynthesis. This inhibition decreases intracellular cholesterol production, resulting in compensatory upregulation of LDL receptors on the hepatocyte surface. The increased receptor activity enhances the uptake and clearance of circulating LDL particles from the bloodstream, thereby reducing plasma LDL-Cholesterol levels. Consequently, Pitavastatin calcium produces a lipid-lowering effect and contributes to the management of hypercholesterolemia.
The enhanced receptor expression facilitates greater uptake and elimination of circulating low-density lipoprotein cholesterol (LDL-C) from the bloodstream.
Additionally, Pitavastatin decreases the hepatic synthesis of very-low-density lipoprotein (VLDL) and lowers plasma triglyceride concentrations, while producing a moderate elevation in high-density lipoprotein cholesterol (HDL-C) levels. Collectively, these lipid-modulating actions contribute to lowering the risk of atherosclerotic cardiovascular diseases (24).
Table 2.3: Pharmacokinetic Properties
|
Parameter |
Description |
|
Absorption |
Pitavastatin calcium is rapidly absorbed after oral administration and reaches its peak plasma concentration within 0.5–1.2 hours. |
|
Bioavailability |
Approximately 51% following oral administration. |
|
Protein Binding |
Greater than 99%, mainly to albumin and α1-acid glycoprotein. |
|
Distribution |
It shows extensive distribution throughout the body, with an approximate volume of distribution of 148 L. |
|
Metabolism |
The drug undergoes limited metabolism mainly through CYP2C9 and, to a lesser extent, CYP2C8. Glucuronidation is the major metabolic process and results in the formation of an inactive lactone metabolite. |
|
Elimination |
Primarily excreted via bile and feces; a small proportion is eliminated in urine. |
|
Elimination half-life |
Approximately 12 hours. |
|
Steady State |
Achieved within 4–6 days of once-daily administration [25]. |
Adverse Reactions
Pitavastatin calcium is generally well tolerated. The adverse effects reported most frequently include: Myalgia (muscle pain), Arthralgia (joint pain), Back pain, Constipation, Diarrhea, Nausea, Headache, Elevated liver enzymes (ALT and AST), Increased creatine kinase (CK).
Serious Adverse Reactions: Myopathy, Rhabdomyolysis (rare but serious), Hepatotoxicity, Hypersensitivity reactions, New-onset diabetes mellitus (rare).
Drug Interactions: Pitavastatin has fewer drug interactions than many other statins because it undergoes minimal metabolism via the cytochrome P450 system.
Therapeutic Uses
Primary Hypercholesterolemia
Combination of Bempedoic Acid and Pitavastatin Calcium
The combination of Bempedoic acid and Pitavastatin calcium provide a complementary therapeutic approach for managing hypercholesterolemia and reducing the risk of atherosclerotic cardiovascular disease (ASCVD). These two agents possess complementary mechanisms of action, producing greater reductions in low-density lipoprotein cholesterol (LDL-C) than either drug alone.
Bempedoic acid suppresses cholesterol production by targeting ATP-citrate lyase (ACL), which functions at an earlier stage of the cholesterol synthesis pathway. Pitavastatin calcium acts at a later stage by inhibiting HMG-C0A reductase, the principal regulatory enzyme of cholesterol biosynthesis.
Acting at different points in the same metabolic pathway results in additive inhibition of clearance of circulating LDL-C. reduced hepatic cholesterol synthesis, upregulation of LDL receptors, and enhanced clearance of circulating LDL-C.
Unlike many statins, Pitavastatin undergoes minimal metabolism through the cytochrome P450 enzyme system, and bempedoic acid is activated only in the liver. These characteristics reduce the likelihood of clinically significant pharmacokinetic interactions and may lower the lower likelihood of muscle-related adverse effects than regimens containing higher statin doses some other statins.[27].
This combination is particularly beneficial in patients who:
Advantages of the Combination
Table 3.1: Literature review
|
Sr. No. |
Author(s) & Year |
Drug(s) |
Method Developed |
Key Findings |
|
1 |
Jain H.K. et al., [30] 2009 |
Pitavastatin Calcium |
RP-HPLC and UV Spectrophotometric Method |
Developed and validated accurate, precise, and economical methods for estimation of Pitavastatin calcium in tablet dosage forms. |
|
2 |
Niranjani S. and Venkatachalam K.,[31] 2019 |
Pitavastatin Calcium |
UV Spectrophotometric Stability-Indicating Method |
Evaluated degradation behaviour under acidic, alkaline, oxidative, thermal, and photolytic conditions. Method showed good accuracy and precision. |
|
3 |
Kumar NS, Bhagya Lakshmi J.,[32] 2018–2020 |
Pitavastatin Calcium |
HPTLC Method |
Developed simple and cost-effective HPTLC methods suitable for routine quality control analysis. |
|
4 |
Di B, Su MX, Yu F, Qu LJ, Zhao LP, Cheng MC, et al.,[33] 2020 |
Pitavastatin Calcium |
LC-MS/MS Method |
Established highly sensitive methods for pharmacokinetic and bioanalytical studies. |
|
5 |
Bapatu P.K.R. and Sharma A.K.,[34] 2023 |
Pitavastatin Calcium |
Stability-Indicating RP-HPLC Method |
Successfully separated Pitavastatin from degradation products and validated according to ICH guidelines. |
|
6 |
Chakraborty G.S. et al., [35] 2024 |
Bempedoic Acid |
Review of Analytical Methods |
Summarized available HPLC, HPTLC, UV, and LC-MS methods and highlighted future analytical challenges. |
|
7 |
Neelofar H. et al.,[36] 2026 |
Bempedoic Acid + Rosuvastatin |
Stability-Indicating UPLC Method |
Simultaneously estimated both drugs with excellent separation and compliance with ICH validation requirements. |
|
8 |
Kashid A.M. et al., [37] 2026 |
Bempedoic Acid |
AQbD-Based Stability-Indicating HPTLC Method |
Applied Analytical Quality by Design principles and obtained robust, accurate, and reproducible results. |
|
9 |
Present Research Gap [34-37]. |
Bempedoic Acid + Pitavastatin Calcium |
Simultaneous Stability-Indicating RP-HPLC Method |
Limited literature available for simultaneous estimation of bempedoic acid and Pitavastatin calcium, indicating a need for novel method development and validation. development and validation of a stability-indicating RP-UPLC method for simultaneous estimation of bempedoic acid and Pitavastatin calcium is justified. [34–37]. |
4.1 Aim
The present study focuses on the development and validation of a rapid and accurate analytical method. Stability-indicating RP-UPLC method for the simultaneous qualification of Bempedoic acid and Pitavastatin calcium in bulk form (38).
4.2 Objective
The primary objectives of this study are:
4.3 Plan of Work
The study was designed to establish an RP-UPLC method for the simultaneous determination of bempedoic acid and Pitavastatin calcium in bulk drug. The experimental work was carried out in two main phases.
Phase 1: Optimization of chromatographic condition
Phase 2: Validation of method
The developed method was proposed to be validated using the various validation parameters such as:
Table 5.1: CHEMICALS & REAGENTS:
|
Sr. No |
Chemicals |
Quality |
|
1 |
Bempedoic acid, Pitavastatin calcium |
Central Drugs Testing Laboratory |
|
2 |
Water |
HPLC Grade |
|
3 |
Potassium dihydrogen phosphate |
HPLC Grade |
|
4 |
Acetonitrile |
HPLC Grade |
|
5 |
Methanol |
HPLC Grade |
|
6 |
Orthophosphoric Acid |
AR Grade |
Table 5.2: EQUIPMENT AND INSTRUMENTS:
|
Sr. No |
Instruments |
Model |
|
1 |
UPLC |
Ultimate 3000, Autosampler |
|
2 |
UV Spectrometer |
Shimadzu |
|
3 |
PH meter |
Lab India |
|
4 |
Analytical Weighing balance |
Sortorius, BAL-SA-06 |
|
5 |
Hot Air oven |
Thermo fishcer scientific |
5.3 Method Development of an RP-UPLC Method for the Simultaneous Estimation of Bempedoic acid and Pitavastatin Calcium:
The equipment and chemicals utilized during the study are presented in Tables 5.1 and 5.2. respectively.
5.3.1 Preparation of Buffer solution:
Weigh and dissolve 6.8 g of KH2PO4 in 1000 ml of Hplc grade water and adjust pH to 4.5 with KOH. The Prepared solution was passed through a 0.45 µm Millipore membrane filter paper.
5.3.2 Mobile phase Preparation (KH2PO4 in 50:50 ACN /H2O)
Combine 500 mL of ACN and 500 mL of H2O, add 85% of KH2PO4, mix together, degas in an ultrasonic water shower for 10 minutes, and then separate using a 0.45 μm filter while being filtered via a vacuum.
5.3.3 Preparation of Diluent (65:35 ACN/H2O)
Combine 325 mL of Acetonitrile and 175 mL of Water and mix well.
5.3.4 Preparation of Primary Standard stock solution
Accurately weigh 180 mg of Bempedoic acid into 100 mL volumetric flask. The substance was dissolved using the selected diluent, and the resulting solution was diluted to the required volume.
5.3.5 Preparation of Standard stock solution 2
Accurately weigh 10 mg of Pitavastatin calcium into 100 mL volumetric flask. The contents were dissolved completely in the diluent and the volume was adjusted to the calibration mark.
5.3.6 Preparation of Working standard solution
Aliquots of 5 mL each from the Bempedoic acid and Pitavastatin calcium stock solutions were accurately transferred into a 50 mL volumetric flask. The volume was then adjusted to the calibration mark using the selected diluent.
5.3.7 Determination of Isobestic point (λ max):
An accurately weighed quantity of 15 mg each of Bempedoic acid and Pitavastatin calcium reference standards was transferred separately into 10 mL volumetric flasks. Approximately three-fourths of the final volume was added with methanol, followed by sonication for 10 minutes to ensure complete dissolution. The volume was subsequently made up to the calibration mark with methanol. Methanol was used as the blank during UV spectrophotometric analysis. The maximum absorbance (λ max) of the drug mixture was observed at 221 nm.
For chromatographic method development, different mobile-phase compositions containing water, methanol, acetonitrile, and suitable buffer solutions were evaluated in various combinations and proportions. Based on the chromatographic response obtained during the trails, methanol was selected as the mobile phase component. A flow rate of 1.0 mL/min provided sharp and well-defined chromatographic peaks.
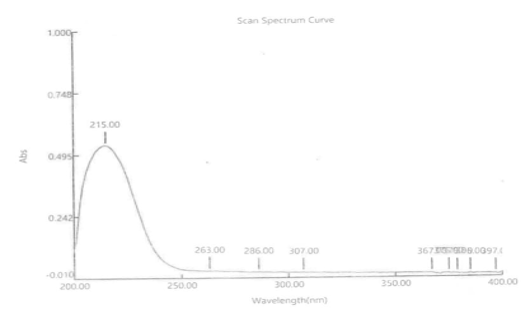
Fig 5.1: UV spectrum of standard Bempedoic acid
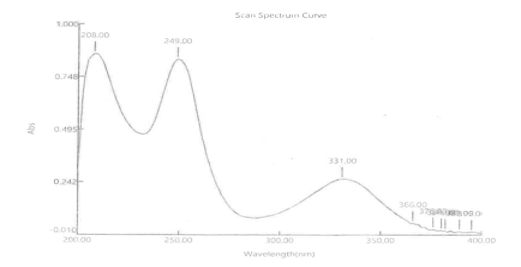
Fig 5.2: UV spectrum of standard Pitavastatin calcium
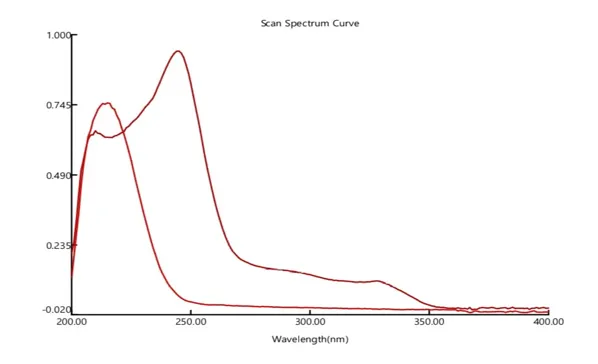
Fig 5.3: UV spectrum of Isobestic point of Bempedoic Acid & Pitavastatin calcium.
5.3.8 CHROMATOGRAPHIC CONDITIONS:
Trail-1
Method development was carried out by varying the mobile-phase composition and buffer conditions.
Chromatographic conditions:
Mobile phase: Water: Acetonitrile (50:50) (v/v)
Flow rate: 1.0 mL/min
Column: C18 Column (250 mm x 4.6 mm,5 μm)
Detection wavelength: 245 nm
Column temperature: 30°C
Injection volume:10 μL
Run time: 30 min
Diluent: Water and Acetonitrile in the ratio 0f 50:50 (v/v)
Results: Bempedoic acid and Pitavastatin calcium peaks were obtained; however, the peak shaped were unsatisfactory, further trail was carried out.
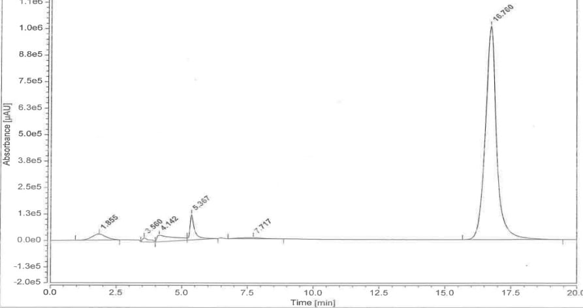
Fig 5.4: Trail-1 Chromatogram of Bempedoic acid and Pitavastatin calcium
Trail-2: Chromatographic conditions:
Mobile phase: Methanol: Opa (30:70) (v/v)
Flow rate: 1.0 mL/min
Column: C18 column (250 mm x 4.6 mm,5 μm)
Detection wavelength: 247 nm
Column temperature: 30°C
Injection volume: 10 μL
Run time: 30 min
Diluent: Water: Acetonitrile in the ratio 50:50 (v/v)
Results: Pitavastatin calcium was eluted successfully, whereas the peak shape of bempedoic acid was unsatisfactory. Hence, further optimization was performed.
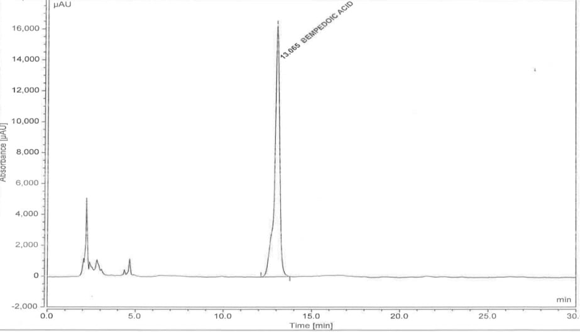
Fig 5.5: Trail-2 Chromatogram Bempedoic acid and Pitavastatin calcium
Trail-3: Chromatographic conditions:
Mobile phase: Buffer: acetonitrile (50:50) (v/v)
Flow rate: 1.0 mL/min
Column: C18 column (250 mm x 4.6 mm,5 μm)
Detection wavelength: 230 nm
Column temperature: 30°C
Injection volume: 10 μL
Run time: 30 min
Diluent: Water: Acetonitrile (50:50) (v/v)
Result: In this trail Pitavastatin calcium and bempedoic acid peaks were eluted but satisfactory peak shape was not achieved. Therefore, further optimization was undertaken.
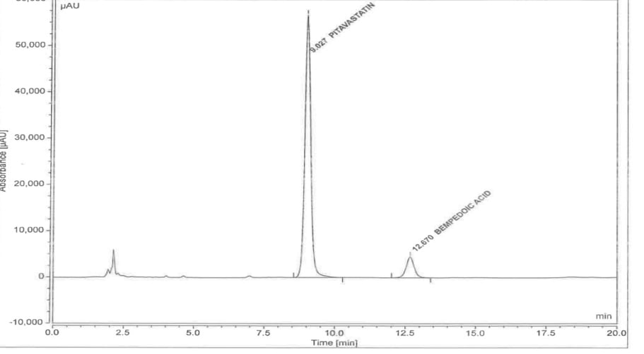
Fig 5.6: Trail-3 Chromatogram Bempedoic acid and Pitavastatin calcium
Trail-4 :5.3.9 Optimized Chromatographic conditions:
Mobile phase: KH2PO4 in (50:50) ACN/H2O
Flow rate:1.0 mL/min
Column: C18 Column (250 mmx 4.6 mm,5 μm)
Detector wave length: 221 nm
Column temperature: 30°C
Injection volume:10 μL
Run time: 30 min
Diluent: Water and Acetonitrile in the ratio (35:65) (v/v)
Observation: The developed conditions provided satisfactory separation, with retention times of approximately 13.32 and 30.0 min for the respectively. Obtained theoretical plate count and tailing factor indicated adequate column efficiency and peak symmetry. Hence, these chromatographic conditions were considered suitable and selected for further method development and validation.
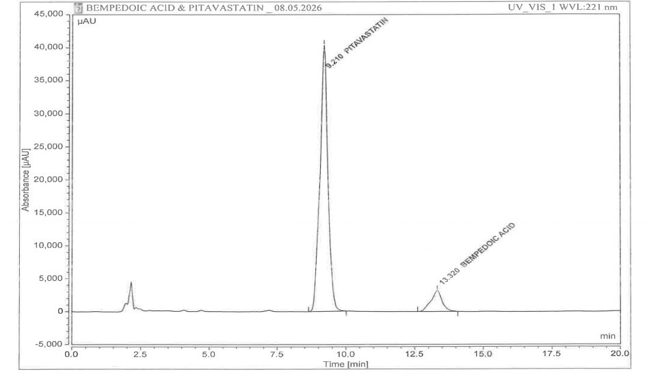
Fig 5.7: Trail-4 Chromatogram Bempedoic acid and Pitavastatin calcium
6. RESULTS AND DISCUSSION
6.1 validation of the Developed Analytical Method for Simultaneous Quantification of Bempedoic acid and Pitavastatin calcium:
A systematic process of documenting evidence that demonstrates with high certainty that a given analytical method consistently produces results aligned with predefined quality standards and specifications.
6.1.1 Linearity:
Linearity was evaluated using five standard concentrations within the range of 72 – 360 μg/mL for Bempedoic acid and 4-20 μg/mL for Pitavastatin calcium.
Calibration curves were constructed by plotting the corresponding peak area against the respective drug concentration. The obtained regression equations showed sloped of 9294.1 for bempedoic acid and 83399.35 for Pitavastatin calcium, with correlation coefficients (R2) of 0.9994 and 1.0000, respectively. The results demonstrated an excellent relationship between concentration and peak response over the investigated ranges. Linearity plot was shown in Fig 6.10.
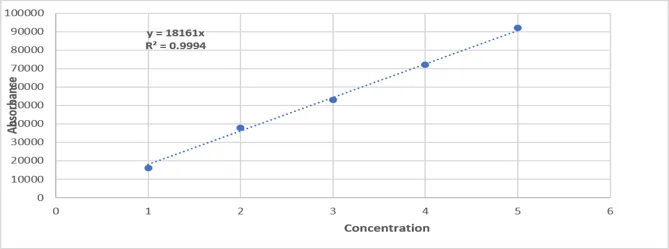
Fig 6.1: Linearity (calibration) curve of Bempedoic acid
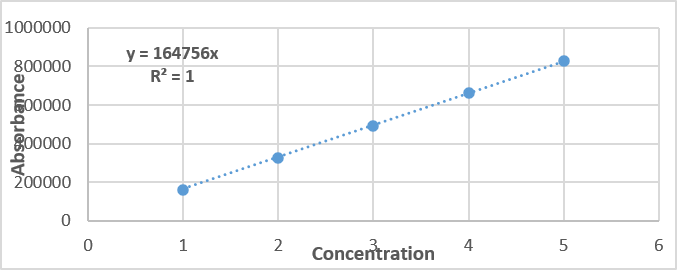
Fig 6.2: Linearity (calibration) curve of Pitavastatin Calcium.
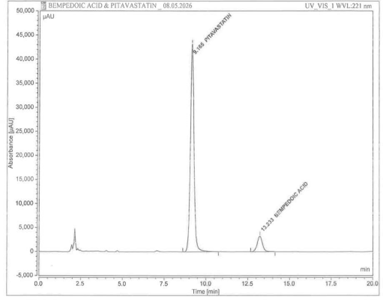
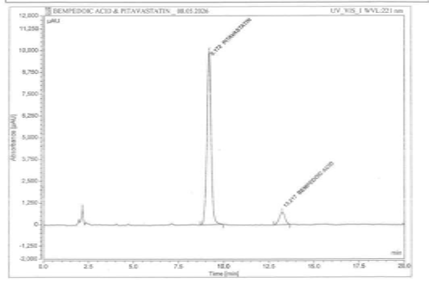
Linearity chromatogram-1 Linearity chromatogram-2
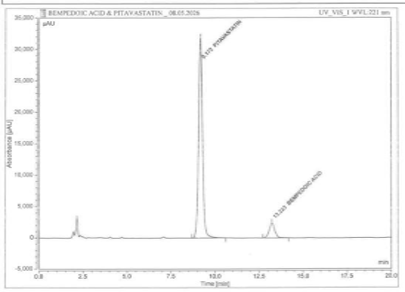
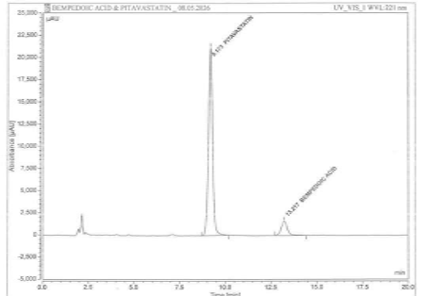
Linearity chromatogram-3 Linearity chromatogram-4
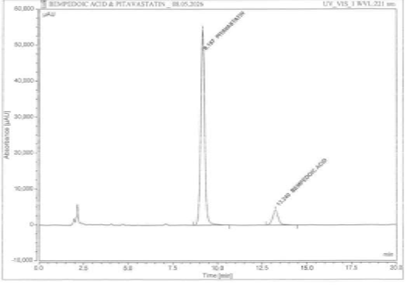
Linearity chromatogram-5
Fig 6.3: Linearity Chromatograms of Bempedoic acid and Pitavastatin calcium
Table 6.1: Linearity results for Bempedoic acid and Pitavastatin calcium
|
Sr. No |
Concentration |
Bempedoic acid |
Pitavastatin calcium |
||
|
|
|
Area |
Ret Time |
Area |
Ret Time |
|
1 |
2 |
16101 |
13.217 |
159015 |
9.172 |
|
2 |
4 |
37872 |
13.217 |
327474 |
9.173 |
|
3 |
6 |
53038 |
13.223 |
490998 |
9.172 |
|
4 |
8 |
71990 |
13.233 |
660581 |
9.165 |
|
5 |
10 |
91983 |
13.240 |
826455 |
9.152 |
|
Correlation Coefficient (r2) |
|
R² =0.9994 |
|
R² = 1 |
|
Result: Linearity was established over 50%-150% of the nominal concentration, corresponding to 72-360 µg/mL for bempedoic acid and 4-20 µg/mL for Pitavastatin calcium.
The correlation coefficients were 0.9994 and 1.0000, respectively, confirming good linearity.
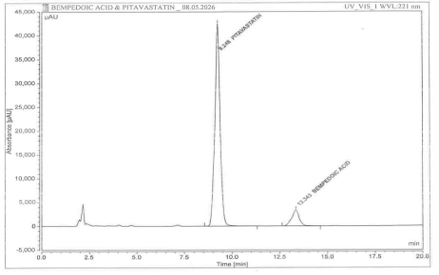
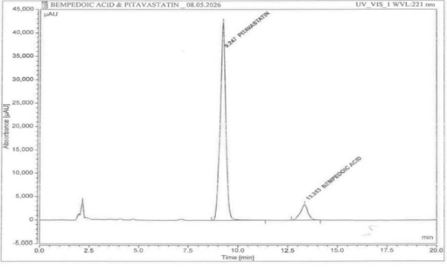
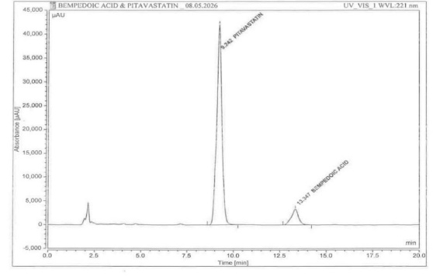
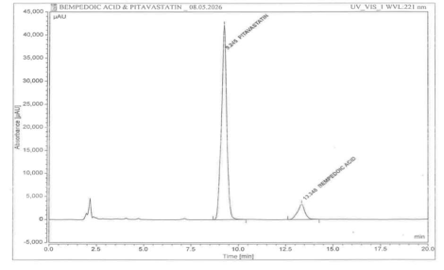
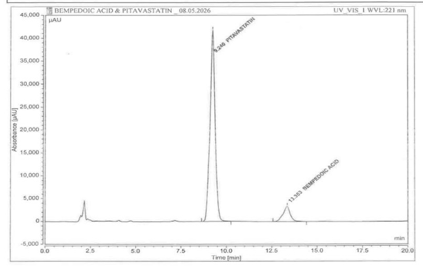
6.1.2 Method precision (Repeatability): Repeatability of the proposed method was assessed from five replicate preparations (n=5) at concentrations of 180 μg/mL for bempedoic acid ang 10 μg/mL for Pitavastatin calcium. Each preparation was analysed using unchanged chromatographic conditions and the resulting peak areas and retention times were recorded.
Precision Chromatogram-01 Precision Chromatogram-02
Precision Chromatogram-03 Precision Chromatogram-04
Precision Chromatogram-05
Fig 6.4: Precision Chromatograms of Bempedoic acid and Pitavastatin calcium.
Table 6.2: Precision results for Bempedoic acid and Pitavastatin calcium
|
SR. NO |
BEMPEDOIC ACID |
PITAVASTATIN CALCIUM |
||||||
|
RT (min) |
Area |
%Area |
Asymmetry (EP/USP) |
RT (min) |
Area |
% Area |
Asymmetry (EP/USP) |
|
|
Injection-1 |
13.343 |
91282 |
10.01 |
0.95 |
9.248 |
820925 |
89.99 |
0.97 |
|
Injection-2 |
13.353 |
88074 |
9.66 |
0.91 |
9.247 |
824105 |
90.34 |
0.98 |
|
Injection-3 |
13.348 |
90937 |
9.97 |
0.93 |
9.245 |
821048 |
90.03 |
0.98 |
|
Injection-4 |
13.347 |
89312 |
9.84 |
0.93 |
9.242 |
818125 |
90.16 |
0.98 |
|
Injection-5 |
13.353 |
91238 |
10.03 |
0.93 |
9.240 |
818235 |
89.97 |
0.98 |
|
Mean |
13.3488 |
90168.6 |
9.902 |
0.93 |
9.2444 |
820487.6 |
90.098 |
0.978 |
|
%RSD |
0.031959 |
1.577678 |
1.557011 |
1.52066 |
0.036363 |
0.300073 |
0.171119 |
0.457274 |
Result: The %RSD value was below 2.0%, confirming the satisfactory precision of the proposed method.
6.1.3 Repeatability Chromatogram
Intermediate precision was assessed by analysing six sample preparations at a concentration of 100 µg/mL on the subsequent day. The percentage assay was determined, and the %RSD was found to be 0.5%, indicating good intermediate precision. The corresponding chromatograms are shown in Fig 2.14.
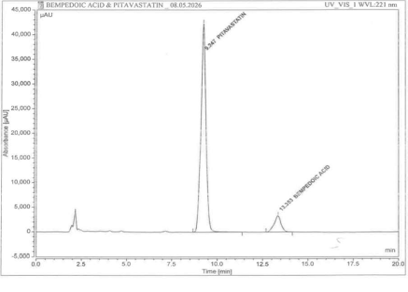
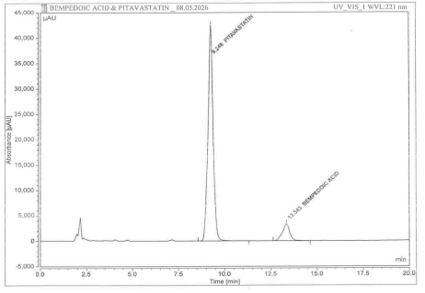
Fig 6.4.1: Intermediate Precision -01 Fig 6.4.2: Intermediate Precision - 02
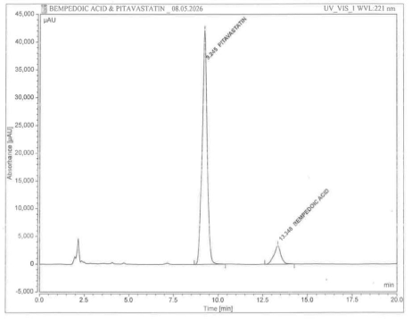
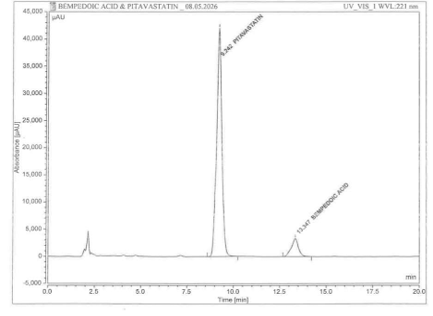
Fig 6.4.3: Intermediate Precision – 03 Fig 6.4.4: Intermediate Precision -04
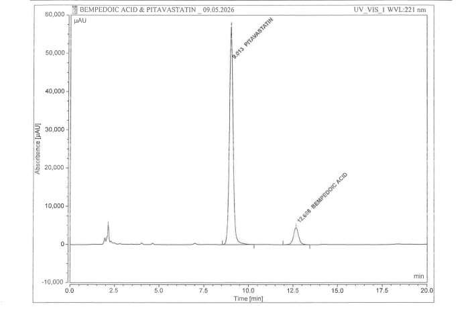
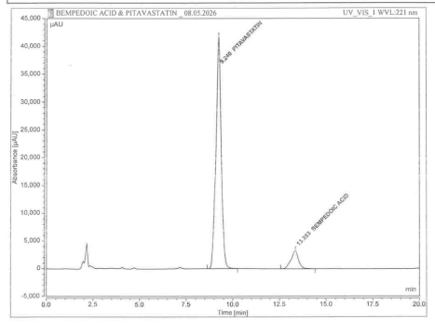
Fig 6.4.4: Intermediate Precision -05 Fig 6.4.4: Intermediate Precision -06
Table 6.3: Results of Intermediate Precision for Pitavastatin calcium and Bempedoic acid.
|
Sr. No |
Pitavastatin calcium |
Bempedoic acid |
||||
|
|
Conc. (µg/mL) |
Peak area |
Retention Time (min) |
Conc. (µg/mL) |
Peak area |
Retention Time (min) |
|
1 |
2 |
824820 |
9.033 |
180 |
90637 |
12.683 |
|
2 |
2 |
823118 |
9.027 |
180 |
89894 |
12.670 |
|
3 |
2 |
822598 |
9.020 |
180 |
91348 |
12.667 |
|
4 |
2 |
827710 |
9.017 |
180 |
91114 |
12.663 |
|
5 |
2 |
828813 |
9.018 |
180 |
91132 |
12.672 |
|
6 |
2 |
826980 |
9.013 |
180 |
91490 |
12.668 |
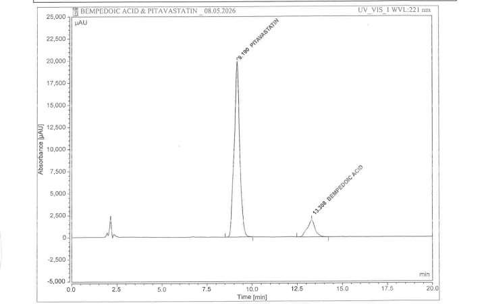
6.1.4 Accuracy: The accuracy of the method was determined using samples fortified at 50%, 100%, and 150% of the target concentration. Three replicate injections were performed at each level.
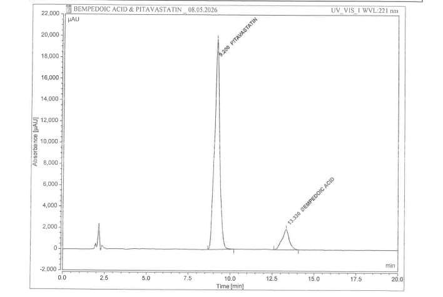
Chromatogram of Accuracy at 50% -1 Chromatogram of Accuracy at 50% -2
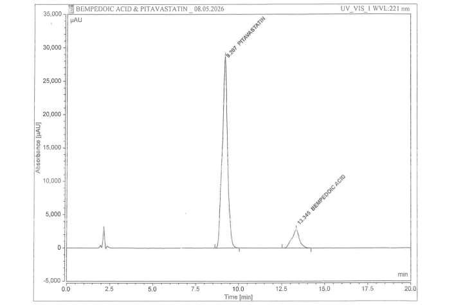
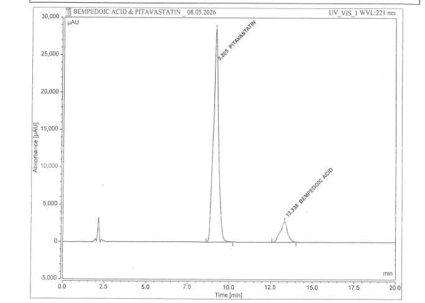
Chromatogram of Accuracy at 50% -3 Chromatogram of Accuracy at 50% -4
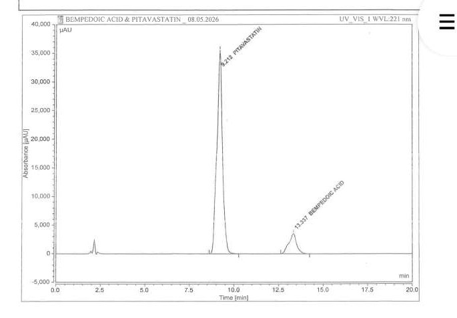
Chromatogram of Accuracy at 50% -5 Chromatogram of Accuracy at 50% -6
Fig 6.5: Accuracy Chromatograms of Bempedoic acid and Pitavastatin calcium
Table 6.4: Acurracy results of Bempedoic acid and Pitavastatin calcium
|
SR. NO |
ACCURACY % Level |
Amount Spiked |
Amount Spiked |
||
|
Area |
BPA |
Area |
PTV |
||
|
1 |
5O%-1 |
57744 |
57744 |
421998 |
421998 |
|
2 |
50%-2 |
57022 |
57022 |
420718 |
420718 |
|
3 |
100%-1 |
84687 |
84687 |
617831 |
617831 |
|
4 |
100%-2 |
82758 |
82758 |
619281 |
61928 |
|
5 |
150%-1 |
107122 |
10712 |
780144 |
780144 |
|
6 |
150%-2 |
108139 |
108139 |
777545 |
777545 |
Result: The results indicate that the developed method exhibits satisfactory accuracy and conforms to the established acceptance criteria.
6.1.5 Limit of Detection (LOD) and Limit of Quantification (LOQ): The values were determined from the standard deviation (σ) of the y-intercept and the slope (S) of the calibration curve with the following equations:
LOD = 3.3 x σ / S
LOQ=10 x σ / S
Table 6.5: The LOD and LOQ values determined for Bempedoic acid and Pitavastatin calcium are presented.
|
|
Bempedoic acid |
Pitavastatin calcium |
|
LOD |
10.44807 |
10.43564 |
|
LOQ |
31.6608 |
31.62314 |
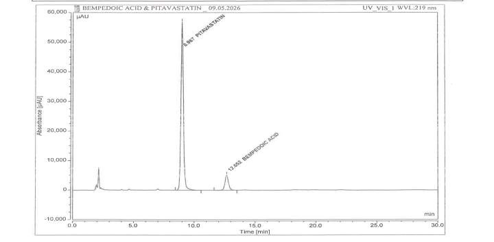
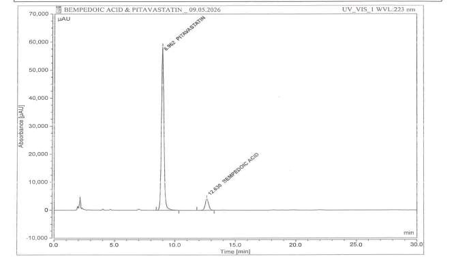
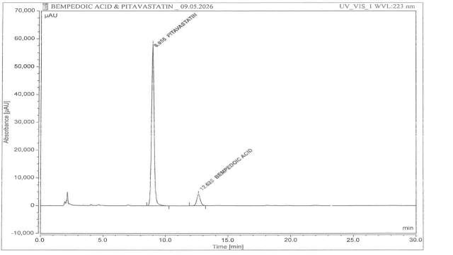
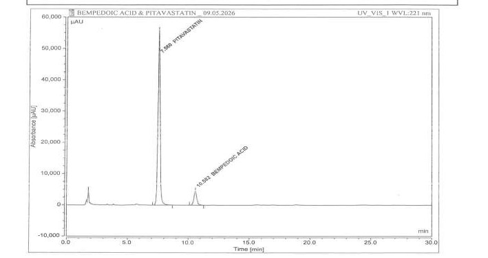
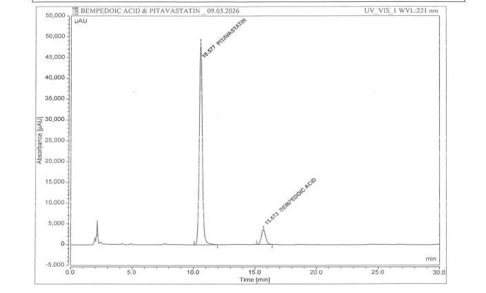
6.1.6 Robustness: The method robustness was evaluated by making minor deliberate changes in flow rate, mobile phase composition, and detection wavelength.
For this purpose, small changes were made in critical chromatographic conditions like flow rate, wavelength, proportion of mobile phase, and temperature. The %RSD was determined for all these varied conditions. The obtained results are presented in Table 5.8.
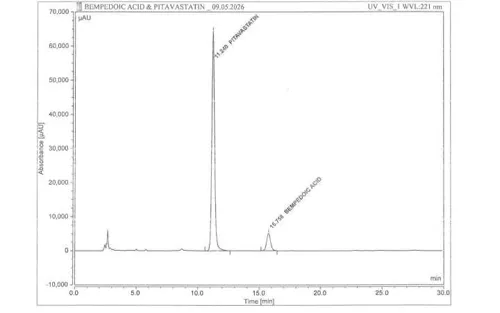
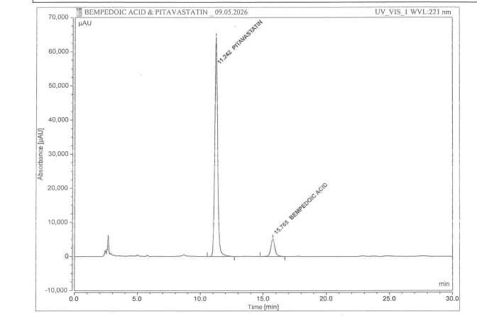
Chromatogram for Flow rate 0.8 mL/min-1 Chromatogram for Flow 0.8 mL/min-2
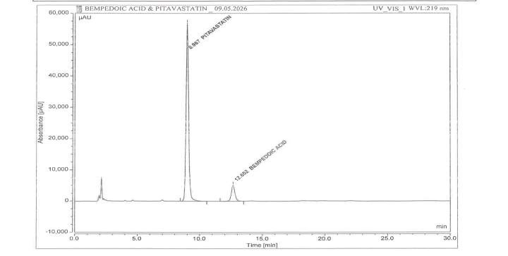
Chromatogram for WL 219 nm-1 Chromatogram for WL 219 nm-2
Chromatogram for WL 223 nm-1 Chromatogram for WL 223 nm-2
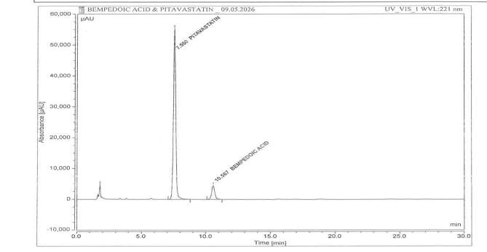
Chromatogram for Flow rate 1.2 mL/min-1 Chromatogram for Flow rate 1.2 mL/min-2
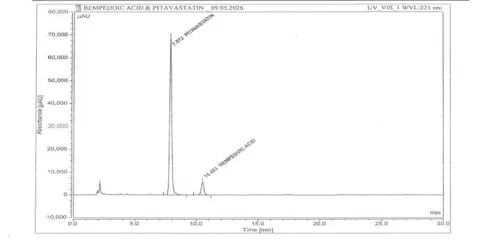
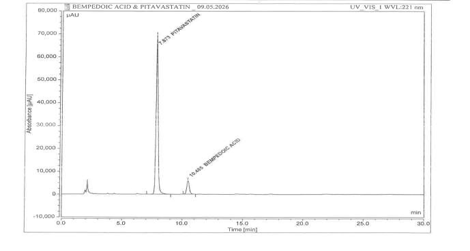
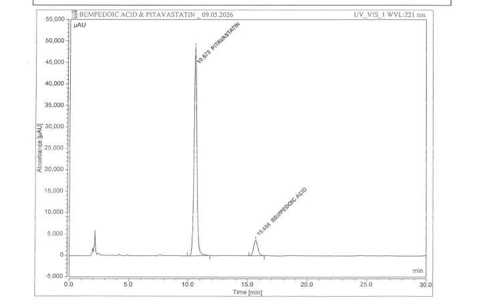
Chromatogram for Buffer 52.5% -1 Chromatogram for Buffer 52.5% -2
Chromatogram for Buffer 47.5% -1 Chromatogram for Buffer 47.5% -2
Fig 6.6: Robustness Chromatograms of Bempedoic acid and Pitavastatin calcium.
Table 6.6: Robustness assessment results for Bempedoic acid and Pitavastatin calcium
|
ROBUSTNESS FLOW RATE |
BPA Area |
BPA Rt |
PTV Area |
PTV Rt |
|
FLOW0.8ML/MMT-1 |
111438 |
15.758 |
1033521 |
11.240 |
|
FLOW0.8ML/MMT-2 |
114469 |
15.765 |
1033161 |
11.242 |
|
WL-219NM-1 |
101508 |
12.648 |
828344 |
8.993 |
|
WL-219NM-2 |
1O3137 |
12.652 |
830877 |
8.987 |
|
WL-223NM-1 |
82070 |
12.630 |
854012 |
8.962 |
|
WL-223NM-2 |
81730 |
12.625 |
852612 |
8.955 |
|
FLOW1.2ML/MIN-1 |
76374 |
10.582 |
689646 |
7.560 |
|
FLOW1.2ML/MIN-2 |
76167 |
10.567 |
691137 |
7.550 |
|
BUFFER 52.5%-1 |
86697 |
15.658 |
825948 |
10.572 |
|
BUFFER 52.5%-2 |
86419 |
15.673 |
827658 |
10.577 |
|
BUFFER 47.5%-1 |
91152 |
10.483 |
833325 |
7.872 |
|
BUFFER 47.5%-2 |
88358 |
10.485 |
832934 |
7.873 |
Results
The robustness study demonstrated that minor variations in flow rate, wavelength, and buffer conditions produced no significant changes in the analytical results. Therefore, the developed method was considered robust and reliable under tested conditions.
6.1.7 Degradation studies
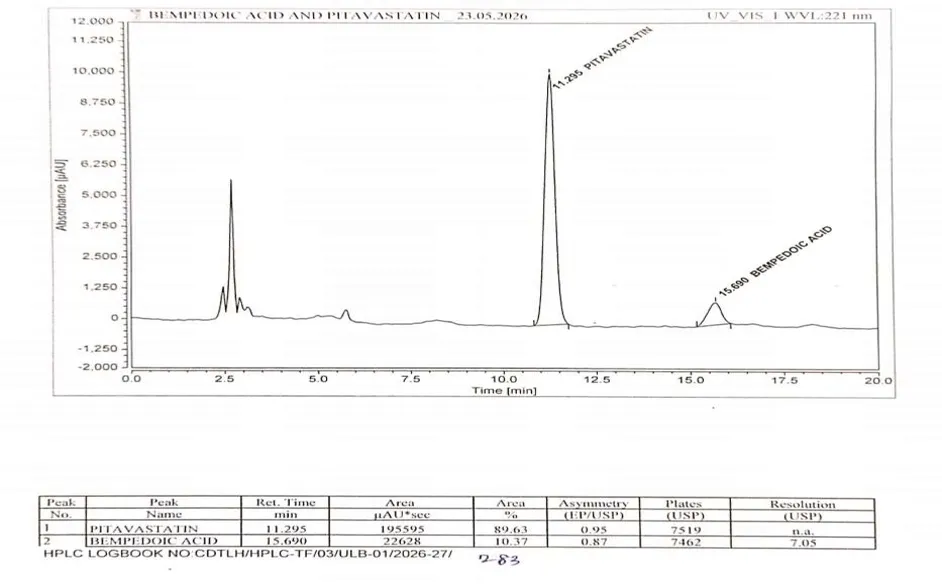
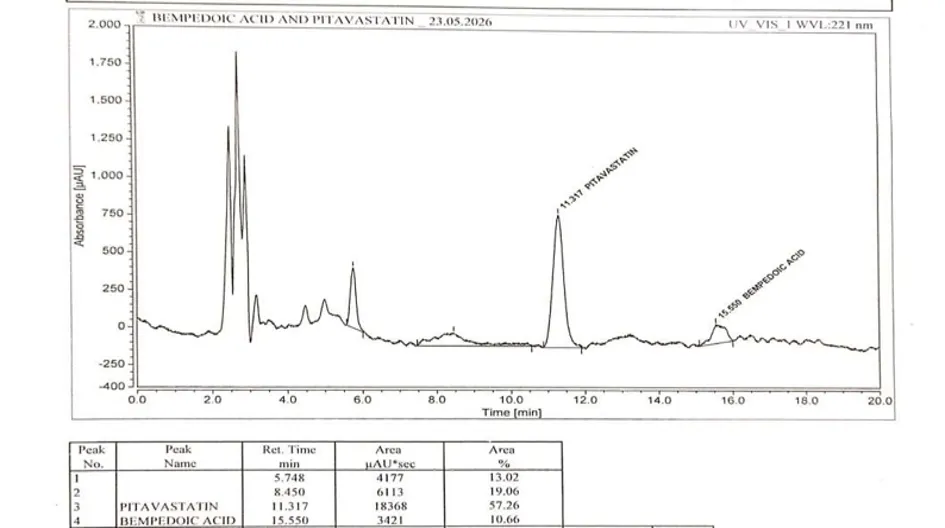
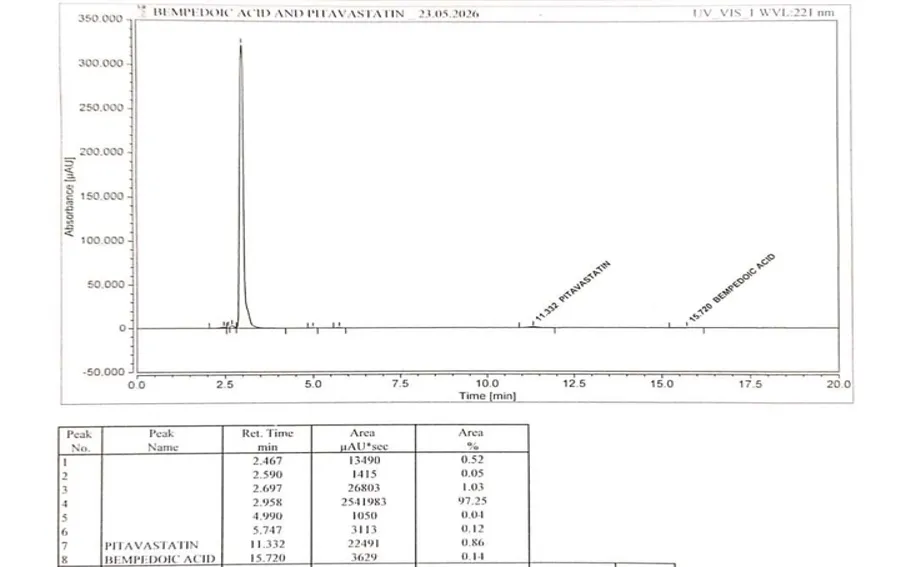
Degradation testing was performed to investigate the stability of Bempedoic acid and Pitavastatin calcium under various degradation conditions. The resulting samples were examined using the developed analytical method.
Photolytic Degradation - (254 nm, 1 day),
Thermal degradation – (105° C, 6 hours),
acid degradation – (0.1 N Hcl, 105° C, 6 hours),
base degradation-(0.1 N NaOH, 105° C, 6 hours),
peroxide degradation – (20% H2O2, 105° C, 6 hours)
Photolytic degradation chromatogram of bempedoic acid and Pitavastatin calcium
Thermal degradation chromatogram of bempedoic acid and Pitavastatin calcium
Acid degradation chromatogram of Bempedoic acid and Pitavasatin calcium
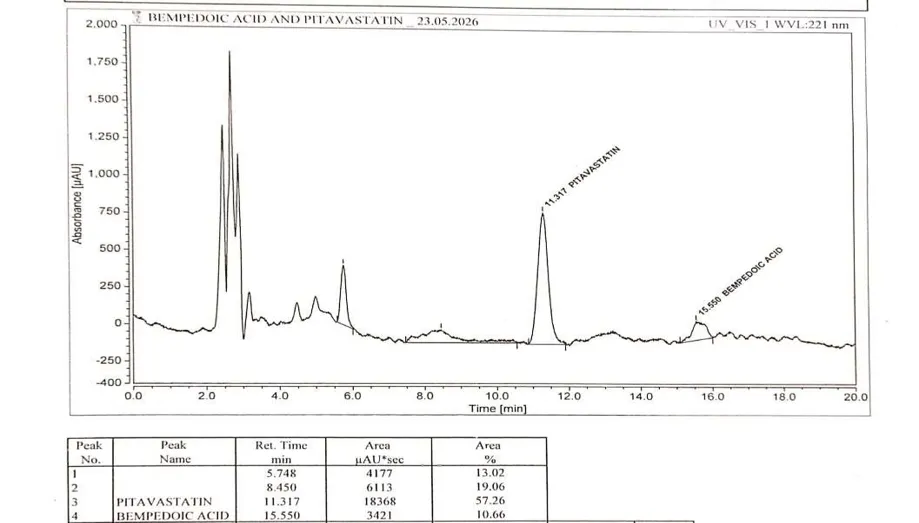
Base degradation chromatogram of Bempedoic acid and Pitavastatin calcium
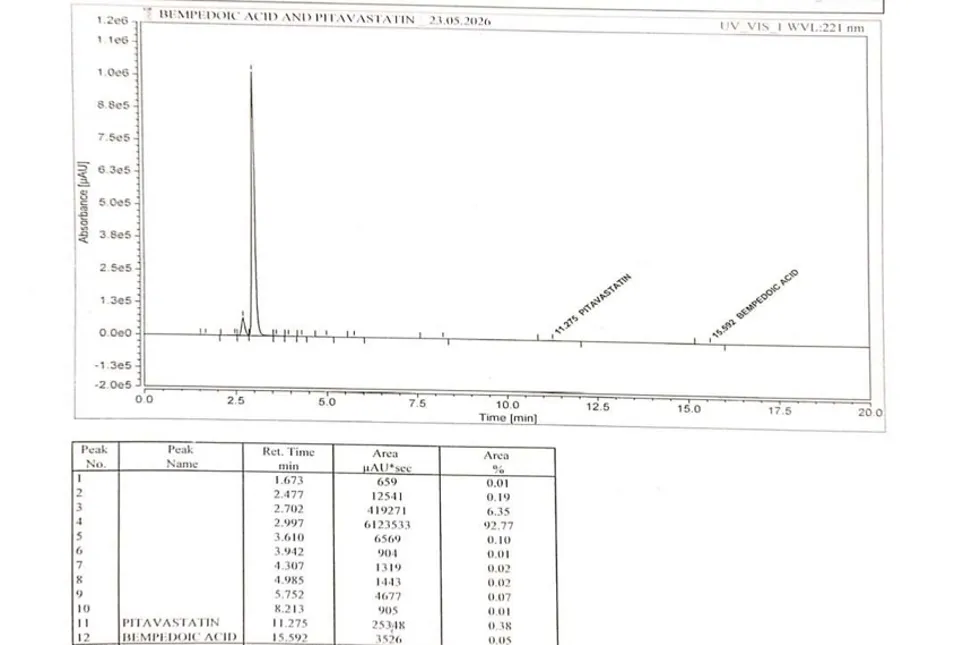
H2O2 degradation chromatogram of bempedoic acid and Pitavastatin calcium.
Fig 6.7: Degradation Chromatograms of Bempedoic acid and Pitavastatin calcium
Table 6.7: Forced-degradation study results for Bempedoic acid and Pitavastatin calcium
|
DEGRADATION STUDY |
BEMPEDOIC ACID |
PITAVASTATIN CALCIUM |
||
|
Area |
Rt |
Area |
Rt |
|
|
Photolytic Study |
22628 |
15.690 |
195595 |
11.295 |
|
Thermal Studies |
681423 |
15.875 |
119601 |
11.292 |
|
Acid Degradation |
3421 |
15.550 |
18368 |
57.26 |
|
Base Degradation |
3629 |
15.720 |
22491 |
11.332 |
|
H₂O₂ Degradation |
3526 |
15.592 |
25348 |
11.275 |
7. SUMMARY OF ANALYTICAL METHOD VALIDATION
Table 7.1: Summary Table
|
Validation parameter |
Observed results |
Acceptance criterion |
|
|
Linearity interval (µg/mL) |
BPA:72 -360 µg/mL and PTV:4 -20 µg/mL |
Correlation coefficient (R) ˂ 1* |
|
|
correlation coefficient (R) |
0.999 |
||
|
Regression Slope (m) |
6733.8 |
||
|
Regression intercept (c) |
961.27 |
||
|
Linearity Regression equation (Y=mx + c) |
y = 164756x +18161x |
||
|
Assay (% mean assay) |
99.68%. |
90-110% |
|
|
System precision (%RSD) |
0.3 |
NMT 2.0% |
|
|
Method precision (%RSD) |
0.2 |
NMT 2.0% |
|
|
Accuracy (%recovery) |
99.44% |
98-102% |
|
|
LOD |
BPA:10.44807 µg/mL, PTV:10.43564 µg/mL |
NMT 3 |
|
|
LOQ |
BPA:31.6608 µg/mL, PTV:31.62314 µg/ML. |
NMT 10 |
|
|
Robustness |
FM |
0.1 |
%RSD NMT 2.0 |
|
FP |
0.2 |
||
|
MM |
0.4 |
||
|
MP |
0.3 |
||
|
TM |
0.9 |
||
|
TP |
0.4 |
||
8. CONCLUSION
A reliable RP-UPLC method was developed for the simultaneous estimation of Bempedoic acid and Pitavastatin calcium using a C18 column. Chromatographic separation was achieved with potassium dihydrogen phosphate buffer and acetonitrile (50:50, v/v) at 1.0 mL/min, with detection at 221 nm. The optimized conditions resulted in satisfactory of both analytes.
The method met the system suitability requirements and exhibited good linearity (R2 =0.999). The %RSD values for repeatability and intermediate precision were 0.2% and 0.5%, respectively. LOD values were 10.44807 and 10.43563, while LOQ values were 31.6608 and 31.62313 for the respective analytes. The assay of the marketed formulation showed 99.68% drug content. The developed method provided reduced retention and analysis times for Bempedoic acid and Pitavastatin calcium. Consequently, the procedure offe2rs advantages such as simplicity, reduced analytical cost, and lower time requirements.
The validated method offered efficient analysis with reduced retention time and was suitable for routine quality- control testing. All elevated validation parameters complied with the application ICH requirements.
REFERENCES



G. Sowmya, Dr. S. Shobha Rani, K. Nithin Kumar, Simultaneous Estimation of Bempedoic Acid and Pitavastatin Calcium in Bulk Drug by RP-UPLC, Int. J. of Pharm. Sci., 2026, Vol 4, Issue 10, 849-878. https://doi.org/10.5281/zenodo.23191380
 10.5281/zenodo.23191380