
We use cookies to ensure our website works properly and to personalise your experience. Cookies policy
Department of Pharmaceutical Analysis, College of Pharmaceutical Sciences, Govt. Medical College Trivandrum, Kerala, India
A straightforward, fast, accurate, and eco-friendly RP-HPLC method was developed and validated for measuring empagliflozin (EMPA) and/or dapagliflozin (DAPA) in a synthetic mixture. Separation was achieved on a Purospher STAR RP-18e (5 µm) column using an optimised mobile phase of acetonitrile and water (40:60 v/v) under isocratic conditions. The flow rate was set at 1.0 mL/min, with UV detection at 229 nm. EMPA and DAPA's retention times were 3.6 and 5.8 minutes, respectively. The method was validated per ICH guidelines for specificity, linearity, accuracy, precision, LOD, and LOQ. It demonstrated excellent linearity (R2 > 0.9999) over 0.1?20 µg/mL for both analytes, with good recovery and precision. The environmental friendliness of the RP-HPLC method was confirmed using the AGREE metric, highlighting its sustainability. This method is suitable for routine quality control of EMPA and/or DAPA.
Diabetes mellitus is a significant metabolic disorder impacting millions globally. The 2025 International Diabetes Federation (IDF) Diabetes Atlas states that 11.1%—or 1 in 9—adults aged 20-79 live with diabetes, with over 40% unaware of their condition. The rising prevalence over recent decades has created a substantial global health burden, with notable morbidity and mortality. While lifestyle changes can improve glycemic control, long-term medication use is often necessary for effective management. Various anti-diabetic drugs are employed for type 2 diabetes treatment, including bile acid sequestrants, dopamine agonists, sulfonylureas, meglitinides, metformin (biguanide), thiazolidinediones, SGLT2 inhibitors, oral GLP-1 receptor agonists, alpha-glucosidase inhibitors, and DPP-IV inhibitors.(3).
SGLT2 inhibitors reduce renal glucose reabsorption in proximal nephrons, creating a negative energy balance by enhancing urinary glucose excretion.(4) Among the SGLT2 inhibitors, empagliflozin ((1S)-1,5-anhydro-1-(4-chloro-3-{4-[(3S)-tetrahydrofuran-3-yloxy]benzyl}phenyl)-D-glucitol)(5) and dapagliflozin ( (2S,3R,4R,5S,6R)-2-[4-chloro-3-[(4-ethoxyphenyl)methyl]phenyl]-6-(hydroxymethyl)oxane-3,4,5-triol)(6) have emerged as important therapeutic agents owing to their proven efficacy in the management of type 2 diabetes mellitus and their beneficial cardiovascular and renal effects(7). They have relatively low aqueous solubility but are freely soluble in organic solvents, such as methanol and acetonitrile.(5,6).
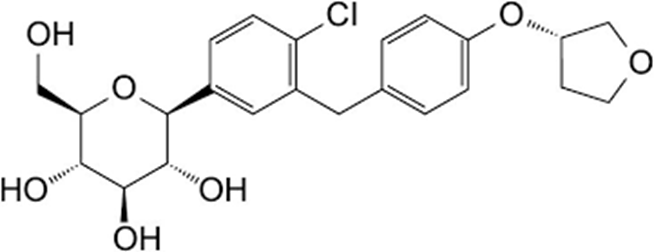
Figure no. 1: Molecular structure of empagliflozin
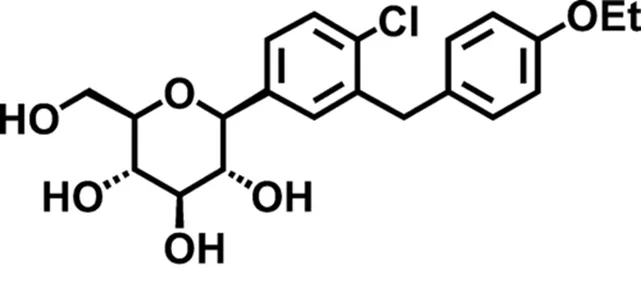
Figure no. 2: Molecular structure of dapagliflozin
An extensive review of the published literature indicated that a few chromatographic methods have been reported for the estimation of these drugs individually or in combination with drugs like metformin, linagliptin, etc. To the best of our knowledge, only one RP-HPLC method has been reported for the quantification of EMPA and DAPA in combination.(7). The present study aimed to develop and validate a novel isocratic RP-HPLC method for the estimation of EMPA and /or DAPA in synthetic mixtures. The method was designed with modified chromatographic conditions to simplify the analytical procedure by avoiding the use of buffer salts, pH adjustments and gradient elution while maintaining satisfactory analytical performance.(7). In accordance with the principles of Green Analytical Chemistry, the organic solvent content was kept to a minimum through the use of a low-acetonitrile, buffer-free mobile phase, thereby reducing the solvent consumption, operational cost, chemical waste generation and environmental impact.(7). The environmental sustainability of the developed method was subsequently evaluated using the Analytical GREEness (AGREE) metric tool.(8). Furthermore, the developed method was more sensitive compared to the published method and hence has the potential to be adapted for bioanalysis of EMPA using DAPA as internal standard or vice versa, thereby facilitating pharmacokinetic, bioequivalence and therapeutic drug monitoring (TDM) studies.
2.1 Chemicals and Reagents
Pharmaceutically pure reference standards of EMPA and DAPA were obtained from pharmaceutical companies as gift samples.
HPLC-grade acetonitrile, methanol and purified water were used throughout the study.
2.2. Instrumentation and chromatographic conditions
The analysis was performed using a Shimadzu LC2010AHT system with a quaternary solvent delivery pump, an autosampler, Purospher STAR RP-18e (5µm) column as the stationary phase and a UV-Visible detector. Data acquisition, instrument control and chromatographic processing were performed using LC solution software.
Different chromatographic conditions were investigated:
• Mobile phase compositions (ACN: Water 20:80 to 40:60 v/v)
• Flow rates (0.8–1.2 mL/min)
• Detection wavelengths (225–240 nm)
• Column temperatures (25–35°C)
The optimised conditions were selected based on retention time, resolution, tailing factor and theoretical plates.
2.3. Preparation of Standard Solutions
Standard stock solution: Stock standard solutions for EMPA and DAPA (1000 μg/mL) were prepared by accurately weighing 5.0 mg of both APIs and dissolving them by using methanol in two 5mL microcentrifuge tubes.
Working Standard solution: The stock solution was diluted with methanol to obtain working standard concentrations of 0.1- 20μg/mL for both EMPA and/or DAPA. All solutions were stored in a refrigerator at 4 °C.
2.4 Method Validation
Validation was performed according to ICH Q2(R2) guidelines.
3.1 Method Optimisation
Method optimisation was performed to develop a simple and reliable RP-HPLC method for the estimation of EMPA and DAPA. Different chromatographic parameters, including column type, mobile phase composition, flow rate and detection wavelength, were evaluated. The optimised conditions produced well-resolved, symmetrical peaks with satisfactory system suitability parameters and were selected for method validation(7).
3.2 Column Selection
Different reversed-phase columns were tested to achieve efficient separation of the analytes. Among the columns evaluated, the Purospher STAR RP-18e (5µm) column provided sharp peaks, good resolution and acceptable retention times. It was selected for further studies.
3.3 Mobile phase optimisation
Various ratios of acetonitrile and water were investigated during mobile phase optimisation. A mixture of acetonitrile and water (40:60 v/v) provided well-defined, narrow peaks with good peak symmetry and resolution. The optimised method employed a flow rate of 1.0 mL/min. and a detection wavelength of 229 nm, resulting in satisfactory chromatographic performance.
3.4 Method validation
3.4.1. Linearity and range
Linearity was appraised over the concentration range of 0.1–20 µg/mL for both EMPA and/or DAPA. Calibration curves were constructed by plotting peak area against concentration. The developed method exhibited excellent linearity throughout the studied concentration range.
Table No. 1. Linearity Data
|
Concentration (µg/mL) |
EMPA Area of peak |
DAPA Area of peak |
|
0.1 |
3513 |
1274 |
|
1.0 |
37751 |
9219 |
|
5.0 |
195219 |
48257 |
|
7.5 |
298519 |
72950 |
|
10 |
403262 |
97861 |
|
20 |
804424 |
193933 |
The regression equation obtained for EMPA was:
y = 40351.6x – 2773.34
with a correlation coefficient (R²) of 0.9999.
The regression equation obtained for DAPA was:
y = 9711.05x + 15.36
with a correlation coefficient (R²) of 0.9999.
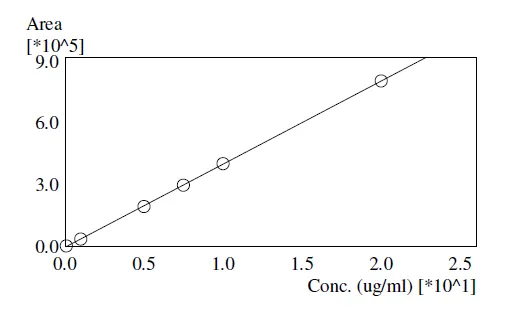
Fig. no. 3 Calibration plot of EMPA
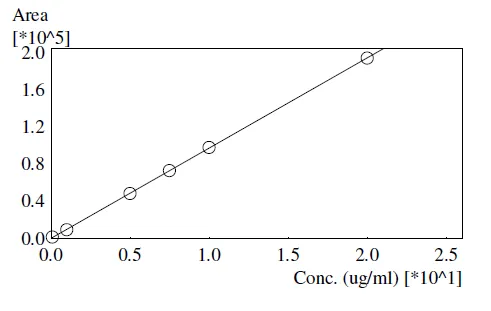
Fig. no. 4 Calibration plot of DAPA
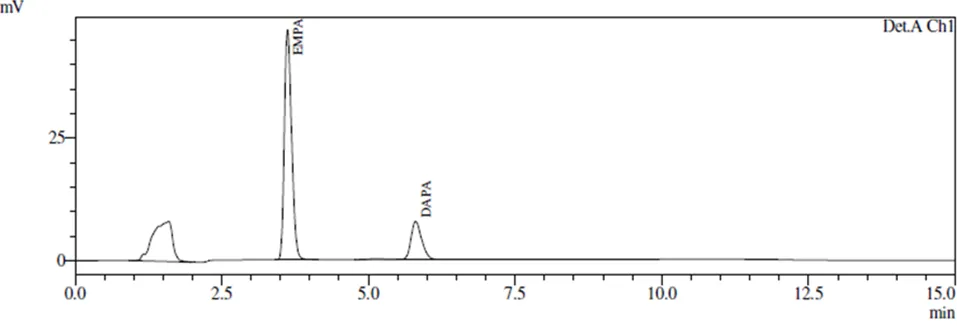
Figure no. 5. Representative chromatogram of solution in MeOH containing EMPA (3.6 min) and DAPA (5.8 min) at a concentration 10.0μg/mL each.
The high correlation coefficients indicate an excellent linear relationship between concentration and detector response for both analytes. The low deviation from the regression line and consistent increase in peak area with concentration indicated the reliability of the proposed method. These results demonstrate the suitability of the developed RP-HPLC method for the estimation of EMPA and/or DAPA in pharmaceutical formulations. The high sensitivity down to 0.1μg/mL shows that the method can be extended to quantify the analytes in biological fluids as well.
3.4.2 Sensitivity (LOD and LOQ)
LOD and LOQ for both EMPA and DAPA were evaluated by using the equations
LOD = 3.3xSD/a and LOQ = 10xSD/a, where SD is the standard deviation of the areas of the first calibrator, and a is the slope of the relevant calibration curve.
Table No. 2 Limit Of Detection (Lod) And Limit Of Quantitation (Loq)
|
Analyte |
Standard deviation (Σ) |
Slope (S) |
LOD (µg/mL) |
LOQ (µg/mL) |
|
EMPA |
24.72 |
40351.6 |
0.0020 |
0.0061 |
|
DAPA |
11.9443 |
9711.05 |
0.0040 |
0.0122 |
The low values obtained for LOD and LOQ indicated that the proposed method possesses adequate sensitivity for the detection of EMPA and DAPA at low concentration levels. The results demonstrated the suitability of the method for routine quantitative analysis.
3.4.3 Accuracy
Accuracy refers to the degree of agreement between the experimentally measured value and the reference value or true value(9). In the present study, accuracy was evaluated by the standard addition method in accordance with ICH guidelines. A sample solution containing 10µg/mL of EMPA and DAPA was used for the study. Known amounts of standard drug corresponding to 80%, 100% and 120% levels (8,10 and 12µg/mL) were added to the sample solution, giving total concentrations of 18, 20 and 22µg/mL, respectively.
Table No. 3 Accuracy (Recovery Study)
|
Analyte |
Recovery level |
Amount added (µg/mL) |
Total expected concentration (µg/mL) |
Amount found (µg/mL) |
Recovery (%) |
Mean % Recovery |
|
EMPA |
80% |
8 |
18 |
17.87 |
99.27 |
99.82±0.52 |
|
100% |
10 |
20 |
20.062 |
100.31 |
||
|
120% |
12 |
22 |
21.975 |
99.88 |
||
|
DAPA |
80% |
8 |
18 |
18.094 |
100.52 |
100.67±0.38 |
|
100% |
10 |
20 |
20.076 |
100.38 |
||
|
120% |
12 |
22 |
22.245 |
101.11 |
The prepared solutions were analysed using the developed chromatographic conditions, and the percentage recovery was calculated. The recovery values were close to 100%, indicating that the method is accurate and free from interference by excipients. The mean recovery for EMPA is found to be 99.82±0.52 and for DAPA 100.67±0.38, which is within the acceptable limits of 98-102% (9)confirming the suitability of the method.
3.4.4 Precision
“The precision of an analytical procedure reveals the closeness of agreement (degree of scatter) between a series of measurements obtained from multiple samplings of the same homogeneous sample under the prescribed conditions”(9). The precision was evaluated in terms of repeatability (intra-day precision) by analysing six replicate injections of a mixed standard solution containing 10µg/mL each of empagliflozin and/or dapagliflozin under the optimised chromatographic conditions. The peak areas obtained for each injection were recorded and subjected to statistical analysis. Precision was expressed as a percentage relative standard deviation (%RSD) of the peak areas.
Table No. 4 Results Of Precision For Empa And Dapa
|
Analyte |
Mean area |
SD |
%RSD |
|
EMPA |
404958 |
3590.54 |
0.8866 |
|
DAPA |
97493.5 |
439.76 |
0.451 |
The percentage relative standard deviation (%RSD) values obtained for EMPA and DAPA were found to be within the acceptable limit of 2.0%, indicating good repeatability of the developed method. The low %RSD values demonstrate that the method provides consistent and reproducible results upon repeated analysis of the same sample under identical conditions. Hence, the proposed RP-HPLC method was found to be precise and suitable for routine quantitative estimation of EMPA and/or DAPA.
Greenness Assessment
After the development and validation, the proposed method was evaluated using the AGREE metric tool.(8). This tool evaluates compliance with the twelve principles of Green Analytical Chemistry and expresses the overall environmental performance as a score between 0 and 1, and is represented by a coloured segment in a circular pictogram, where red indicates poor compliance, yellow indicates intermediate and green indicates excellent compliance. The overall AGREE score displayed in the centre represents the greenness of the method, and the value closer to one indicates a greener analytical method. The obtained AGREE score of the current method is 0.73 (Figure no. 6)(10)This indicates the proposed method is green. This result is mainly attributed to the reduced consumption of organic solvents and elimination of buffer salts from the mobile phase. The AGREE pictogram showed satisfactory compliance with most of the principles of Green Analytical Chemistry, supporting the suitability of the proposed method as a greener alternative for the analysis of EMPA and/or DAPA.
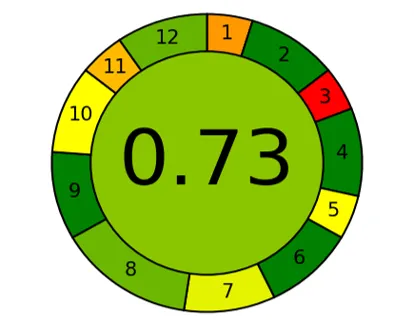
Figure no. 6: Greenness result for the proposed method by the AGREE metric tool
CONCLUSION
A simple, rapid, accurate, precise and eco-friendly RP-HPLC method was successfully developed and validated for the estimation of EMPA and/or DAPA. Chromatographic separation was achieved using a Purospher STAR RP-18e column with a mobile phase consisting of acetonitrile and water (40:60 v/v) at a flow rate of 1.0mL/min. and detection was carried out at 229nm. The developed method exhibited satisfactory chromatographic performance with well-resolved peaks and acceptable retention times for both analytes. Validation studies demonstrated excellent linearity over the concentration range of 0.1-20µg/mL, along with satisfactory accuracy, precision and sensitivity in accordance with ICH guidelines. Moreover, the developed method exhibited good environmental sustainability as demonstrated by its AGREE score. Therefore, the proposed method can be effectively employed for routine quality control and quantitative analysis of EMPA and/or DAPA in bulk and may also be adapted for the bioanalysis of both drugs.
REFERENCES

Anjana B. B.*, Haripriya M., Development, validation and greenness assessment of an RP-HPLC method for the determination of Empagliflozin and Dapagliflozin, Int. J. of Pharm. Sci., 2026, Vol 4, Issue 6, 5115-5121. https://doi.org/10.5281/zenodo.20763732
 10.5281/zenodo.20763732