

We use cookies to ensure our website works properly and to personalise your experience. Cookies policy
1Department of genetics and molecular medicine, manipal trutest labs, hyderabad
Aim and Scope: This study aimed to characterize the distribution of major CYP2C19 alleles (*1, *2, *3, and *17) and their predicted metabolizer phenotypes in a clinical cohort from Telangana, South India, to establish a baseline for regional population pharmacogenomics and personalized medicine. Background: Cytochrome P450 2C19 (CYP2C19) metabolizes clinically vital therapeutics, including antiplatelet agents (clopidogrel) and proton pump inhibitors. Genetic polymorphisms alter enzyme activity, leading to substantial interindividual variation in drug response. Because allele frequencies exhibit geographic heterogeneity, population-specific data are essential for clinical implementation. Materials and Methods: In a retrospective study evaluating 275 individuals in Hyderabad, South India, genomic DNA was extracted from whole blood. Genotyping for CYP2C19*2, *3, and *17 was performed using TaqMan probe-based real-time PCR. Hardy–Weinberg equilibrium (HWE) was assessed using exact and chi-square tests, and diplotypes were mapped to predicted metabolizer phenotypes. Results: Across 550 alleles, the wild-type *1 allele was predominant (65.09%), followed by *2 (18.00%), *17 (16.55%), and *3 (0.36%). Observed genotype distributions complied with HWE (p = 1). Phenotype mapping revealed 45.5% Normal Metabolizers (*1/*1), 36 % Intermediate Metabolizers (*1/*2, *1/*3, *2/*17), 18.18% Rapid Metabolizers (*1/*17), and 0.36% Poor Metabolizers (*2/*2). Conclusion: Over half of the cohort (54.55%) carried actionable non-normal metabolizer phenotypes. The high combined prevalence of intermediate and rapid metabolizers underscores the utility of genotype-guided therapy for antiplatelet and acid-suppressive regimens in regional South Indian clinical practice.
Pharmacogenomics investigates the influence of genetic variation on drug disposition, therapeutic response, and adverse drug reactions, providing a molecular basis for precision pharmacotherapy [1]. Genetic polymorphisms in drug-metabolising enzymes can alter enzyme activity, thereby producing substantial interindividual variability in drug exposure and clinical response [2].
Cytochrome P450 2C19 (CYP2C19) is a clinically important drug-metabolising enzyme involved in the biotransformation of several widely prescribed therapeutic agents, including clopidogrel, proton pump inhibitors, and selected antidepressants [2,3]. CYP2C19 exhibits extensive genetic polymorphism, resulting in functional variability in enzyme activity among individuals. The major pharmacogenetically relevant alleles include CYP2C19*1, *2, *3, and *17. The *1 allele is associated with normal enzyme function, whereas *2 and *3 are predominantly loss-of-function alleles. In contrast, *17 is associated with increased transcription and enhanced enzymatic activity [3,4].
CYP2C19 diplotypes can be mapped to predicted metabolizer phenotypes, including poor, intermediate, normal, rapid, and ultrarapid. These phenotypic differences have important pharmacokinetic and pharmacodynamic consequences and may influence drug efficacy and toxicity. The clinical relevance of CYP2C19 variation is particularly well established for clopidogrel, a prodrug requiring CYP-mediated bioactivation. Carriers of CYP2C19 loss-of-function alleles may exhibit reduced formation of the active metabolite and attenuated platelet inhibition. Accordingly, CPIC recommends CYP2C19 genotype-guided selection of antiplatelet therapy, particularly in intermediate and poor metabolizers [3].
CYP2C19 genotype also influences the pharmacokinetics of proton pump inhibitors (PPIs). Increased CYP2C19 activity can result in lower systemic exposure, whereas reduced activity may increase drug exposure and prolong pharmacological effects. Consequently, genotype-guided PPI dosing has also been incorporated into pharmacogenomic clinical guidelines [5].
The distribution of CYP2C19 alleles is heterogeneous across global populations, with substantial differences in the frequencies of normal-, loss-, and increased-function variants [3.4]. Population-specific allele-frequency data are therefore essential for estimating the potential distribution of CYP2C19 metabolizer phenotypes and evaluating the relevance of pharmacogenomic implementation within specific populations.
India represents a genetically heterogeneous population, and regional differences in pharmacogenetic profiles have been reported. Studies conducted in South Indian populations have demonstrated substantial frequencies of CYP2C19*2 and variable distributions of CYP2C19*3 and *17 [6,7]. Jose et al. reported CYP2C19*1, *2, and *3 frequencies of approximately 64%, 35%, and 1%, respectively, in a South Indian population [6]. Other investigations have demonstrated considerable variation in CYP2C19*17 frequencies among Indian populations, further supporting the importance of population-specific pharmacogenomic characterization [7]. Such regional variation limits the appropriateness of extrapolating pharmacogenomic estimates derived from one Indian population to another.
Telangana, a geographically and demographically distinct region of South India, represents an important population for regional pharmacogenomic characterization. Although CYP2C19 variation has been investigated in Indian and South Indian populations, comprehensive regional datasets remain valuable for defining allele and genotype distributions and for comparison with other Indian populations [6,8]. Establishing such data may contribute to population pharmacogenomics and provide a baseline for future studies examining genotype–phenotype associations and genotype-guided pharmacotherapy.
Therefore, the present study aimed to characterize the distribution of common CYP2C19 alleles and genotypes among individuals from Telangana, South India, with particular emphasis on CYP2C19*1, *2, *3, and *17 and their potential pharmacogenomic relevance.
MATERIALS AND METHODS
Study Design and Patient Cohort
This retrospective observational study evaluated genomic profiles from 275 individuals in Hyderabad, South India (2024–2026). Diagnostic testing was performed at Manipal TRUtest Laboratories (Hyderabad, India) following physician referrals for clinical pharmacogenomic profiling to optimize therapeutic dosing.
Genomic DNA Extraction and Quantification
Genomic DNA (gDNA) was isolated from peripheral whole blood using a standard silica spin-column or automated nucleic acid extraction platform. To eliminate residual wash buffer ethanol, a dry centrifugation step (17,000 × g for 3 min) was performed prior to elution. DNA concentration and purity were quantified using a Qubit fluorometer, and samples were normalized to >5 ng/µL for downstream PCR amplification.
Allele-Specific Real-Time PCR Genotyping
Genotyping for CYP2C19*2 (681G>A), CYP2C19*3 (636G>A), and CYP2C19*17 (-806C>T) star alleles was conducted via TaqMan probe–based real-time PCR using the HELINI CYP2C19 Real-time PCR Kit (HELINI Biomolecules, Chennai, India). Each specimen was analyzed across six reaction wells assessing wild-type (W) and mutant (M) alleles for each locus (2W, 2M, 3W, 3M, 17W, and 17M).
Reaction Formulations and Thermal Cycling
Reactions (25 µL total) contained 10 µL Probe PCR Master Mix, 5 µL locus-specific primer/probe mix, and 10 µL normalized gDNA (>5 ng/µL). No Template Controls (NTC) and Positive Controls were run in parallel. Thermocycling (FAM channel, no passive reference) comprised enzyme activation at 95°C for 15 min (1 cycle), followed by 35 cycles of denaturation at 95°C for 20 s, annealing/fluorescence acquisition at 60°C for 20 s, and extension at 72°C for 20 s.
Allelic Calling and Statistical Evaluation
Allelic discrimination was based on real-time fluorescence during annealing: single-channel signal indicated homozygosity (wild-type or mutant), whereas dual-channel signal indicated heterozygosity. Allele, genotype, and phenotype frequencies were cross-tabulated by sex. Hardy–Weinberg Equilibrium (HWE) was evaluated using Pepkio Tools (HWE Equilibrium Studio) via Chi-square (df = 6) and exact tests, with p > 0.05 denoting HWE compliance.
Results
Allele Frequencies and Distribution
A total of 550 alleles were analyzed across the study population (N = 275 individuals). Four distinct alleles were identified: *1, *2, *17, and *3. The wild-type *1 allele was the most prevalent, accounting for 65.09% of all alleles (n = 358; frequency = 0.6509). The variant alleles *2 and *17 demonstrated frequencies of 18.00% (n = 99; frequency = 0.1800) and 16.55% (n = 91; frequency = 0.1655), respectively. The *3 allele was rare in the study population, representing only 0.36% of total alleles (n = 2; frequency = 0.0036). Detailed allele distributions and frequencies are summarized in Table 1and Figure 1.
Table 1. Distribution of alleles in the study population (N = 275, total allele count = 550)
|
Allele |
Total Allele Count (n) |
Allele Frequency |
Percentage (%) |
|
*1 |
358 |
0.6509 |
65.09% |
|
*2 |
99 |
0.1800 |
18.00% |
|
*17 |
91 |
0.1655 |
16.55% |
|
*3 |
2 |
0.0036 |
0.36% |
|
Total |
550 |
1.0000 |
100.00% |
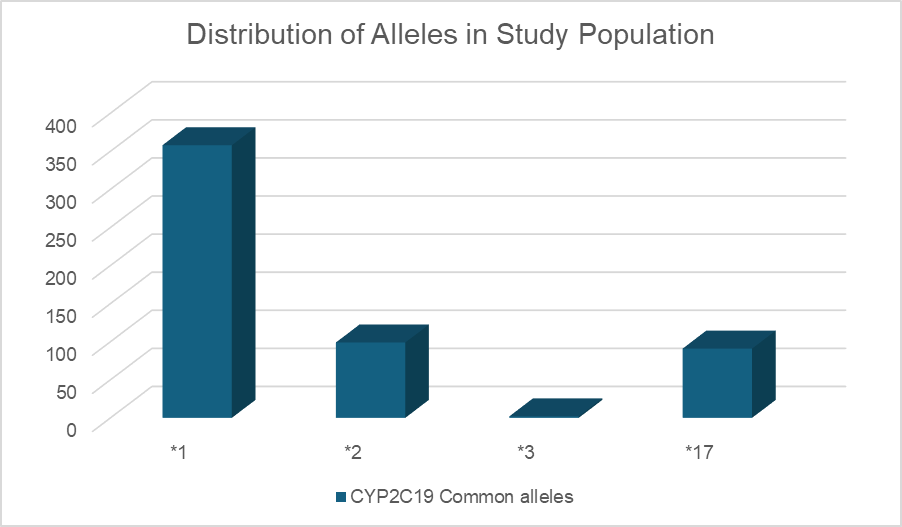
Figure 1: Frequency distribution of CYP2C19 Common Alleles
Hardy–Weinberg Equilibrium (HWE) Analysis
Genotype equilibrium testing across all detected combinations (N = 275) yielded a chi-square statistic of 55.7874 (df = 6). Based on the primary exact test for Hardy–Weinberg Equilibrium (p_exact = 1.00), the observed genotype frequencies were consistent with Hardy–Weinberg equilibrium, indicating no statistically significant deviation between the observed and expected genotype distributions (p > 0.05; F-statistic = -0.04896).
The wild-type homozygous genotype *1/*1 was the most frequent observed genotype n = 125, (45.45%). Heterozygous carriers of *1/*2, *1/*3, *1/*17, and *2/*17 accounted for n = 56 (20.36%), n = 2 (0.7%), n = 50 (18.18%), and n = 41 (14.91%) of subjects, respectively. Homozygous variants for *2/*2 were rare (n = 1, 0.36%), and no individuals carried the *3/*3, *3/*17, *2/*3, or *17/*17 genotypes in the analysed cohort. Full details on observed versus expected genotype distributions and residual values are presented in Table 2.
Table 2. Observed versus expected genotype frequencies and Hardy–Weinberg equilibrium analysis
|
Genotype |
Observed (n) |
Expected (n) |
Observed Freq. |
Expected Freq. |
Residual |
|
*1/*1 |
125 |
116.51 |
0.4545 |
0.4237 |
+8.49 |
|
*1/*2 |
56 |
64.44 |
0.2036 |
0.2343 |
-8.44 |
|
*1/*3 |
2 |
1.30 |
0.0073 |
0.0047 |
+0.70 |
|
*1/*17 |
50 |
59.23 |
0.1818 |
0.2154 |
-9.23 |
|
*2/*2 |
1 |
8.91 |
0.0036 |
0.0324 |
-7.91 |
|
*2/*3 |
0 |
0.36 |
0.0000 |
0.0013 |
-0.36 |
|
*2/*17 |
41 |
16.38 |
0.1491 |
0.0596 |
+24.62 |
|
*3/*3 |
0 |
0.00 |
0.0000 |
0.0000 |
0.00 |
|
*3/*17 |
0 |
0.33 |
0.0000 |
0.0012 |
-0.33 |
|
*17/*17 |
0 |
7.53 |
0.0000 |
0.0274 |
-7.53 |
|
Total |
275 |
275.00 |
1.0000 |
1.0000 |
— |
Note: Primary statistical evaluation performed via exact test (p_exact = 1.00, F = -0.04896).
Genotype and Predicted Metabolizer Phenotypes
Subjects were categorized into four metabolizer phenotypes (N = 275): Normal (*1/*1; n = 125, 45.45%; 117 males [42.45%], 8 females [2.90%]), Intermediate (*1/*2, *1/*3, *2/*17; n = 99, 36.00%; 95 males [34.50%], 4 females [1.45%]), Rapid (*1/*17; n = 50, 18.18%; 44 males [16.00%], 6 females [2.18%]), and Poor (*2/*2); n = 1, 0.36%; 1 male [0.36%] Overall, the population comprised 257 males (93.45%) and 18 females (6.55%), details presented in Table 3 and figure 2.
Table 3. Frequency of genotypes and predicted metabolizer phenotypes stratified by sex
|
Metabolizer Phenotype |
Assigned Genotypes |
Males (n, %) |
Females (n, %) |
Total Cohort (n, %) |
|
Normal |
*1/*1 |
117 (42.5 %) |
8 (2.9 %) |
125 (45.45%) |
|
Intermediate |
*1/*2, *1/*3, *2/*17 |
95 (34.5 %) |
4 (1.45 %) |
99 (36.00%) |
|
Rapid |
*1/*17 |
44 (16 %) |
6 (2.18 %) |
50 (18.18%) |
|
Poor |
*2/*2 |
1 (0.36 %) |
0 (0 %) |
1 (0.36%) |
|
Total |
— |
257 (93.45%) |
18 (6.55%) |
275 (100.00%) |
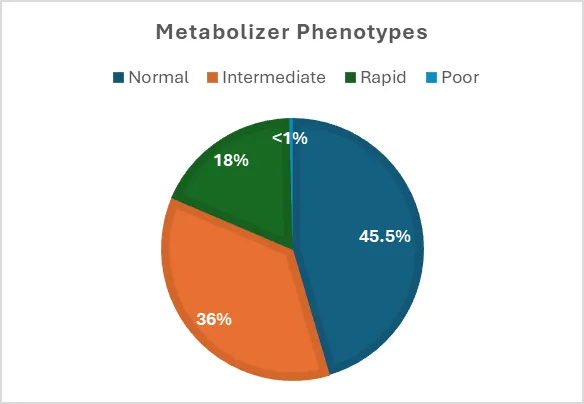
Figure 2: Percentage distribution of metabolizer phenotypes in Total Populations
Discussion
Pharmacogenomics investigates how genetic variation influences drug disposition, clinical efficacy, and toxicity [9]. This study provides a comprehensive regional characterization of common CYP2C19 common alleles (*1, *2, *3, and *17) and their predicted metabolizer phenotypes within a cohort from Telangana, South India. Over half of the evaluated cohort (54.55%) harbored at least one variant allele altering baseline enzyme activity, underscoring significant potential for interindividual variability in drug clearance across this regional population [10].
Comparison of Allele Distributions with Regional and Global Populations
The wild-type CYP2C19*1 allele was predominant at 65.09%. The loss-of-function *2 allele was observed at 18.00%, consistent with reports across South Indian and broader Indian cohorts showing significant loss-of-function frequencies [6,12,13]. While Jose et al. reported a higher *2 frequency (~35%) alongside *1 (64%) and *3 (1%) in a distinct South Indian population [6], our findings demonstrate a comparable wild-type frequency while highlighting subtle regional variations in variant allele distribution [12,13]. Notably, the *3 allele was exceedingly rare at 0.36%, corroborating previous findings that *3 contributes minimally to the poor-metabolizer phenotype in Indian populations relative to East Asian populations [6,12].
Interest in the gain-of-function CYP2C19*17 allele stems from its role in rapid drug clearance [11]. In our Telangana cohort, *17 demonstrated a frequency of 16.55%. This aligns with reported frequencies across South Asian populations (12–18%), which occupy an intermediate position between European populations (~18–20%) and East Asian populations (<3%). Compliance with Hardy–Weinberg equilibrium (p = 1) confirms genetic stability across generations without significant selection bias or genotyping error.
Clinical Implications for Precision Medicine
Mapping genotypes to predicted metabolizer phenotypes revealed that while 45.45% of subjects were Normal Metabolizers (*1/*1), the remaining 54.55% carried actionable pharmacogenomic variants [9,10]. Intermediate Metabolizers comprised 36% of the cohort, predominantly driven by the *1/*2 and *2/*17 diplotypes. For clopidogrel therapy in cardiovascular disease, intermediate metabolizers exhibit impaired prodrug bioactivation, resulting in lower circulating active metabolite levels and higher rates of major adverse cardiovascular events (MACE), leading guidelines from the Clinical Pharmacogenetics Implementation Consortium (CPIC) to recommend alternative antiplatelet agents such as prasugrel or ticagrelor for these individuals [3,10]. Rapid Metabolizers (*1/*17) accounted for 18.18% of the cohort, where increased gene transcription leads to ultra-rapid metabolism and subtherapeutic plasma concentrations for drugs cleared via CYP2C19 [3,5]. In proton pump inhibitor (PPI) therapy, rapid metabolizers frequently experience therapeutic failure due to accelerated drug elimination, necessitating higher daily doses or alternative acid-suppressive regimens [5]. Finally, Poor Metabolizers (*2/*2) were identified at a low frequency of 0.36%, reflecting the low overall prevalence of homozygous loss-of-function variants in this specific South Indian cohort [6,12].
Study Strengths and Limitations
A key strength of this investigation lies in the utilization of TaqMan probe-based real-time PCR assays, enabling robust and simultaneous targeted genotyping of multiple pharmacogenomically relevant loci alongside exact statistical testing for Hardy–Weinberg equilibrium. This rigorous methodological approach ensured high sensitivity and accuracy in allelic discrimination across the cohort. However, several limitations should be considered when interpreting these findings. First, the study cohort presented a marked male predominance, which reflects specific clinical referral patterns for pharmacogenomic testing rather than a balanced representation of the general population. Second, genomic analysis was restricted to the major common star alleles, omitting rare functional variants, novel single nucleotide polymorphisms, or copy number alterations that could potentially refine phenotype predictions. Finally, because pharmacokinetic parameters and clinical drug responses were not measured in parallel with genetic profiling, the predicted metabolizer phenotypes remain theoretical and warrant future prospective clinical validation.
CONCLUSION
In conclusion, this study establishes a baseline frequency for major CYP2C19 alleles and predicted metabolizer phenotypes in the Telangana population. The high prevalence of intermediate and rapid metabolizers underscores the clinical utility of pre-therapeutic or point-of-care genotyping to guide antiplatelet selection, acid-suppressive therapy, and psychotropic dosing in regional clinical practice
Statements and Declarations
Ethics Approval and Consent to Participate
This study was conducted in accordance with the ethical principles of the Declaration of Helsinki and institutional ethical guidelines. The genotype analyses were performed as part of routine clinical diagnostic services. Patient identifiers were removed prior to data processing and analysis to ensure complete confidentiality and anonymity.
Acknowledgement:
The authors thank the patient and her family for their cooperation and consent for publication of this report. The authors also acknowledge the technical staff of the Department of Genetics and Molecular Medicine, Manipal TRUtest Diagnostic Centre, Hyderabad, for their assistance in Genotype analysis.
Consent for Publication
Not applicable.
Availability of Data and Materials
The datasets generated and analyzed during the current study are not publicly available due to patient privacy and confidentiality requirements. However, anonymized data are available from the corresponding author upon reasonable request, subject to institutional approval.
Funding
This research received no external funding.
REFERENCES


Swarnalatha Daram*, Hariram Pampana, Sugumar Lakshmanan, Venkata Subramanian, Distribution of Common CYP2C19 Alleles in the Telangana Population of South India: Implications for Pharmacogenomics and Personalized Medicine, Int. J. of Pharm. Sci., 2026, Vol 4, Issue 9, 4128-4135. https://doi.org/ 10.5281/zenodo.23056196
 10.5281/zenodo.23056196