

We use cookies to ensure our website works properly and to personalise your experience. Cookies policy
Department of Chemistry, Ramnarain Ruia college, Matunga, Mumbai, India 400019.
Erlotinib, a selective epidermal growth factor receptor (EGFR) tyrosine kinase inhibitor, is widely prescribed for the management of non-small cell lung cancer and pancreatic cancer. Reliable quantification of Erlotinib in biological matrices is critical for pharmacokinetic, bioavailability, bioequivalence, and therapeutic drug monitoring investigations. This study reports the development and validation of a rapid, sensitive, selective, and reproducible liquid chromatography–tandem mass spectrometry (LC–MS/MS) method for Erlotinib estimation in rat plasma, in accordance with United States Food and Drug Administration (US FDA) bioanalytical method validation guidelines. Plasma samples were processed using a simple one-step protein precipitation with acetonitrile, employing Defactinib as the internal standard. Chromatographic separation was achieved on a Zorbax SB-300 column (150 × 4.6 mm, 3.5 ?m) under isocratic conditions with acetonitrile and 0.1% formic acid in water (60:40, v/v) at a flow rate of 0.7 mL/min. Detection was performed using positive electrospray ionization in multiple reaction monitoring mode with transitions of m/z 394.2?278.3 for Erlotinib and m/z 511.0?312.0 for Defactinib. The assay demonstrated excellent linearity across 5.0–5000.0 ng/mL (r² = 0.9963), with a lower limit of quantification of 5.0 ng/mL. Intra- and inter-day precision values were <15%, while accuracy ranged between 98.56% and 106.55%. Mean extraction recoveries were 99.13% for Erlotinib and 90.36% for the internal standard, with negligible matrix interference. Stability assessments confirmed Erlotinib’s robustness under bench-top, freeze–thaw, autosampler, post-preparative, and long-term storage conditions. The validated LC–MS/MS method is rapid, robust, cost-effective, and well-suited for high-throughput analysis in preclinical pharmacokinetic, bioavailability, and therapeutic drug monitoring applications.
Lung cancer continues to be one of the foremost causes of cancer-related mortality worldwide, accounting for nearly one-fifth of all cancer deaths. Non-small cell lung cancer (NSCLC) represents approximately 85% of all lung cancer cases. Dysregulated activation of the epidermal growth factor receptor (EGFR) signaling cascade is a critical driver of tumor proliferation, angiogenesis, invasion, and metastasis, thereby establishing EGFR as a key therapeutic target in contemporary oncology. Erlotinib hydrochloride, a first-generation, orally bioavailable EGFR tyrosine kinase inhibitor (TKI), selectively blocks phosphorylation of the EGFR tyrosine kinase domain, suppressing downstream pathways responsible for cellular growth and survival. Owing to its proven clinical efficacy, Erlotinib has received regulatory approval for the treatment of advanced or metastatic NSCLC harboring activating EGFR mutations and, in combination with gemcitabine, for locally advanced or metastatic pancreatic cancer (1–3).
Despite its therapeutic success, Erlotinib exhibits substantial inter-individual pharmacokinetic variability. Hepatic metabolism via cytochrome P450 enzymes (predominantly CYP3A4), concomitant drug administration, smoking status, dietary factors, and genetic polymorphisms significantly influence systemic exposure. Furthermore, prolonged therapy often leads to acquired resistance through secondary EGFR mutations, MET amplification, or activation of compensatory signaling pathways, ultimately diminishing clinical benefit. Accurate quantification of Erlotinib in biological matrices is therefore indispensable for pharmacokinetic profiling, bioavailability assessment, therapeutic drug monitoring (TDM), dose optimization, and preclinical drug development (4–7).
Quantitative determination of Erlotinib in plasma is analytically challenging due to its extensive plasma protein binding, low circulating concentrations following metabolism, and the inherent complexity of biological matrices. Conventional approaches such as high-performance liquid chromatography with ultraviolet detection (HPLC-UV) have been employed; however, these methods frequently lack the sensitivity, selectivity, and throughput required for pharmacokinetic applications. In contrast, liquid chromatography coupled with tandem mass spectrometry (LC–MS/MS) has emerged as the gold standard for bioanalysis, offering superior sensitivity, specificity, rapid analysis, and reproducibility. The use of multiple reaction monitoring (MRM) further minimizes endogenous interference, enabling reliable quantification at nanogram-per-milliliter levels (8–10).
Several LC–MS/MS methods have been reported for Erlotinib quantification in human plasma and other biological matrices, typically employing liquid–liquid extraction or solid-phase extraction to enhance recovery and reduce matrix effects. While effective, these techniques are labor-intensive, costly, require large sample volumes, and are unsuitable for high-throughput pharmacokinetic studies. Moreover, few validated methods have been specifically optimized for rat plasma, which differs from human plasma in protein composition and endogenous constituents, potentially affecting ionization efficiency during mass spectrometric analysis (11–13).
Protein precipitation extraction (PPE) has gained prominence as a practical alternative, offering simplicity, rapid sample preparation, minimal solvent use, and compatibility with routine workflows. When optimized, PPE ensures high analyte recovery while maintaining acceptable matrix cleanliness for LC–MS/MS analysis. The choice of an internal standard is equally critical to correct for extraction variability and instrumental fluctuations. Defactinib, owing to its physicochemical similarity and comparable chromatographic behavior, serves as a reliable internal standard for Erlotinib quantification in plasma.
Regulatory authorities such as the United States Food and Drug Administration (US FDA) and the European Medicines Agency (EMA) mandate rigorous bioanalytical method validation to ensure reliability and reproducibility. Validation parameters include selectivity, specificity, sensitivity, linearity, precision, accuracy, recovery, matrix effect, dilution integrity, carry-over, and analyte stability under diverse storage and processing conditions. Adherence to these guidelines ensures suitability of the developed method for pharmacokinetic, toxicokinetic, and bioequivalence studies intended for regulatory submission (14,15).
In this study, a rapid, selective, and highly sensitive LC–MS/MS method was developed and validated for Erlotinib quantification in rat plasma using Defactinib as the internal standard. Sample preparation was simplified through single-step protein precipitation with acetonitrile, followed by chromatographic separation on a Zorbax SB-300 column under isocratic conditions with acetonitrile and 0.1% formic acid in water. Detection was achieved using positive electrospray ionization in MRM mode, ensuring high analytical sensitivity and specificity. The method was comprehensively validated in accordance with US FDA bioanalytical guidelines, evaluating linearity, selectivity, specificity, accuracy, precision, recovery, matrix effect, and stability. The validated assay provides a robust, economical, and high-throughput platform suitable for routine preclinical pharmacokinetic studies, bioavailability assessment, therapeutic drug monitoring, and future bioequivalence investigations involving Erlotinib.
2. MATERIALS AND METHODS
2.1 Chemicals and Reagents
Erlotinib hydrochloride (purity 99.78%) was generously provided by Vivan Life Science Labs Ltd., Mumbai, India. Defactinib (purity 99.93%) was employed as the internal standard (IS) and obtained from the same source. LC–MS grade acetonitrile and methanol were procured from J.T. Baker (Mumbai, India), while analytical reagent (AR) grade formic acid was purchased from a certified supplier. Ultrapure water was prepared using a Milli-Q purification system (Millipore, Bengaluru, India). Blank rat plasma containing K₂-EDTA anticoagulant was sourced from Biotox Preclinical Research Centre, Nashik, Maharashtra, India. All chemicals and reagents were of analytical or LC–MS grade and used without further purification (16).
2.2 Instrumentation and Chromatographic Conditions
Chromatographic analysis was conducted on an Schimandzu HPLC SIL HTC (Schimandzu, Japan) system coupled with an AB Sciex API 3200 QTRAP triple quadrupole mass spectrometer equipped with an electrospray ionization (ESI) source operating in positive ionization mode. Data acquisition and processing were performed using Analyst® software version 1.6.3 (17,18).
Separation was achieved on a Zorbax SB-300 column (150 × 4.6 mm, 3.5 μm) maintained at 40°C. The mobile phase comprised acetonitrile and 0.1% formic acid in water (60:40, v/v), delivered under isocratic conditions at a flow rate of 0.7 mL min⁻¹. The injection volume was 15 μL, with a total run time of 3.5 min. Autosampler temperature was maintained at 8°C (19).
2.3 Mass Spectrometric Conditions
Detection was performed in positive ESI mode using multiple reaction monitoring (MRM). Instrument parameters were optimized via direct infusion of Erlotinib and Defactinib solutions (20).
Optimized source parameters included:
Optimized MRM transitions were:
Compound-dependent parameters (declustering potential, entrance potential, collision energy, and collision cell exit potential) were fine-tuned to maximize signal intensity and reproducibility (21).
2.4 Preparation of Standard and Quality Control Samples
Primary stock solutions of Erlotinib and Defactinib (1.0 mg mL⁻¹) were prepared in methanol. Working solutions of Erlotinib were freshly prepared by serial dilution with 50% acetonitrile to yield calibration standards ranging from 5.0–5000.0 ng mL⁻¹ (22).
Quality control (QC) samples were prepared independently at four levels:
The internal standard working solution contained 1 μg mL⁻¹ Defactinib in methanol. All stock and working solutions were stored at 2–8°C until use (23).
2.5 Plasma Sample Preparation
Frozen rat plasma samples were thawed at room temperature and vortex mixed. An aliquot of 50 μL plasma was transferred into polypropylene centrifuge tubes, followed by 20 μL of Defactinib internal standard solution (1 μg mL⁻¹).
Protein precipitation was performed by adding 500 μL acetonitrile, vortex mixing for 5 min, and centrifugation at 14,000 rpm for 5 min (24).
The clear supernatant was transferred into autosampler vials maintained at 8°C, and 15 μL was injected into the LC–MS/MS system.
2.6 Method Validation
Validation was performed according to the United States Food and Drug Administration (US FDA) Bioanalytical Method Validation Guidance (2025), assessing selectivity, specificity, linearity, sensitivity, precision, accuracy, recovery, matrix effect, and stability (25).
2.6.1 Selectivity and Specificity
Six independent blank plasma lots (normal, lipemic, haemolysed) were analysed. Blank samples were compared with LLOQ-spiked plasma to evaluate endogenous interference at Erlotinib and Defactinib retention times (25).
2.6.2 Linearity
Calibration curves (5.0–5000.0 ng mL⁻¹) were generated by plotting Erlotinib/Defactinib peak area ratios against nominal concentrations using 1/x² weighting. Acceptability required r² ≥ 0.99 and back-calculated concentrations within ±15% (±20% for LLOQ) (25,26).
2.6.3 Sensitivity
The LLOQ was defined as the lowest concentration meeting USFDA criteria for precision, accuracy, and signal-to-noise ratio >5 (25).
2.6.4 Precision and Accuracy
Intra-day and inter-day precision/accuracy were assessed using six replicates of QC samples at four levels across three runs. Precision was expressed as %CV, accuracy as % of nominal concentration recovered. Acceptance criteria: %CV ≤15% (≤20% for LLOQ) (25).
2.6.5 Recovery
Extraction recovery was determined by comparing peak areas of extracted QC samples with post-extraction spiked samples at LQC, MQC, and HQC levels (n=6) (27).
2.6.6 Matrix Effect
Matrix effects were evaluated using eight plasma lots. Post-extraction spiked samples (LQC and HQC) were compared with neat standards. Matrix factor and IS-normalized matrix factor were calculated to assess ion suppression/enhancement (28).
2.6.7 Stability Studies
Stability was assessed under USFDA-recommended conditions:
Samples were acceptable if concentrations remained within ±15% of nominal values (25).
2.7 Statistical Analysis
Calibration curves were generated using weighted (1/x²) least-squares regression. Statistical analysis was performed with Analyst® software version 1.6.3. Results are reported as mean ± SD. Precision was expressed as %CV, accuracy as % of nominal concentration recovered. All validation parameters complied with US FDA Bioanalytical Method Validation Guidance (2025) (25,29).
3. RESULTS AND DISCUSSION
3.1 Method Development and Optimization
The LC–MS/MS method was successfully optimized to achieve rapid chromatographic separation, excellent peak symmetry, high sensitivity, and reproducible quantification of Erlotinib in rat plasma. Different mobile phase compositions, flow rates, and chromatographic columns were evaluated during method development. Among the investigated conditions, a Zorbax SB-300 column (150 × 4.6 mm, 3.5 μm) with an isocratic mobile phase consisting of acetonitrile:0.1% formic acid in water (60:40, v/v) produced the best chromatographic performance. Protein precipitation using acetonitrile was selected because of its simplicity, rapid sample preparation, and excellent extraction efficiency.
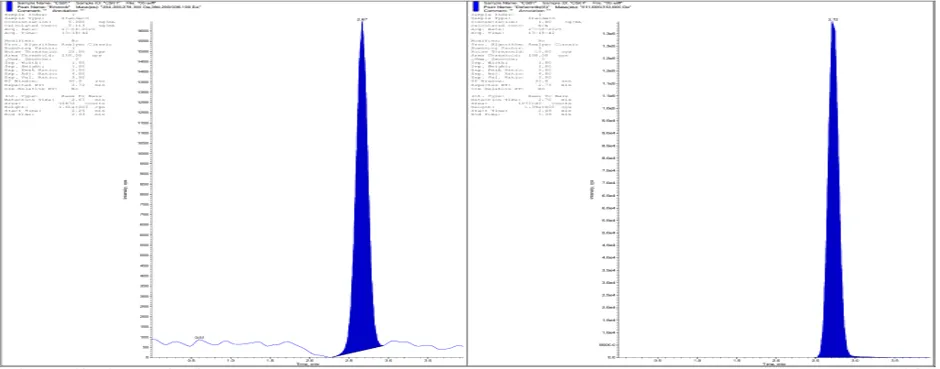
Detection was performed using positive electrospray ionization in MRM mode. The optimized precursor-product ion transitions were m/z 394.2→278.3 for Erlotinib and m/z 511.0→312.0 for Defactinib (IS). Under the optimized chromatographic conditions, Erlotinib and Defactinib were eluted at retention times of 2.67 min and 2.72 min, respectively, within a total run time of 3.5 min, making the method suitable for high-throughput bioanalysis.
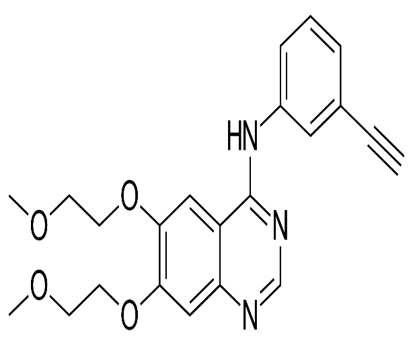
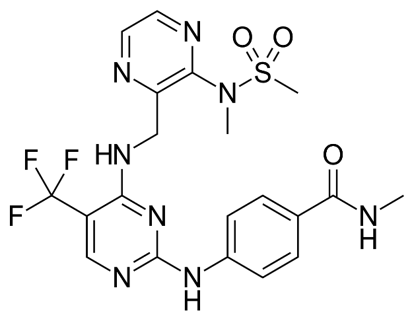
(A) (B)
Figure 1. Chemical structures of (A) Erlotinib and (B) Defactinib (Internal Standard).
The optimized mass spectrometric conditions generated abundant product ions for both analytes. Product ion scanning showed that the protonated molecular ion of Erlotinib produced the most intense fragment at m/z 278.3, whereas Defactinib generated a stable daughter ion at m/z 312.0, which were selected for quantitative MRM analysis.
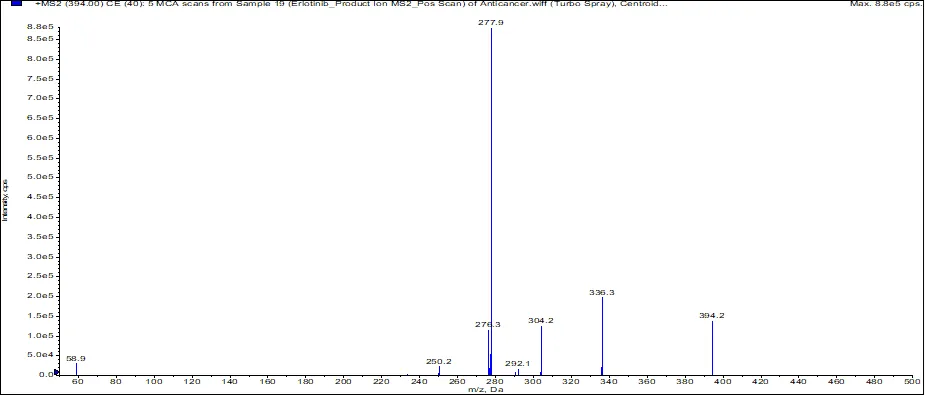
Figure 2. Product ion spectrum of Erlotinib showing MRM transition m/z 394.2 → 278.3.
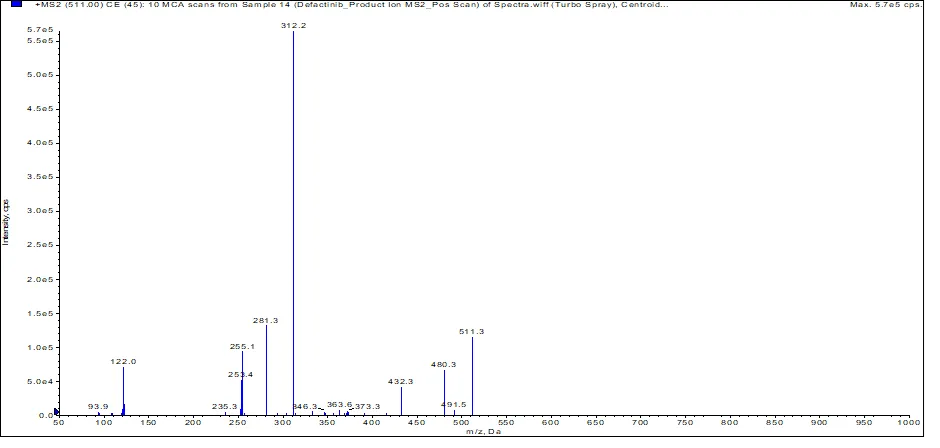
Figure 3. Product ion spectrum of Defactinib (Internal Standard) showing MRM transition m/z 511.0 → 312.0.
3.2 Linearity
Linearity was evaluated over the concentration range of 5.0–5000.0 ng/mL. The calibration curve demonstrated excellent linearity with a regression equation of
y = 0.0353x + 0.0736
and a correlation coefficient (r² = 0.9963), indicating a strong relationship between concentration and detector response. Back-calculated concentrations were within the acceptable USFDA criteria (±15%, except ±20% for LLOQ), confirming the suitability of the method for quantitative bioanalysis.
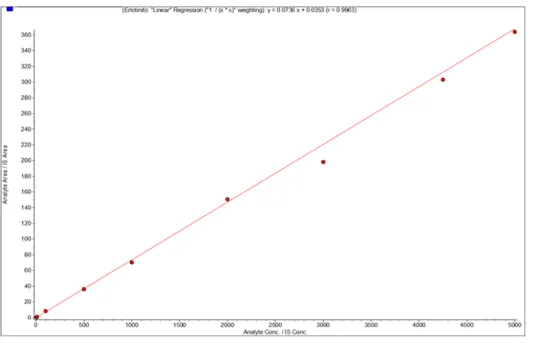
Figure 4. Calibration curve of Erlotinib in rat plasma over the concentration range of 5–5000 ng/mL.
3.3 Selectivity and Specificity
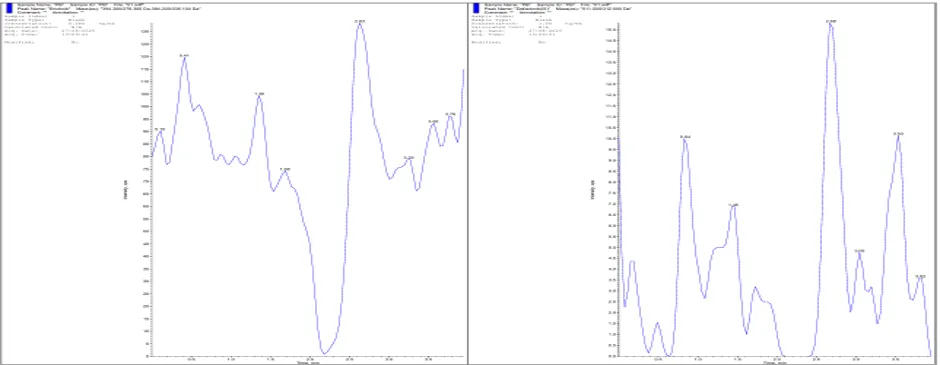
Selectivity was investigated using blank rat plasma obtained from different sources. Representative chromatograms showed the absence of interfering endogenous peaks at the retention times of Erlotinib and Defactinib. Chromatograms obtained from plasma spiked at the lower limit of quantification (LLOQ) demonstrated clear and well-resolved peaks, confirming excellent analytical selectivity.
The percentage interference observed at the retention times of Erlotinib and Defactinib was only 1.13% and 0.01%, respectively, which is well below the regulatory acceptance limits.
(A)
(B)
Figure 5. Blank plasma chromatogram (A) devoid of any interferences; representative chromatograms for (B) rat plasma samples spiked with LLOQ = 5.0 ng/mL.
Figure 5.
(A) Blank rat plasma chromatogram.
(B) Rat plasma chromatogram spiked with Erlotinib at the LLOQ (5.0 ng/mL).
3.4 Precision and Accuracy
The developed method exhibited excellent precision and accuracy throughout the validated concentration range.
Intra-day precision (%CV) ranged from 2.32% to 9.82%, while intra-day accuracy varied between 98.56% and 106.94%.
Similarly, inter-day precision ranged from 7.55% to 12.76%, whereas inter-day accuracy ranged from 101.17% to 106.55%.
These values complied with the USFDA acceptance criteria, indicating that the developed method is reproducible and reliable for quantitative analysis.
Table 1. Intra-day precision and accuracy of Erlotinib in rat plasma (n = 12).
|
Analyte |
Spiked conc.(ng/mL) |
Mean calculated (ng/mL) |
%CV |
%Accuracy |
|
Erlotinib |
5.0 |
5.4 |
8.90 |
106.94 |
|
15.0 |
16.0 |
2.32 |
106.75 |
|
|
1750.0 |
1827.2 |
7.07 |
104.41 |
|
|
4250.0 |
4188.8 |
9.82 |
98.56 |
Table 2. Inter-day precision and accuracy of Erlotinib in rat plasma (n = 18).
|
Analyte |
Spiked conc.(ng/mL) |
Mean calculated.(ng/mL) |
%CV |
%Accuracy |
|
Erlotinib |
5.0 |
5.1 |
12.76 |
101.17 |
|
15.0 |
15.3 |
7.55 |
101.72 |
|
|
1750.0 |
1864.5 |
9.27 |
106.55 |
|
|
4250.0 |
4389.4 |
10.73 |
103.28 |
3.5 Recovery
Protein precipitation using acetonitrile produced excellent extraction efficiency for Erlotinib. The mean extraction recovery was 99.13% for Erlotinib and 90.36% for Defactinib.
The high recovery indicates that the extraction procedure minimizes analyte loss and provides consistent sample preparation, making it suitable for routine pharmacokinetic analysis.
3.6 Matrix Effect
The matrix effect was assessed using eight independent lots of rat plasma. The coefficient of variation remained below 15%, while measured accuracy was maintained between 85% and 115%, indicating negligible ion suppression or enhancement. The normalized matrix factor remained consistent across different plasma lots, confirming the robustness of the assay.
3.7 Stability Studies
Comprehensive stability studies demonstrated that Erlotinib remained stable under all evaluated conditions, including bench-top, freeze–thaw, post-preparative, autosampler, and long-term storage. Accuracy values ranged between 93.78% and 101.42%, confirming the suitability of the method for routine laboratory analysis and pharmacokinetic investigations.
Table 3. Stability results of Erlotinib in rat plasma (n = 6).
|
Stability |
Spiked final conc (ng/mL) |
Mean |
SD |
%CV |
%Accuracy |
|
Short term stability |
15.0 |
14.1 |
1.381 |
9.78 |
94.16 |
|
4250.0 |
3985.7 |
170.180 |
4.27 |
93.78 |
|
|
Post preparative stability |
15.0 |
14.4 |
1.167 |
8.13 |
95.70 |
|
4250.0 |
4255.9 |
362.137 |
8.51 |
100.14 |
|
|
Freeze thaw Stability |
15.0 |
14.8 |
0.768 |
5.20 |
98.36 |
|
4250.0 |
4113.6 |
248.181 |
6.03 |
96.79 |
|
|
Autosampler Stability |
15.0 |
14.21 |
1.064 |
7.49 |
94.76 |
|
4250.0 |
4131.8 |
423.741 |
10.26 |
97.22 |
|
|
Long term Stability |
15.0 |
14.9 |
0.695 |
4.67 |
99.22 |
|
4250.0 |
4310.4 |
320.711 |
7.44 |
101.42 |
3.8 Overall Method Performance
The developed LC–MS/MS assay demonstrated excellent analytical performance, including:
The short run time, simple one-step protein precipitation, high recovery, and excellent validation characteristics make the developed method highly suitable for high-throughput pharmacokinetic, bioavailability, bioequivalence, and therapeutic drug monitoring studies involving Erlotinib.
CONCLUSION
A rapid, sensitive, selective, and robust LC–MS/MS method was successfully developed and validated for the quantitative determination of Erlotinib in rat plasma, employing Defactinib as the internal standard. The analytical workflow utilized a simple one-step protein precipitation with acetonitrile, ensuring excellent extraction efficiency while minimizing sample preparation time and solvent consumption. Chromatographic separation was accomplished within a total run time of 3.5 min on a Zorbax SB-300 column under isocratic conditions with acetonitrile and 0.1% formic acid in water, confirming the method’s suitability for high-throughput bioanalytical applications.
The assay demonstrated outstanding linearity across the concentration range of 5.0–5000.0 ng mL⁻¹ (r² = 0.9963), with a lower limit of quantification (LLOQ) of 5.0 ng mL⁻¹. Validation results established compliance with the USFDA Bioanalytical Method Validation Guidance (2018), covering selectivity, specificity, sensitivity, accuracy, precision, recovery, matrix effect, and stability. Intra- and inter-day precision and accuracy values were well within acceptance criteria, while extraction recovery exceeded 99.00% for Erlotinib with negligible matrix interference. Stability assessments confirmed Erlotinib’s robustness under bench-top, freeze–thaw, autosampler, post-preparative, and long-term storage conditions, thereby ensuring reliability during routine laboratory analysis.
In summary, the validated LC–MS/MS assay provides a reproducible, economical, and high-throughput analytical platform for Erlotinib quantification in biological matrices. Its high sensitivity, short run time, and simplified sample preparation render it particularly suitable for preclinical pharmacokinetic, toxicokinetic, bioavailability, bioequivalence, and therapeutic drug monitoring applications. Furthermore, this method offers a valuable analytical tool for drug development and translational research involving Erlotinib and related tyrosine kinase inhibitors.
ACKNOWLEDGMENTS
The authors honestly thank Dr. Satish Pingale, Director, Purechem Research Labs Pvt. Ltd., Navi Mumbai, for generously providing access to the laboratory facilities and infrastructure that significantly contributed to the effective completing of this research work.
CONFLICT OF INTEREST
The authors declare that there are no financial, commercial, institutional, or personal relationships that could have influenced the work reported in this study. The authors have no conflicts of interest to disclose regarding the publication of this manuscript.
REFERENCES


Jyoti Patil, Madhavi Badole, Establish a Sensitive and Selective LC MS/MS Method for Quantifying Erlotinib in Animal Plasma, Suitable for Pharmacokinetic Studies, Int. J. of Pharm. Sci., 2026, Vol 4, Issue 8, 804-814. https://doi.org/10.5281/zenodo.21808830
 10.5281/zenodo.21808830