

We use cookies to ensure our website works properly and to personalise your experience. Cookies policy
Department of Pharmacy Practice, JKKMMRF's - Annai JKK Sampoorani Ammal College of Pharmacy, Komarapalayam, Tamil Nadu, India
Background: Diabetes mellitus (DM) is a chronic metabolic disorder posing a growing global health burden, particularly in developing regions such as India. Objective: This study aimed to evaluate the effectiveness of structured counseling interventions in improving diabetes-related knowledge, self-care practices, and medication adherence among patients with type 2 diabetes in Erode District, Tamil Nadu, India. Methods: A cross-sectional pre–post interventional study was conducted among 237 patients with type 2 diabetes for at least one year from rural and urban areas of Erode District. Data were collected using validated tools: Diabetes Knowledge Questionnaire (DKQ-24), Diabetes Self-Management Questionnaire (DSMQ), and Morisky Medication Adherence Scale (MMAS-8). A structured counseling intervention on diet, exercise, medication compliance, and lifestyle modification was provided. Pre- and post-counseling scores were compared using paired t-tests and Wilcoxon Signed-Rank tests, with effect sizes expressed as Cohen’s d (p < 0.05) Results: The study included 237 participants (95% response rate); 56.5% were females and 43.5% males. Most participants were aged 51–60 years (35.9%), followed by 41–50 years (31.2%). Educational status showed 48.1% primary education, 22.8% secondary, 20.7% graduates, and 8.4% illiterate. Counseling significantly improved diabetes knowledge, self-care behaviors, and medication adherence (p < 0.001). Adequate knowledge increased from 7.4% to 67.1%, and optimal self-care practices from 67.9% to 99.6%. Medication adherence improved across MMAS-8 items (p < 0.001–0.003), with large effect sizes for glucose management (d = 1.68) and healthcare utilization (d = 3.24). Conclusion: These findings underscore the need to integrate patient-centered counseling into routine diabetes care to achieve sustainable disease control and reduce complications, supporting its scalability as an equitable public health strategy.
Overview of Diabetes Mellitus
Diabetes mellitus (DM) is a chronic metabolic disorder characterized by hyperglycemia resulting from defects in insulin secretion, insulin action, or both [1]. Persistent hyperglycemia damages multiple organ systems over time, particularly the cardiovascular system, kidneys, eyes, and peripheral nerves, leading to significant morbidity and mortality [2].
In 2022, approximately 14% of adults aged 18 years and older were living with diabetes globally, an increase from 7% in 1990. Alarmingly, 59% of adults aged 30 years and over living with diabetes were not taking medication for their condition [3].
Epidemiology of Diabetes
Diabetes is a significant public health concern worldwide. Its prevalence is rising due to aging populations, sedentary lifestyles, and increasing obesity rates. Globally, type 2 diabetes (T2DM) accounts for more than 90-95% of cases, whereas type 1 diabetes (T1DM) comprises 5-10% [3]. Developing countries face unique challenges, including limited healthcare infrastructure, low awareness, and economic barriers to treatment adherence [4].
The ICMR-INDIAB study revealed significant variations in diabetes prevalence across Indian states, with Tamil Nadu showing prevalence rates ranging from 10.4% to 13.5% in urban areas and 4.8% to 7.8% in rural areas [5].
Pathogenesis of Diabetic Complications
There are four possible mechanisms by which hyperglycemia causes neurotoxicity:
Metabolic Pathway
Both neurons and Schwann cells undergo apoptosis when reactive oxygen species (ROS) accumulate through any of these pathways [7].
Vascular Pathway
According to the EURODIAB Prospective Complications study, the occurrence of neuropathy is linked to modifiable cardiovascular risk factors such as increased triglyceride levels, body mass index, smoking, and hypertension [8].
Immunologic-Autoimmune Pathway
The proximal weakness of diabetic lumbosacral plexopathy and other asymmetrical localized mononeuropathies in diabetes are usually accompanied by vasculitis with lymphocytic infiltrate [9].
Neurotrophic and Growth Factor-Deficiency Pathway
In diabetic neuropathy, the local generation of neurotrophic growth factors is hampered as Schwann cells become dysfunctional or undergo apoptosis due to redox stress [10].
Diagnosis of Diabetes and Its Complications
Diabetic neuropathies are diagnosed using the patient's medical history, a clinical examination, and supplementary laboratory tests including:
Management of Diabetes Mellitus
Lifestyle Modification
Medical Nutrition Therapy (MNT): A balanced diet focusing on portion control, reduced intake of refined carbohydrates, saturated fats, and increased consumption of fiber, fruits, and vegetables is crucial [12].
Physical Activity: At least 150 minutes of moderate-intensity aerobic activity per week, combined with resistance training, improves glycemic control and cardiovascular outcomes [13].
Pharmacological Therapy
Oral Hypoglycemic Agents: Metformin is the first-line therapy for most patients with T2DM due to its efficacy, safety, and cardiovascular benefits. Other classes include sulfonylureas, DPP-4 inhibitors, SGLT2 inhibitors, and GLP-1 receptor agonists, which may be used alone or in combination depending on patient characteristics [1].
Patient Education and Support
Studies have consistently demonstrated that DSMES improves self-care behaviors, medication adherence, and clinical outcomes [14,15].
Disease-Related Knowledge in Diabetes Mellitus
Patients who possess higher knowledge are more likely to engage in healthy behaviors and achieve better glycemic control [16].
A study by Murugesan et al. (2020) in India revealed that only 46% of diabetic patients had adequate knowledge about diabetes and its complications, highlighting a significant gap in awareness [17]. Similarly, Al-Qazaz et al. (2011) found that better knowledge was positively correlated with medication adherence and glycemic control among type 2 diabetic patients [18].
Importance of Disease-Related Knowledge
Understanding the impact of diet, physical activity, blood glucose monitoring, and medication adherence helps patients make informed decisions daily [19].
Knowledge about the mechanisms of action, expected benefits, and consequences of non-adherence reinforces the importance of taking medications consistently [20].
Empowered patients take responsibility for their own care, set achievable goals, and maintain motivation [21].
Self-Care Activities in Diabetes
The American Association of Diabetes Educators (AADE) identifies seven key self-care behaviors:
Self-Monitoring of Blood Glucose (SMBG): Plays a critical role in adjusting diet, exercise, and medication. Yet, studies show that SMBG remains underutilized due to cost and lack of knowledge, especially in developing countries [23].
Foot Care: Diabetic foot problems are a major cause of hospitalization, but regular inspection, appropriate footwear, and prompt treatment can reduce risks. Research shows that patient adherence to foot care practices remains suboptimal [24].
Importance of Self-Care Management
Reduction of Healthcare Costs: Consistent self-care reduces hospital admissions and emergency visits related to diabetes complications. Poor self-care leads to uncontrolled blood sugar, increased complications, and higher medical costs [25].
Medication Adherence in Diabetes
According to the World Health Organization (2003), adherence to long-term therapy for chronic diseases averages only 50% in developed countries and is even lower in developing nations [26].
Importance of Medication Adherence
Reducing Hospitalizations and Healthcare Costs: Non-adherence significantly increases the risk of diabetes-related hospital admissions, emergency room visits, and overall healthcare costs [27].
Assessment Tools: DKQ-24, DSMQ, and MMAS-8
Diabetes Knowledge Questionnaire (DKQ-24)
DKQ-24 assesses patients' understanding of diabetes, including pathophysiology, complications, lifestyle, and medication. It is a 24-item questionnaire with true/false/don't know responses. Score interpretation: ≥75% = good knowledge; 50-74% = moderate; <50% = poor knowledge. Higher scores correlate with better self-management and adherence [28].
Diabetes Self-Management Questionnaire (DSMQ)
DSMQ evaluates self-care behaviors across four domains: glucose management, dietary control, physical activity, and healthcare use. It consists of 16 items rated on a 4-point Likert scale. Total score indicates overall self-care adherence. High DSMQ scores are associated with improved HbA1c levels [29].
Morisky Medication Adherence Scale (MMAS-8)
MMAS-8 assesses medication adherence using 8 questions regarding missed doses, timing, and self-discontinuation. Scores: 8 = high adherence; 6-7 = medium; <6 = low adherence. It is widely used in clinical practice and research for evaluating adherence patterns [30].
Rationale for the Study
Despite the availability of effective treatments, diabetes management remains suboptimal in many parts of India, particularly in rural and semi-urban areas. Erode District in Tamil Nadu represents a region with a significant diabetes burden but limited data on patient knowledge, self-care practices, and medication adherence patterns. Previous studies in Tamil Nadu have highlighted gaps in diabetes awareness and self-management [31,32], but few have implemented and evaluated structured counseling interventions in this specific geographic context.
This study addresses this gap by comprehensively assessing baseline knowledge, self-care behaviors, and medication adherence among diabetic patients in Erode District, implementing a structured counseling intervention, and evaluating its effectiveness in improving these critical parameters.
AIM AND OBJECTIVES
Aim
The aim of the study is to evaluate and enhance diabetic patients' self-care practices, disease-related knowledge, and medication adherence in Erode District through structured counseling interventions.
Primary Objectives
Secondary Objectives
MATERIALS AND METHODS
Study Design
This was a cross-sectional, community-based pre-post interventional study conducted to evaluate the effectiveness of structured counseling on diabetes-related knowledge, self-care practices, and medication adherence among patients with type 2 diabetes mellitus.
Study Site
The study was conducted in rural and urban areas of Erode District, Tamil Nadu, India. Erode District is located in the western part of Tamil Nadu and has a mixed population with diverse socioeconomic backgrounds, making it representative of the broader regional demographic.
Study Duration
The study was conducted over a period of six months, from April 2025 to September 2025.
Sample Size Determination
The sample size was determined using Cochran's formula for cross-sectional studies based on proportions:
n = Z²??α/? × p(1-p) / d²
Where:
Calculation:
n = (1.96)² × 0.5(1-0.5) / (0.064)²
n = (3.8416) × 0.25 / 0.004096
n = 0.9604 / 0.004096
n = 235 participants
Assuming a 95% confidence level (Z = 1.96), expected proportion (p = 0.5), and allowable error (d = 0.064), the required sample size was 235 participants. To account for potential dropouts and incomplete responses, 250 questionnaires were distributed.
Study Criteria
Inclusion Criteria
Exclusion Criteria
Materials and Instruments
Face-to-face interviews were conducted to solicit sociodemographic and economic data, medication adherence, diabetic knowledge, and self-care behavior of participants. Validated and structured interviewer-administered questionnaires were used for data collection.
Diabetes Knowledge Questionnaire (DKQ-24)
The DKQ-24 is a validated, 24-item survey used to assess a person's understanding of diabetes. It is also used to evaluate the effectiveness of diabetes education by comparing a patient's knowledge before and after receiving instruction. The 24 questions are typically grouped into three areas:
Patients respond with "Yes," "No," or "I don't know" to each statement, making it accessible for individuals with lower literacy levels. "I don't know" is scored as an incorrect answer to prevent guessing. A total score is calculated based on the number of correct answers.
Scoring Interpretation:
Diabetes Self-Management Questionnaire (DSMQ)
The DSMQ consists of 16 items. Respondents are asked to reflect their self-management behaviors over the past weeks and rate the extent to which each statement applies to them on a 4-point scale (0-3). The questionnaire contains 7 positively worded items and 9 negatively worded (inversely scored) items. The inverse items must be recoded such that higher values indicate more effective self-care before summing item scores to scale scores.
Scoring Example for Inverse Items (Item 16):
The 'Sum Scale' (SS) serves as a global measure of the quality of diabetes self-care, comprising all 16 items. A preliminary cut-off score ≤ 6.0 (total score) is proposed to facilitate the identification of suboptimal self-care.
Morisky Medication Adherence Scale (MMAS-8)
The MMAS-8 assesses medication adherence using 8 questions. Questions 1-7 are answered with a simple "Yes" or "No," while Question 8 uses a 5-point Likert scale. Scoring involves assigning points based on responses:
Scoring Interpretation:
Sociodemographic Data Collection Form
A structured data collection form was used to record:
Data Collection Procedure
Data collection was conducted through interviews and questionnaire administration. The study objectives, procedures, potential risks and benefits, and confidentiality safeguards were explained in the local language (Tamil). Written informed consent was obtained from all participants before baseline assessment. Participants were given a copy of the consent form and contact details of the research team.
Baseline Assessment (Pre-Counseling)
After obtaining consent, baseline data were collected including:
Intervention
Participants received a standardized structured counseling session focused on:
The counseling was delivered by trained educators using an educational module and took approximately 20-30 minutes per participant. Educational materials included visual aids and take-home pamphlets summarizing key messages (see Appendix for patient education materials).
Follow-Up Assessment (Post-Counseling)
The primary follow-up assessment was scheduled at 3 weeks after counseling to measure short-term changes in knowledge, self-care practices, and adherence using the same instruments (DKQ-24, DSMQ, MMAS-8). The same assessor performed the post-test where possible to minimize measurement variability.
Minimizing Loss to Follow-Up
To maximize paired data completeness, the following strategies were employed:
Data Management
All questionnaires were checked at the point of collection for completeness. Data were double-entered into a secure database and validated. The primary analysis used paired-case data (participants with both baseline and post-intervention measures).
Statistical Analysis
Descriptive Statistics
Sociodemographic characteristics and baseline clinical data were summarized using frequencies, percentages, means, and standard deviations.
Comparative Analysis
Statistical Significance
All tests were two-tailed, and a p-value < 0.05 was considered statistically significant.
Software
Analyses were performed using SPSS (Statistical Package for Social Sciences) version 26.0 (IBM Corp., Armonk, NY, USA).
Ethical Considerations
Ethical Approval
The study protocol was reviewed and approved by the Institutional Ethics Committee (IEC) of JKKMMRF's Annai JKK Sampoorani Ammal College of Pharmacy (Ref No: JKKM/ IEC/ M.Pharm/2025-19, dated 26 March 2025). The Ethics Committee is registered with the Drug Controller General of India (DCGI) with registration number "ECR/1918/Inst/TN/2024" under the New Drugs and Clinical Trials Rules, 2019, and operates in compliance with ICMR Guidelines and ICH-GCP Guidelines.
Informed Consent
Written informed consent was obtained from all participants before enrollment. The consent form (provided in both English and Tamil) explained:
Confidentiality
Confidentiality of participants was strictly maintained throughout the study. Data were stored in password-protected files accessible only to the research team. Participant names were replaced with unique identification numbers in the database.
Declaration of Helsinki
The study was conducted in accordance with the ethical principles of the Declaration of Helsinki.
RESULTS
Response Rate and Participant Flow
Out of 250 questionnaires distributed, 237 were returned as completed, resulting in a response rate of 95% for the study. All 237 participants completed both baseline and follow-up assessments, yielding complete paired data for analysis.
Sociodemographic Characteristics of Participants
Gender Distribution
The gender-wise distribution of patients is presented in Table 1 and Figure 1. It was observed that a large majority of the patients, 134 (56.5%), were female, whereas only 103 (43.5%) were male.
Table 1: Gender Distribution of Patients (N=237)
|
Sr. No |
Gender |
Number of Patients |
Percentage (%) |
|
1 |
Male |
103 |
43.5 |
|
2 |
Female |
134 |
56.5 |
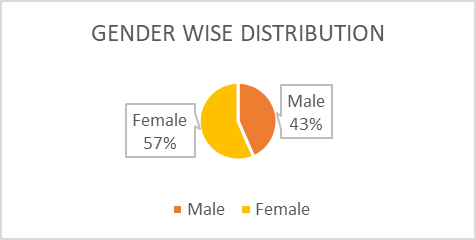
Figure 1: Gender Distribution of Patients
Age Distribution
The age distribution of the study population ranged between 29 and 75 years, with the majority clustered in middle-aged categories (Table 2, Figure 2). The largest proportion of respondents were in the 51-60 years group (35.9%, n=85), followed by those aged 41-50 years (31.2%, n=74), highlighting a predominance of participants in their mid to late working years. Approximately 16.0% (n=38) of the sample fell within the 61-70 years group, while only 1.7% (n=4) were aged 71 years and above. Younger individuals were notably underrepresented, with 0.4% (n=1) below 30 years and 14.8% (n=35) between 31-40 years. Overall, the age profile demonstrates that the study primarily reflects a middle-aged and older adult demographic.
Table 2: Age Distribution of Patients (N=237)
|
Sr. No |
Age Group |
Number of Patients |
Percentage (%) |
|
1 |
≤30 |
1 |
0.4 |
|
2 |
31-40 |
35 |
14.8 |
|
3 |
41-50 |
74 |
31.2 |
|
4 |
51-60 |
85 |
35.9 |
|
5 |
61-70 |
38 |
16.0 |
|
6 |
71+ |
4 |
1.7 |
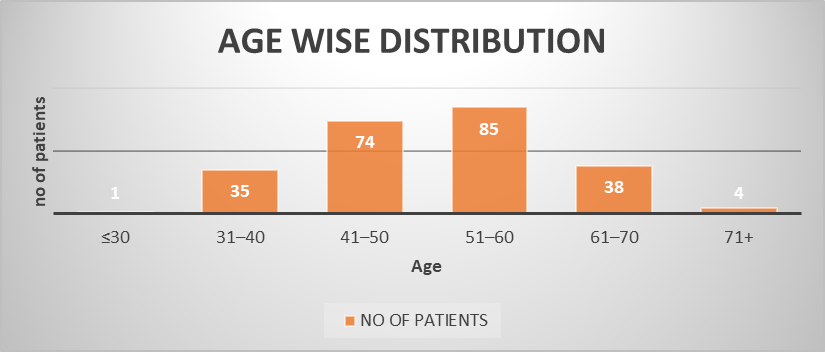
Figure 2: Age Distribution of Patients
Educational Status
The educational status of the participants revealed a predominance of individuals with primary education (48.1%, n=114), followed by those with secondary education (22.8%, n=54) (Table 3, Figure 3). A smaller proportion had attained graduation (20.7%, n=49), while no formal education was reported in 8.4% (n=20) of the sample. This distribution highlights that nearly half of the study population had only basic schooling, with progressively fewer participants attaining higher levels of education. The presence of individuals without formal education also indicates a degree of educational disparity within the group. Overall, the findings suggest that the sample was largely composed of participants with low to moderate levels of formal education.
Table 3: Educational Status of Patients (N=237)
|
Sr. No |
Educational Status |
Number of Patients |
Percentage (%) |
|
1 |
Primary |
114 |
48.1 |
|
2 |
Secondary |
54 |
22.8 |
|
3 |
Graduate (UG+PG) |
49 |
20.7 |
|
4 |
Illiterate (No Education) |
20 |
8.4 |
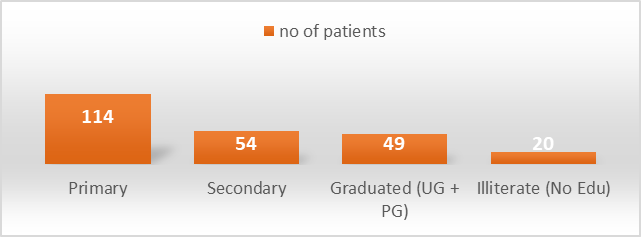
Figure 3: Educational Status of Patients
Marital Status
The marital status distribution revealed that the vast majority of participants were married (82.7%, n=196), indicating strong representation of individuals in established households (Table 4, Figure 4). A smaller proportion were widowed (7.2%, n=17) and divorced (6.8%, n=16), reflecting participants who had experienced marital dissolution. Only 3.4% (n=8) of respondents were unmarried, showing limited participation of single individuals. This distribution suggests that the study population is predominantly composed of married adults, with relatively fewer participants representing other marital categories.
Table 4: Marital Status of Patients (N=237)
|
Sr. No |
Marital Status |
Number of Patients |
Percentage (%) |
|
1 |
Married |
196 |
82.7 |
|
2 |
Widowed |
17 |
7.2 |
|
3 |
Divorced |
16 |
6.8 |
|
4 |
Unmarried |
8 |
3.4 |
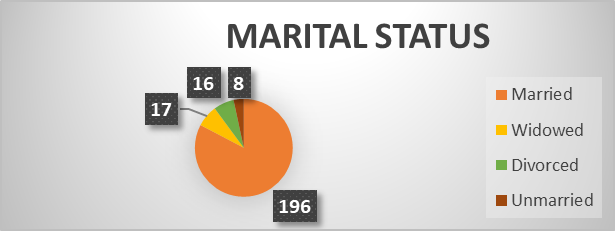
Table 5: Socioeconomic Status of Patients (N=237)
|
Sr. No |
Socioeconomic Status |
Number of Patients |
Percentage (%) |
|
1 |
Employed |
174 |
73.4 |
|
2 |
Unemployed |
63 |
26.6 |
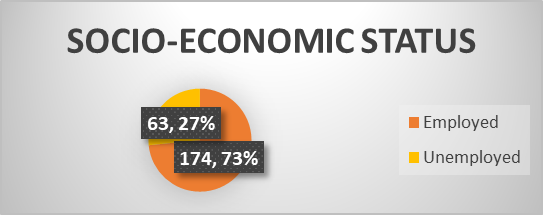
Table 6: Response to Knowledge-Based Questions (DKQ-24) Before and After Counseling
|
Sr. No |
Question |
Before Counseling Yes (N) |
(%) |
No (N) |
(%) |
After Counseling Yes (N) |
(%) |
No (N) |
(%) |
|
1 |
Eating too much sugar and other sweet foods is a cause of diabetes |
237 |
100 |
0 |
0 |
237 |
100 |
0 |
0 |
|
2 |
The usual cause of diabetes is lack of effective insulin in the body |
151 |
63.7 |
86 |
36.3 |
180 |
76.0 |
57 |
24.0 |
|
3 |
Diabetes is caused by failure of the kidneys to keep sugar out of the urine |
142 |
59.9 |
95 |
40.1 |
207 |
87.3 |
30 |
12.7 |
|
4 |
Kidneys produce insulin |
142 |
59.9 |
95 |
40.1 |
197 |
83.1 |
40 |
16.9 |
|
5 |
In untreated diabetes, the amount of sugar in the blood usually increases |
237 |
100 |
0 |
0 |
237 |
100 |
0 |
0 |
|
6 |
If I am diabetic, my children have a higher chance of being diabetic |
233 |
98.3 |
4 |
1.7 |
226 |
95.3 |
11 |
4.7 |
|
7 |
Diabetes can be cured |
145 |
61.2 |
92 |
38.8 |
193 |
81.4 |
44 |
18.6 |
|
8 |
A fasting blood sugar level of 210 is too high |
191 |
80.5 |
46 |
19.5 |
225 |
94.9 |
12 |
5.1 |
|
9 |
The best way to check my diabetes is by testing my urine |
136 |
57.4 |
101 |
42.6 |
193 |
81.4 |
44 |
18.6 |
|
10 |
Regular exercise will increase the need for insulin or other diabetic medication |
154 |
64.9 |
83 |
35.1 |
201 |
84.8 |
36 |
15.2 |
|
11 |
There are two main types of diabetes: Type 1 and Type 2 |
142 |
59.9 |
95 |
40.1 |
176 |
74.2 |
61 |
25.8 |
|
12 |
An insulin reaction is caused by too much food |
144 |
60.8 |
93 |
39.2 |
198 |
83.5 |
39 |
16.5 |
|
13 |
Medication is more important than diet and exercise to control my diabetes |
137 |
57.8 |
100 |
42.2 |
204 |
86.1 |
33 |
13.9 |
|
14 |
Diabetes often causes poor circulation |
151 |
63.7 |
86 |
36.3 |
164 |
69.2 |
73 |
30.8 |
|
15 |
Cuts and abrasions on diabetics heal more slowly |
122 |
51.5 |
115 |
48.5 |
172 |
74.7 |
65 |
25.3 |
|
16 |
Diabetics should take extra care when cutting their toenails |
157 |
66.2 |
80 |
33.8 |
197 |
83.1 |
40 |
16.9 |
|
17 |
A person with diabetes should cleanse a cut with iodine and alcohol |
131 |
55.3 |
106 |
44.7 |
138 |
58.3 |
99 |
41.7 |
|
18 |
The way I prepare my food is as important as the foods I eat |
148 |
62.4 |
89 |
37.6 |
180 |
75.9 |
57 |
24.1 |
|
19 |
Diabetes can damage my kidneys |
158 |
66.6 |
79 |
33.4 |
194 |
81.8 |
43 |
18.2 |
|
20 |
Diabetes can cause loss of feeling in my hands, fingers and feet |
170 |
71.7 |
67 |
28.3 |
204 |
86.1 |
33 |
13.9 |
|
21 |
Shaking and sweating are signs of high blood sugar |
138 |
58.2 |
99 |
41.8 |
198 |
83.5 |
39 |
16.5 |
|
22 |
Frequent urination and thirst are signs of low blood sugar |
156 |
65.8 |
81 |
34.2 |
178 |
75.1 |
59 |
24.9 |
|
23 |
Tight elastic hose or socks are not bad for diabetics |
146 |
62.6 |
91 |
38.4 |
198 |
83.5 |
39 |
16.5 |
|
24 |
A diabetic diet consists mostly of special foods |
156 |
65.8 |
81 |
34.2 |
153 |
64.6 |
84 |
35.4 |
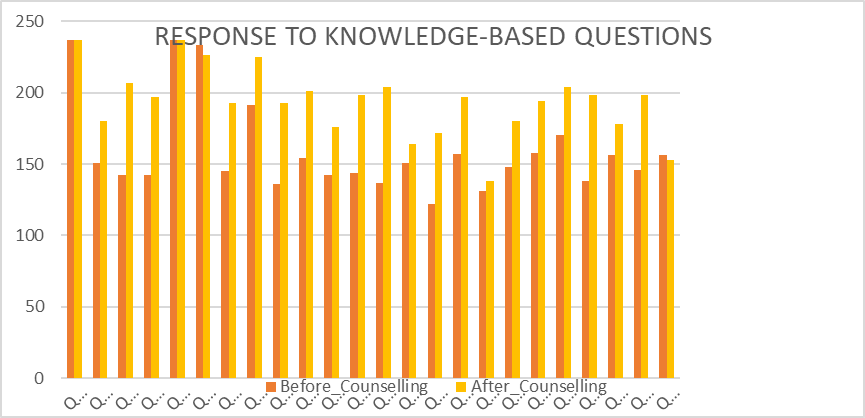
Table 7: Shift in Knowledge Levels Regarding Diabetes Following Counseling
|
Sr. No |
Knowledge Level |
Before Counseling (N=237) |
% |
After Counseling (N=237) |
% |
|
1 |
Average (14-19) |
184 |
77.3 |
70 |
33.7 |
|
2 |
Low (≤13) |
35 |
14.3 |
2 |
0.4 |
|
3 |
Adequate (≥20) |
18 |
7.4 |
165 |
67.1 |
Table 8: Response to Diabetes Self-Management (DSMQ) - Pre vs Post Counseling
|
Sr. No |
Subscale |
Before (M ± SD) |
After (M ± SD) |
Mean Difference |
t value |
p value |
Cohen's d |
|
1 |
Glucose Management (GM) |
7.84 ± 1.48 |
10.41 ± 1.56 |
2.56 |
22.57 |
<0.001 |
1.68 |
|
2 |
Dietary Control (DC) |
7.89 ± 1.29 |
8.08 ± 1.29 |
0.19 |
7.34 |
<0.001 |
0.48 |
|
3 |
Physical Activity (PA) |
6.41 ± 1.36 |
7.11 ± 0.80 |
0.70 |
7.63 |
<0.001 |
0.49 |
|
4 |
Health-Care Use (HU) |
6.41 ± 2.11 |
7.24 ± 0.69 |
0.84 |
49.91 |
<0.001 |
3.24 |
|
5 |
Self-Care (Overall) |
1.97 ± 1.00 |
2.27 ± 0.70 |
0.29 |
— |
— |
— |
Glucose Management (GM)
Participants' GM scores improved significantly following counseling, increasing from 7.84 ± 1.48 before counseling to 10.41 ± 1.56 after counseling. The mean difference of 2.56 points was highly significant (t = 22.57, p < 0.001), with a very large effect size (Cohen's d = 1.68). This indicates substantial improvement in participants' ability to manage glucose levels.
Dietary Control (DC)
Dietary control improved slightly from 7.89 ± 1.29 to 8.08 ± 1.29, with a mean difference of 0.19 points. Despite the small change, the improvement was statistically significant (t = 7.34, p < 0.001), with a medium effect size (Cohen's d = 0.48), suggesting modest but meaningful improvements in dietary self-management.
Physical Activity (PA)
The PA subscale increased from 6.41 ± 1.36 to 7.11 ± 0.80, reflecting a mean difference of 0.70 points. This change was statistically significant (t = 7.63, p < 0.001), with a medium effect size (Cohen's d = 0.49), indicating moderate improvement in physical activity behaviors post-counseling.
Health-Care Use (HU)
HU scores rose from 6.41 ± 2.11 to 7.24 ± 0.69, corresponding to a mean difference of 0.84 points. This was highly significant (t = 49.91, p < 0.001), with an exceptionally large effect size (Cohen's d = 3.24), suggesting counseling led to a dramatic increase in appropriate healthcare utilization.
Self-Care (Overall)
Overall self-care improved from 1.97 ± 1.00 to 2.27 ± 0.70, with a mean difference of 0.29 points. The descriptive statistics suggest a positive trend, indicating improved overall self-care practices.
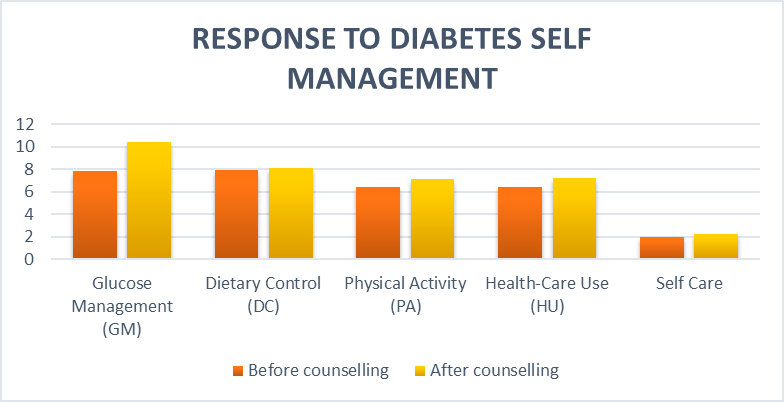
Figure 8: Response to Diabetes Self-Management - Pre vs Post Counseling
[Comparative bar chart showing improvement across all DSMQ subscales]
Comparison of Self-Care Status
Table 9 and Figure 9 present the comparison of self-care status before and after counseling based on the DSMQ cut-off scores.
Table 9: Comparison of Self-Care Status Before and After Counseling (N=237)
|
Sr. No |
Self-Care Status |
Before Counseling (N=237) |
After Counseling (N=237) |
|
1 |
Optimal Care |
161 (67.9%) |
236 (99.6%) |
|
2 |
Suboptimal Care |
76 (32.1%) |
1 (0.4%) |
Before counseling, only 161 (67.9%) participants demonstrated optimal self-care, while 76 (32.1%) participants were categorized as having suboptimal self-care. However, after the counseling intervention, the number of participants with optimal self-care markedly increased to 236 (99.6%), with only 1 participant (0.4%) remaining in the suboptimal care category. This finding highlights the substantial improvement in self-care practices following counseling, indicating the effectiveness of the intervention.
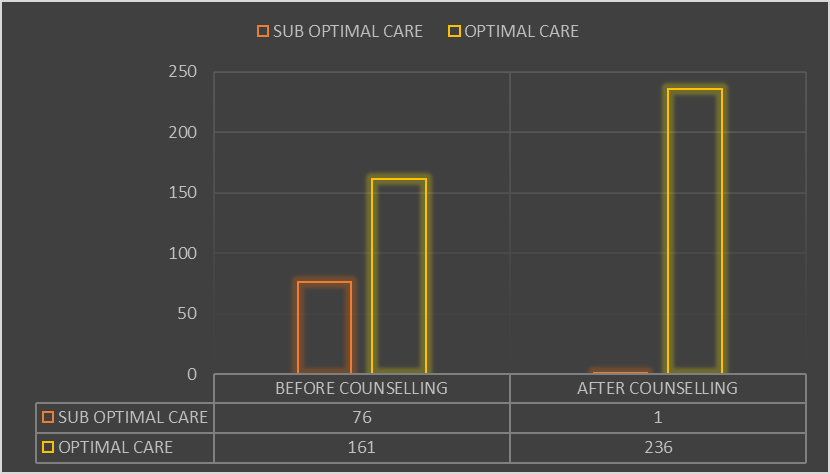
Figure 9: Comparison of Self-Care Status Before and After Counseling
[Bar chart showing: Before counseling: Optimal (67.9%), Suboptimal (32.1%); After counseling: Optimal (99.6%), Suboptimal (0.4%)]
Factors Influencing Self-Care Practice
Table 10 presents the comparison of self-care practice before and after counseling across sociodemographic factors, including gender, age, marital status, education, and socioeconomic status.
Table 10: Factors Influencing Self-Care Practice: A Comparison Before and After Counseling
|
Factor |
Category |
High (Before) |
Low (Before) |
Medium (Before) |
High (After) |
Low (After) |
Medium (After) |
|
Gender |
Male |
0 |
76 |
27 |
7 |
6 |
90 |
|
Female |
3 |
95 |
36 |
9 |
3 |
110 |
|
|
Age Group |
<30 |
0 |
0 |
1 |
0 |
0 |
1 |
|
31-45 |
1 |
51 |
29 |
7 |
7 |
67 |
|
|
46-60 |
2 |
86 |
25 |
6 |
2 |
100 |
|
|
61+ |
0 |
33 |
9 |
3 |
3 |
32 |
|
|
Marital Status |
Married |
3 |
143 |
50 |
12 |
20 |
164 |
|
Single (all) |
0 |
28 |
11 |
4 |
8 |
27 |
|
|
Education |
No Education |
0 |
16 |
4 |
0 |
4 |
16 |
|
School level |
3 |
123 |
42 |
9 |
12 |
145 |
|
|
Graduate |
0 |
32 |
17 |
7 |
3 |
37 |
|
|
Socioeconomic |
Employed |
3 |
124 |
47 |
13 |
13 |
148 |
|
Unemployed |
0 |
47 |
16 |
3 |
8 |
52 |
Key Observations:
Before counseling, the majority of participants across all groups were concentrated in the Low self-care category, with relatively few in the Medium and almost none in the High category. This indicates that baseline knowledge and adherence to self-care practices were inadequate, regardless of demographic background.
After counseling, there was a marked and consistent improvement across all factors:
Gender: Both males and females showed significant improvement. Among females, those in the Medium category rose from 36 to 110, and in High from 3 to 9. Among males, High increased from 0 to 7, and Medium from 27 to 90.
Age: Participants in all age groups benefited. For example, in the 31-45 group, High increased from 1 to 7 and Medium from 29 to 67. In the 46-60 group, High rose from 2 to 6 and Medium from 25 to 100. Even participants aged 61+ improved, with Medium increasing from 9 to 32.
Marital Status: Married participants had the largest improvement, with Medium rising from 50 to 164. Single participants (unmarried, widowed, divorced) also improved, with Medium rising from 11 to 27.
Education: Clear benefits were observed in all education groups. Graduates saw High rise from 0 to 7, and Medium from 17 to 37. Participants with school-level education improved dramatically, with Medium increasing from 42 to 147. Even those with no education showed gains, with Medium rising from 4 to 16.
Socioeconomic Status: Both employed and unemployed groups shifted strongly from Low to Medium. Among the employed, Medium rose from 47 to 148, while among the unemployed it increased from 16 to 52.
Statistical Confirmation for Self-Care Improvement
Medication Adherence Assessment (MMAS-8)
Item-wise Response Analysis
Table 11 presents the comparison of medication adherence responses before and after counseling, assessed across eight questionnaire items. Mean scores with standard deviations were calculated for each item, and paired-sample t-tests were conducted to evaluate changes following the intervention. Effect sizes were reported using Cohen's d.
Table 11: Response for Medication Adherence (MMAS-8) - Pre vs Post Counseling
|
Sr. No |
Question |
Before Counseling (Mean ± SD) |
After Counseling (Mean ± SD) |
t value |
p value |
Cohen's d |
|
1 |
Do you sometimes forget to take your medicine? |
0.637 ± 0.482 |
0.865 ± 0.343 |
5.933 |
<0.001 |
0.545 |
|
2 |
People sometimes miss taking their medicines for reasons other than forgetting. Thinking over the past two weeks, were there any days when you did not take your medicine? |
0.574 ± 0.496 |
0.705 ± 0.457 |
2.990 |
0.003 |
0.275 |
|
3 |
Have you ever cut back or stopped taking your medicine without telling your doctor because you felt worse when you took it? |
0.578 ± 0.495 |
0.840 ± 0.368 |
6.539 |
<0.001 |
0.601 |
|
4 |
When you travel or leave home, do you sometimes forget to bring your medication? |
0.586 ± 0.494 |
0.826 ± 0.380 |
6.006 |
<0.001 |
0.548 |
|
5 |
Did you take your medicine yesterday? |
0.426 ± 0.496 |
0.793 ± 0.406 |
8.880 |
<0.001 |
0.814 |
|
6 |
When you feel like your symptoms are under control, do you sometimes stop taking your medicine? |
0.591 ± 0.493 |
0.841 ± 0.366 |
6.348 |
<0.001 |
0.583 |
|
7 |
Taking medication every day is a real inconvenience for some people. Do you ever feel hassled about sticking to your treatment plan? |
0.638 ± 0.482 |
0.844 ± 0.364 |
5.333 |
<0.001 |
0.486 |
|
8 |
How often do you have difficulty remembering to take all your medications? |
0.621 ± 0.207 |
0.783 ± 0.153 |
9.717 |
<0.001 |
0.887 |
Key Findings:
The results indicate significant improvements in medication adherence after counseling across all items (p < 0.05 to p < 0.001):
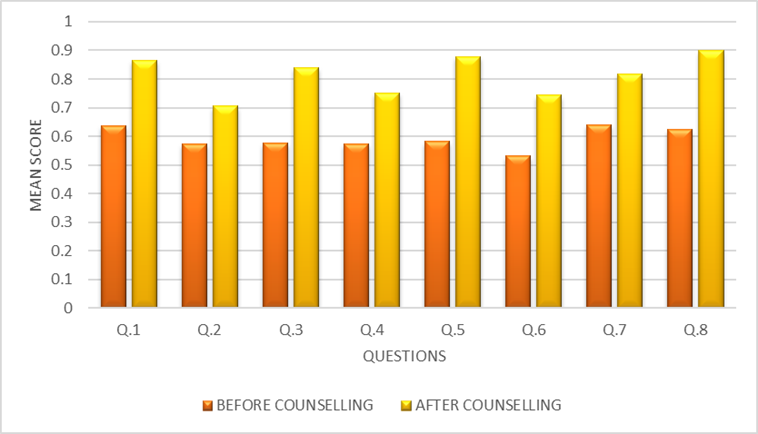
Figure 10: Response for Medication Adherence - Pre vs Post Counseling
[Comparative bar chart showing improvement across all MMAS-8 items]
Factors Influencing Medication Adherence
Table 12 presents the comparison of medication adherence before and after counseling across sociodemographic factors.
Table 12 Factors Influencing Medication Adherence: A Comparison Before and After Counseling
|
Factor |
Category |
High (Before) |
Low (Before) |
Medium (Before) |
High (After) |
Low (After) |
Medium (After) |
|
Gender |
Male |
0 |
76 |
27 |
7 |
6 |
90 |
|
Female |
3 |
95 |
36 |
9 |
3 |
110 |
|
|
Age Group |
<30 |
0 |
0 |
1 |
0 |
0 |
1 |
|
31-45 |
1 |
51 |
29 |
7 |
7 |
67 |
|
|
46-60 |
2 |
86 |
25 |
6 |
2 |
100 |
|
|
61+ |
0 |
33 |
9 |
3 |
3 |
32 |
|
|
Marital Status |
Married |
3 |
143 |
50 |
12 |
20 |
164 |
|
Single (all) |
0 |
28 |
11 |
4 |
8 |
27 |
|
|
Education |
No Education |
0 |
16 |
4 |
0 |
4 |
16 |
|
School level |
3 |
123 |
42 |
9 |
12 |
145 |
|
|
Graduate |
0 |
32 |
17 |
7 |
3 |
37 |
|
|
Socioeconomic |
Employed |
3 |
124 |
47 |
13 |
13 |
148 |
|
Unemployed |
0 |
47 |
16 |
3 |
8 |
52 |
Before counseling, most participants across all groups were concentrated in the Low adherence category, with very few in Medium and almost none in High. This pattern was consistent across gender, age groups, marital status, education levels, and socioeconomic status, highlighting poor baseline adherence in the study population.
After counseling, there was a marked and consistent improvement in adherence across all demographic groups:
Gender: Among males, participants in the High category rose from 0 to 7, while Medium increased from 27 to 90. Among females, High rose from 3 to 9, and Medium from 36 to 110.
Age: Participants aged 31-45 and 46-60 showed notable gains. In the 31-45 group, High increased from 1 to 7, and Medium from 29 to 67. In the 46-60 group, High rose from 2 to 6, and Medium from 25 to 100. Even in the 61+ group, Medium adherence more than tripled (9 → 32).
Marital Status: Married participants improved significantly, with Medium adherence rising from 50 to 164. Single participants (unmarried, divorced, widowed) also improved, with High increasing from 0 to 4 and Medium from 11 to 27.
Education: Among graduates, High adherence increased from 0 to 7 and Medium from 17 to 37. For those with school-level education, High rose from 3 to 9 and Medium from 42 to 145. Even among participants with no education, Medium adherence improved from 4 to 16.
Socioeconomic Status: Both employed and unemployed groups benefited. Among employed participants, High increased from 3 to 13 and Medium from 47 to 148. Among the unemployed, High rose from 0 to 3 and Medium from 16 to 52.
Statistical Confirmation for Medication Adherence Improvement
DISCUSSION
This study sought to evaluate the effectiveness of structured counseling interventions in improving diabetes-related knowledge, self-care practices, and medication adherence among patients with type 2 diabetes in Erode District, Tamil Nadu. The findings demonstrate that counseling significantly enhanced patients' understanding of diabetes, improved their self-care practices, and substantially reduced non-adherence to medication. These improvements were consistent across gender, age, marital status, educational background, and socioeconomic status, underscoring counseling as an equitable and scalable strategy for diabetes management in resource-limited settings.
Sociodemographic Profile of Study Population
The study population comprised predominantly middle-aged and older adults, with the majority (67.1%) aged between 41-60 years. This aligns with the typical age distribution of type 2 diabetes in India, where the disease often manifests in the productive years of life [3]. The higher proportion of female participants (56.5%) compared to males (43.5%) is consistent with previous community-based studies in South India, which have reported greater health-seeking behavior and willingness to participate in research among women [33,34].
The educational profile of participants, with nearly half (48.1%) having only primary education and 8.4% being illiterate, reflects the educational demographics of rural and semi-urban Tamil Nadu. This highlights the importance of designing health education interventions that are accessible to individuals with limited formal education, using simple language, visual aids, and culturally appropriate examples. The high proportion of married participants (82.7%) and employed individuals (73.4%) suggests that most participants had family support and were economically active, factors that can positively influence diabetes management when leveraged appropriately [35].
Improvement in Diabetes-Related Knowledge
Baseline Knowledge Deficits
At baseline, the majority of participants exhibited only average levels of knowledge (77.3%), with 14.3% categorized as low and only 7.4% demonstrating adequate knowledge. These findings are consistent with previous studies conducted in India. Deepa et al. (2014), in the ICMR-INDIAB study, reported that awareness regarding diabetes was poor in both urban and rural populations, with widespread misconceptions about causation and treatment [5]. Dinesh, Binu & Thomas (2016) similarly found that rural patients in Karnataka had limited understanding of diabetes and its complications, with many unaware of the chronic nature of the disease and the importance of long-term management [36].
Specific misconceptions identified in our baseline assessment are noteworthy. Only 59.9% correctly understood that kidneys do not produce insulin, indicating confusion about the basic pathophysiology of diabetes. Similarly, only 57.4% recognized that urine testing is not the optimal method for diabetes monitoring, reflecting outdated beliefs that may persist from earlier eras of diabetes care. The low correct response rate (51.5%) regarding delayed wound healing in diabetes is particularly concerning, as this knowledge is crucial for preventing foot complications and ulcers [24].
Post-Counseling Knowledge Gains
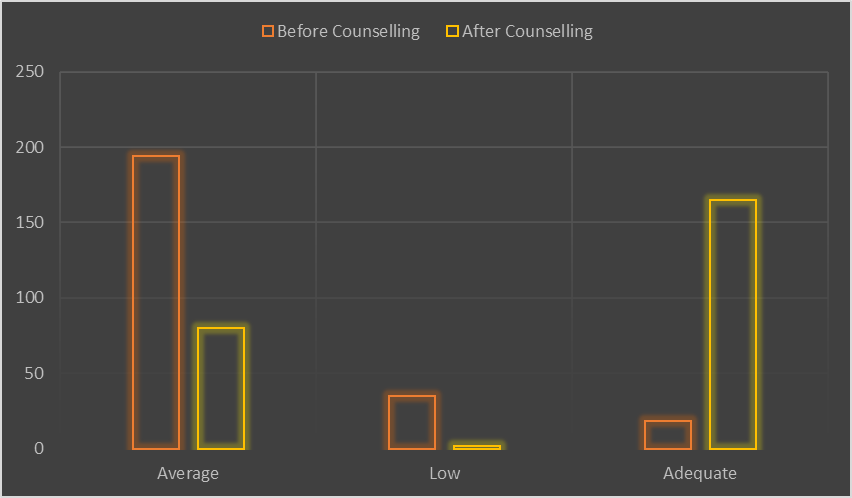
Following counseling, there was a dramatic improvement in knowledge across nearly all domains. The proportion of participants achieving adequate knowledge increased from 7.4% to 67.1%, while those with low knowledge nearly disappeared (14.3% → 0.4%). These findings align with Hyder, Balasubramanian, & Kumar (2021), who demonstrated that a structured prediabetes education program in South India significantly improved knowledge, attitudes, and practices among participants [37].
The largest improvements were observed in areas addressing fundamental misconceptions. Understanding that diabetes is not caused by kidney failure improved from 59.9% to 87.3%, knowledge that kidneys do not produce insulin increased from 59.9% to 83.1%, and recognition that urine testing is not optimal rose from 57.4% to 81.4%. These gains indicate that the counseling effectively addressed the most prevalent misconceptions in the population.
Integration of Counseling into Routine Care
The substantial improvements achieved through a single 20-30 minute counseling session suggest that even brief, structured interventions can have meaningful impacts on patient outcomes. This has important implications for resource-limited settings where longer or more intensive interventions may not be feasible. Integrating structured counseling into routine diabetes care at primary health centers, district hospitals, and community health settings could significantly enhance diabetes management at the population level.
The effectiveness of counseling across all demographic subgroups supports its potential as an equitable intervention. Unlike interventions that require literacy, technological access, or significant financial resources, counseling can be adapted to reach diverse populations, including those with limited education, older adults, and economically disadvantaged groups.
CONCLUSION
This study provides robust evidence that structured counseling interventions can produce significant and meaningful improvements in diabetic patients' knowledge, self-care practices, and medication adherence in Erode District, Tamil Nadu. The key conclusions are as follows:
Summary of Key Findings
Knowledge Enhancement: Structured counseling dramatically improved diabetes-related knowledge, with the proportion of participants achieving adequate knowledge increasing from 7.4% to 67.1%. The intervention effectively addressed prevalent misconceptions about diabetes causation, monitoring, and treatment.
Self-Care Improvement: Optimal self-care practices rose from 67.9% to 99.6% following counseling. Large effect sizes were observed for glucose management (Cohen's d = 1.68) and healthcare utilization (d = 3.24), indicating substantial behavioral change in these critical domains.
Medication Adherence: Significant improvements were observed across all MMAS-8 items, with the largest effects on remembering medications (d = 0.887) and consistent daily intake (d = 0.814).
Equity of Effect: Improvements were consistent across gender, age, education, and socioeconomic status, demonstrating counseling as an equitable intervention that benefits all patient subgroups.
Intervention Feasibility: The 20-30 minute counseling session was feasible to deliver in community settings and was well-received by participants, as evidenced by the high response and follow-up rates.
REFERENCES


A. Srinivasan, N. Senthilkumar, S. Ganesan, Dr. C. J. Glady Gloria Grant, Evaluating and Enhancing Diabetic Patients' Self-Care Practices, Disease-Related Knowledge, and Medication Adherence in Erode District: A Cross-Sectional Survey, Int. J. of Pharm. Sci., 2026, Vol 4, Issue 3, 3999-4021. https://doi.org/10.5281/zenodo.19339220
 10.5281/zenodo.19339220