
We use cookies to ensure our website works properly and to personalise your experience. Cookies policy
Sage Institute of Research and Technology- Pharmacy, Sanjeev Agrawal Global Educational University, Bhopal- 462 022, Madhya Pradesh, India.
Obesity has reached epidemic proportions worldwide, contributing to chronic diseases and significant healthcare burdens. Traditional medicinal plants, such as Momordica charantia (Bitter Melon), offer promising therapeutic potential due to their diverse bioactive compounds. This study investigates the phytochemical profile and in-vitro bioactivity of M. charantia varieties ("Ucche" and "Karela") commonly found in South Asia. Sequential extraction was performed using solvents of varying polarity, including hexane, ethyl acetate, ethanol and a hydroalcoholic mixture. Qualitative screening confirmed the presence of alkaloids, flavonoids, saponins, steroids, tannins and terpenoids. Quantitative assays revealed significant total phenolic and flavonoid contents, which are known to contribute to antioxidant properties. The antioxidant capacity of the extracts was evaluated using DPPH, ABTS and FRAP assays, demonstrating dose-dependent scavenging activities and reducing power. Furthermore, the study explored the anti-obesity potential of M. charantia through a pancreatic lipase inhibition assay. Pancreatic lipase is a key enzyme involved in dietary fat absorption and its inhibition is a recognized strategy for managing weight. The results suggest that M. charantia extracts possess potent antioxidant and anti-lipase activities, making them valuable candidates for further development in metabolic health management. This research provides a comprehensive framework for understanding the medicinal properties of Bitter Melon and supports its traditional use in treating metabolic disorders. Findings underscore the importance of natural products in the global battle against obesity.
Obesity is a chronic condition with a progressive nature that even rebounds at times and it has now hit global epidemic proportions [1]. It carries with it a wide range of complications, chronic diseases and a significant burden on health systems globally. Recent data showed 3.71 million estimated deaths and 129 million disability-adjusted life-years because of overweight and obesity alone in 2021 [2]. Moreover, these risks are some of the leading global risks and they are the fastest growing risks in terms of disease burden [2]. Obesity is increasingly treated within medical and public health frameworks as a disease entity, yet this classification raises important conceptual and practical concerns. Traditionally, diseases are understood as conditions that disrupt normal physiological function, producing identifiable changes in organs or tissues that lead to both objectively measurable abnormalities and subjectively experienced symptoms such as pain, fatigue, or dysfunction. In contrast, obesity does not always conform neatly to this definition. While it is associated with altered metabolic processes and increased risk of comorbidities, it does not invariably produce immediate or uniform pathological changes in all individuals. This creates an inherent tension in defining obesity strictly as a disease, particularly when compared with more classical disease models [3]. One of the most debated aspects of this issue is the reliance on the Body Mass Index (BMI) as a primary diagnostic criterion. BMI is a simple, population-level screening tool based on height and weight, but it does not directly measure body fat distribution, metabolic health, or functional impairment. As a result, individuals with similar BMI values may have vastly different health profiles. For instance, some individuals categorized as obese by BMI may be metabolically healthy, while others within the “normal” BMI range may exhibit significant metabolic dysfunction. This disconnect highlights a deviation from standard disease definitions, where diagnosis is typically based on direct evidence of pathological changes rather than indirect or surrogate markers [3]. The consequences of this definitional ambiguity are significant. Clinically, it may lead to overdiagnosis or misclassification, resulting in unnecessary medical interventions for some individuals while potentially overlooking others who are at genuine risk. Financially, it places a burden on healthcare systems by allocating resources toward generalized treatment approaches that may not be appropriate or effective for all patients. The broad labeling of obesity as a disease can also influence insurance policies, pharmaceutical development and treatment priorities, sometimes shifting focus away from individualized care toward standardized and occasionally oversimplified, management strategies. Beyond clinical and economic implications, the classification of obesity as a disease carries important political and psychological ramifications. Public health policies may become overly prescriptive, emphasizing weight reduction without consideration of social, cultural and behavioral contexts. This can inadvertently stigmatize individuals, reinforcing negative perceptions and contributing to psychological distress, including low self-esteem, anxiety and depression. Moreover, framing obesity strictly as a disease may reduce personal agency in some contexts while simultaneously placing undue responsibility on individuals in others, creating a paradox in how responsibility and blame are assigned. It is also crucial to recognize that body weight and composition are influenced by a complex interplay of genetic, environmental, behavioral and socio-economic factors. Everyday behaviors such as dietary habits, physical activity levels and lifestyle choices exist along a spectrum and are often shaped by cultural norms and environmental constraints. Therefore, there is a risk that normal variations in body weight or natural adaptive behaviors could be medicalized if diagnostic thresholds are applied too rigidly. This could lead to the unnecessary labeling of individuals as “overweight” or “diseased,” even when their condition does not result in functional impairment or reduced quality of life. In light of these considerations, a more nuanced approach to obesity is needed—one that balances the recognition of its potential health risks with an appreciation of individual variability and context. Rather than relying solely on simplified metrics like BMI, a comprehensive assessment incorporating metabolic health, functional capacity and psychosocial well-being would provide a more accurate and meaningful framework. Such an approach would help ensure that interventions are both clinically appropriate and ethically sound, avoiding the pitfalls of overmedicalization while still addressing genuine health concerns [3]. Obesity is a complex chronic disease rendering premature death and complications of health as well as an escalation of costs related to ill health. In 2015, estimates were about 603.7 million adults and 107.7 million children with obesity accounting for 50% of missed years of life owing to premature death, among other health problems. It was also found that the proportion of obese individuals had increased twofold in almost half the countries since 1980.[4].It has been projected that by the year 2030, obesity would affect one in every two adults in the United States. The health care sector alone in the United States bears the burden of an estimated $480 billion annually due to obesity [5],[6].
Obesity is actually described by the World Health Organization as excessive adiposity, which brings additional health implications. Commonly classified as a BMI over 30 kg/m2.it poses a risk to many metabolic complications. Its grandeurs are not limited to ischemic heart disease but include toxic endocrine specific-disease connections, muscular dystrophy and chronic illness [7]. Obesity is formally described by the World Health Organization as a condition characterized by excessive or abnormal accumulation of adipose tissue that presents a risk to health. This definition emphasizes not merely an increase in body weight, but specifically an increase in body fat that has the potential to disrupt normal physiological processes. In clinical and epidemiological practice, obesity is most commonly identified using the Body Mass Index (BMI), with a value of 30 kg/m² or higher serving as the standard threshold for classification. Although BMI is a convenient and widely used screening tool, it is important to recognize that it provides only an indirect estimate of body fat and does not account for variations in fat distribution, muscle mass, or individual metabolic differences. Despite these limitations, the classification of obesity as a BMI greater than 30 kg/m² has been instrumental in identifying populations at risk and guiding public health strategies. Individuals within this category are known to have an increased likelihood of developing a wide range of metabolic complications. These include insulin resistance, dyslipidemia, hypertension and ultimately metabolic syndrome, which collectively contribute to a higher risk of morbidity and mortality. The metabolic disturbances associated with obesity arise from complex interactions between adipose tissue, inflammatory mediators and hormonal imbalances, leading to systemic effects that extend far beyond simple weight gain. The health consequences of obesity are extensive and multifaceted. While it is widely recognized as a major risk factor for cardiovascular diseases such as ischemic heart disease, its impact is not confined to the cardiovascular system alone. Obesity is strongly associated with a variety of endocrine-related disorders, including type 2 diabetes mellitus, thyroid dysfunction and abnormalities in reproductive hormones. Excess adipose tissue acts as an active endocrine organ, secreting adipokines and cytokines that influence insulin sensitivity, appetite regulation and inflammatory pathways. These endocrine disruptions can lead to chronic metabolic imbalance and contribute to disease progression over time. In addition to metabolic and endocrine complications, obesity also affects the musculoskeletal system. The increased mechanical load placed on joints, particularly weight-bearing joints such as the knees and hips, can lead to degenerative conditions like osteoarthritis. Over time, this can result in reduced mobility, chronic pain and decreased quality of life. In more severe or prolonged cases, obesity-related physical inactivity may contribute to muscle wasting or conditions resembling muscular dysfunction, further compounding physical limitations. Furthermore, obesity is closely linked with a range of chronic illnesses that span multiple organ systems. These include non-alcoholic fatty liver disease (NAFLD), certain types of cancer, respiratory disorders such as obstructive sleep apnea and even neurodegenerative conditions. The chronic low-grade inflammation associated with excess adiposity plays a central role in the pathogenesis of many of these conditions. This persistent inflammatory state can impair normal cellular function and promote disease development over time. Ultimately, obesity represents a complex and systemic health condition with far-reaching consequences. Its characterization as excessive adiposity underscores the importance of understanding not just body weight, but the biological and metabolic implications of fat accumulation. While BMI remains a practical tool for classification, a broader perspective that includes metabolic health, hormonal balance and functional outcomes is essential for accurately assessing its impact. Recognizing the diverse complications associated with obesity highlights the need for comprehensive management strategies that address both its underlying causes and its wide-ranging effects on human health [7]. Obesity also lowers the life expectancy directly. Also, it is the worst risk factor for hospitalization and death related to corona virus disease 2019 (COVID-19). [8] Thus, smoking remains the leading risk factor for disease burden associated globally in many countries while high BMI has become the culprit in many regions, including Australasia and southwestern Latin America[9].
High body fat increases the risk of several dysfunctions such as diabetes, Hyperlipidaemia and hypertension that may lead to arteriosclerotic disease and metabolic syndrome [10]. Thus, there is a growing alarm concerning obesity, thereby increasing numbers of complications associated with cardiovascular, in both developed and developing countries can also cause adipocyte dysfunction and inflammation. Recently, an endocrine organ is a concept of adipose tissues as secretors of many hormones that regulate fat and glucose - adipokines as well as cytokines--adiponectin, leptin and tumor necrosis factor-α (TNF-α) [11],[12]. Consequently, an elevated concentration of TNF-α, followed by interleukin-6 (IL-6) and monocyte chemoattractant protein-1 (MCP-1), promotes adipocyte dysfunction and insulin resistance [13]. In addition, inflammatory cells infiltration into adipose tissues also increases [14]. Proinflammatory cytokines and oxidative stress play a central and interconnected role in the development of metabolic disturbances, particularly in the context of obesity and related disorders. Cytokines such as tumor necrosis factor-alpha (TNF-α), interleukin-6 (IL-6) and other inflammatory mediators are released in increased amounts from enlarged adipocytes and infiltrating immune cells, especially macrophages, within adipose tissue. This chronic low-grade inflammation is now recognized as a key driver of metabolic dysfunction, rather than merely a consequence of excess fat accumulation. These proinflammatory signals disrupt normal cellular communication and interfere with insulin signaling pathways, ultimately contributing to insulin resistance [15]. Insulin resistance is a hallmark of metabolic disorders such as type 2 diabetes mellitus. Under normal physiological conditions, insulin facilitates glucose uptake into cells, particularly in muscle and adipose tissue and suppresses glucose production in the liver. However, in an inflammatory environment, cytokines activate intracellular signaling pathways such as the nuclear factor-kappa B (NF-κB) pathway and c-Jun N-terminal kinase (JNK), which impair insulin receptor signaling. This leads to reduced glucose uptake by peripheral tissues and increased hepatic glucose output, resulting in elevated blood glucose levels. Over time, the pancreas compensates by producing more insulin, but this compensatory mechanism may eventually fail, leading to overt hyperglycemia. Oxidative stress further exacerbates these disturbances by generating an excess of reactive oxygen species (ROS) that overwhelm the body’s antioxidant defense systems. ROS are produced during normal cellular metabolism, but their levels increase significantly in conditions such as obesity, overnutrition and mitochondrial dysfunction. Elevated ROS can directly damage cellular components, including lipids, proteins and DNA and also act as signaling molecules that amplify inflammatory responses. This creates a vicious cycle in which oxidative stress promotes inflammation and inflammation in turn increases oxidative stress. The liver, adipose tissue and skeletal muscle are particularly affected by these processes, as they are central to metabolic regulation. In the liver, pro-inflammatory cytokines and oxidative stress contribute to hepatic insulin resistance and promote the accumulation of fat, leading to conditions such as non-alcoholic fatty liver disease (NAFLD). In adipose tissue, chronic inflammation alters adipokine secretion, reducing beneficial factors like adiponectin while increasing harmful ones, thereby impairing lipid and glucose metabolism. In skeletal muscle, which is a major site of glucose disposal, inflammation and oxidative damage reduce insulin sensitivity and mitochondrial function, limiting the tissue’s ability to utilize glucose efficiently. Moreover, these metabolic disturbances are closely linked to activation of the immune response. The infiltration of immune cells into metabolic tissues further amplifies the production of cytokines and perpetuates the inflammatory state. This crosstalk between metabolic and immune systems has led to the concept of “metaflammation,” a chronic, low-grade inflammatory condition driven by metabolic excess. Ultimately, the combined effects of pro-inflammatory cytokines and oxidative stress disrupt metabolic homeostasis across multiple organs, contributing to the progression of insulin resistance and associated chronic diseases [15, 16]. If there is an acute activation of inflammation pathways in hepatocytes, it results in local and systemic insulin resistance additionally [17, 18].
Bitter Melon is a climbing shrub that is mostly cultivated in Bangladesh, India, China and Korea, majorly in various Asian countries. The plant is also naturally spread in the tropical regions of Amazon, East Africa and the Caribbean. Bitter Melon is an inhabitant of the family Cucurbitaceae with the scientific name Momordica charantia L. Normally, two varieties of the plant are found in Bangladesh, with the small type being referred to locally as "Ucche" and the larger-size one as "Karela" (Figure 1). However, some other wild-type African species are also found in the country: M. balsamina L., M. foetida Schum and M. rostrata A. Zimm. Throughout Bangladesh and the Indian subcontinent, the bitter melon fruits are consumed as a culinary vegetable, although this plant is used as a traditional medicinal plant for the treatment of different diseases in such developing countries as Brazil, China, Colombia, Cuba, Ghana, Haiti, India, Mexico, Malaya, Nicaragua, Panama and Peru [19]. The most commonly known traditional use amongst many countries for this plant is the treatment of diabetes. It is also used for alleviating various other pathological conditions like dysmenorrhea, eczema, emmenagogue, galactagogue, gout, jaundice, kidney (stone), leprosy, leucorrhea, piles, pneumonia, psoriasis, rheumatism and scabies [20]. Momordica charantia has been used for abortifacient, anthelmintics, contraceptives, antimalarials and laxatives [20].
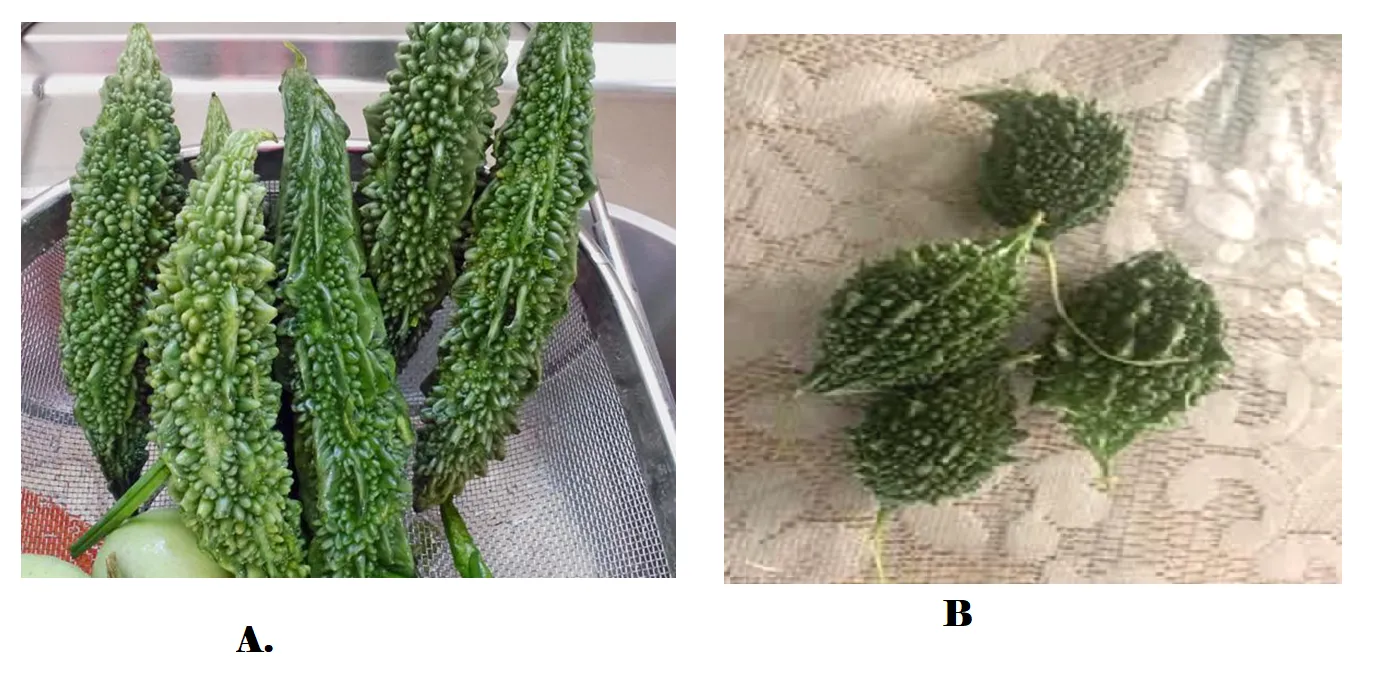
Figure 1: Fruits of different variety of Momordica charantia available in India (a) commonly known as Karela and (b) as Ucche
Bitter gourd components have been tested for potential biological activity in animals and in the clinic. Besides their antibacterial [21] and antiviral properties [22], bitter gourd extracts have also been shown to exert antitumor effects in different in-vivo models and are found to be effective against ulcers, malarias, pain and inflammation, psoriasis, dyslipidemia and hypertension. Momordica charantia is also known to contain important biologically active chemical compounds, paying tribute to glycosides, saponins, alkaloids, fixed oils, triterpenes, proteins and steroids [23]. Quite a number of bioactive chemical constituents have already been extracted from various parts of the plant, namely leaves, fruit pulp and seeds [24].
M. charantiacontents a number of chemical substances, including some nutritionally important vitamins, minerals, antioxidants and many other phytochemicals, that is, glycosides, saponins, phenolics constituents, fixed oils, alkaloids, reducing sugars, resins and free acids [25]. The immature fruits also contain vitamin C and provide vitamin A, phosphorus and iron [26]. Based on the chemical character of the isolated compounds, they can be classified into phenolics and flavonoid compounds, cucurbitane-type triterpenoids, cucurbitane-type triterpene glycoside, oleanane-type triterpene saponins and insulin-like peptides [27].
The other name of M. charantia includes bitter melon, bitter apple and karela; for its high
medicinal properties it has become a famous vegetable crop in Asian and African countries [28]. M. charantiais herbaceous, climbing tendrils that extend up to 6 m long. Leaves are generally with serrated margins and separated lobes. Both male and female flowers are yellow in color in most plants. The whole plant and fruits are used as remedy for centuries for blood sugar. Plants have several pharmacological properties such as anti-diabetic, anti-lipidemic, anti-tumorigenic, antiulcerogenic, antimalarial, etc. The leaves of M. charantia are rich in several minerals and vitamins [29]. Several compounds with therapeutic potentials documentedly effective in animal models for hypoglycemic effect are present in these leaves [30]. Chen et al. Isolated 14 different triterpenoids which included kuguacins' from M. charantia[31].
Taxonomic Classification:
Kingdom: Plantae
Division: Tracheophytes
Clade: Eudicots
Order: Cucurbitales
Family: Cucurbitaceae
Genus: Momordica
Species: M. charantia
MATERIALS AND METHODS
The materials used in this study included fresh mature fruits and healthy leaves of Momordica charantia, along with various solvents and reagents such as hexane, ethyl acetate, ethanol, hydroalcoholic mixture (70% ethanol:30% water), methanol, chloroform, Folin–Ciocalteu reagent, DPPH, ABTS, TPTZ, ferric chloride, sodium carbonate, sodium hydroxide, aluminum chloride, potassium persulfate, p-nitrophenyl palmitate (p-NPP) and Tris-HCl buffer. Standard compounds including gallic acid, quercetin, ascorbic acid and orlistat were used for comparison and calibration. Biological materials such as porcine pancreatic lipase and 3T3-L1 preadipocyte cell lines, along with insulin, dexamethasone and IBMX, were employed for anti-lipase and anti-adipogenic studies. The study also utilized laboratory equipment including a Soxhlet apparatus, rotary evaporator, freeze dryer, UV–Visible spectrophotometer, mechanical grinder, Whatman No. 1 filter paper, airtight containers and amber-colored storage vials for extraction, analysis and storage purposes.
Methodology
Plant Collection
Fresh,mature fruits and healthy leaves of Momordica charantia were collected from the field/local market during the appropriate harvesting season. Samples were cleaned thoroughly using distilled water to remove dirt and surface contaminants.
The collected plant materials were shade-dried at room temperature (25±2°C) to constant weight, then finely powdered using a mechanical grinder and stored in airtight containers until further use [36].
Extraction
Powdered Momordica charantia material was subjected to sequential extraction using solvents of varying polarity to obtain a comprehensive phytochemicals profile. The extraction process was primarily carried out using a Soxhlet apparatus. A known weight of the dried powder was packed into a thimble and sequentially extracted with solvents in the order of increasing polarity: starting with non-polar hexane for lipid removal, followed by ethyl acetate, ethanol and finally a Hydroalcoholic mixture (70% ethanol:30% water v/v). Each extraction cycle was continued for 6-8 hours, or until the solvent in the siphon arm became colorless, indicating exhaustive extraction. Concurrently, a separate ethyl acetate extract was prepared by cold maceration, where powdered material was soaked in distilled water at room temperature for 72 hours with intermittent stirring. All extracts were filtered through Whatman No. 1 filter paper and the solvents from the Soxhlet-derived extracts were removed under reduced pressure using a rotary evaporator at 40°C. The ethyl acetate extract was concentrated using a freeze-dryer. The resulting dried extracts were stored in amber-colored vials at 4°C until further phytochemical analysis and bioactivity testing [37].
Phytochemical Analysis
Qualitative Phytochemical Screening
The prepared extracts were subjected to standard qualitative phytochemical tests to identify the presence of major bioactive classes [38, 39, 40]. The screening protocols were as follows:
Alkaloids: Detected using Mayer’s, Wagner’s and Dragendorff’s reagents, where the formation of a cream, reddish-brown, or orange precipitate, respectively, indicated a positive result.
Flavonoid: Identified via the Shinoda test (using magnesium turnings and concentrated hydrochloric acid), which produced a pink, red, or orange coloration and the alkaline reagent test (using 10% sodium hydroxide), resulting in a yellow color that disappears upon acidification.
Saponins: Assessed through the froth test, where persistent foam formation after vigorous shaking of the extract in distilled water indicated positivity.
Steroids: Screened using the Liebermann–Burchard test, where the addition of acetic anhydride and concentrated sulfuric acid to the extract produced a greenish-blue color.
Tannins: Detected using a 1% ferric chloride solution, resulting in a blue-black or greenish-black coloration.
Terpenoids: Evaluated using the Salkowski test, where the extract was treated with chloroform and concentrated sulfuric acid to form a reddish-brown interface.
Quantitative Phytochemical Assays
The total phenolic and flavonoid contents of the most active extracts were quantified using standard colorimetric methods [38, 39, 40]:
Total Phenolic Content (TPC)
The total phenolic content (TPC) of the Momordica charantia extracts was determined using the well-established Folin–Ciocalteu colorimetric method, which is widely employed for the quantification of phenolic compounds due to its sensitivity and reproducibility. Phenolic compounds are known to play a crucial role in antioxidant activity, primarily through their ability to donate hydrogen atoms or electrons.
In this method, an aliquot (1 mL) of each extract solution at 1 mg/mL concentration was transferred into a test tube. To this, 5 mL of Folin–Ciocalteu reagent (previously diluted 1:10 with distilled water) was added and the mixture was allowed to stand for approximately 5 minutes at room temperature to facilitate the initial reaction. Subsequently, 4 mL of 7.5% sodium carbonate solution was added to neutralize the mixture and promote the development of a blue-colored chromophore resulting from the reduction of the Folin–Ciocalteu reagent by phenolic compounds. The reaction mixture was incubated in the dark at room temperature for 30 minutes to ensure complete color development. After incubation, the absorbance was measured at 765 nm using a UV–Visible spectrophotometer against a reagent blank. A standard calibration curve was constructed using gallic acid at 10 μg/mL, 20 μg/mL, 40 μg/mL, 60 μg/mL, 80 μg/mL and 100 μg/mL concentrations. The total phenolic content of the extracts was calculated from this calibration curve and expressed as milligrams of gallic acid equivalents per gram of dry extract (mg GAE/g). All determinations were carried out in triplicate and results were expressed as mean ± standard deviation.
Total Flavonoid Content (TFC)
The total flavonoid content (TFC) of the extracts was estimated using the aluminum chloride colorimetric method, which is based on the formation of a flavonoid–aluminum complex that produces a measurable color intensity.
Briefly, 1 mL of extract (1 mg/mL) solution was mixed with 4 mL of distilled water in a test tube. To this mixture, 0.3 mL of 5% sodium nitrite (NaNO₂) solution was added and allowed to stand for 5 minutes. Following this, 0.3 mL of 10% aluminum chloride (AlCl₃) solution was added and the mixture was incubated for an additional 6 minutes. Subsequently, 2 mL of 1 M sodium hydroxide (NaOH) was added to the reaction mixture and the final volume was adjusted to 10 mL with distilled water. The solution was thoroughly mixed to ensure uniform color development and the absorbance was measured at 510 nm using a UV–Visible spectrophotometer against a blank.
A calibration curve was prepared using quercetin (10 μg/mL, 20 μg/mL, 40 μg/mL, 60 μg/mL, 80 μg/mL and 100 μg/mL) as the standard reference compound. The total flavonoid content was calculated from the standard curve and expressed as milligrams of quercetin equivalents per gram of dry extract (mg QE/g). All experiments were performed in triplicate to ensure accuracy and reproducibility.
in-vitro Bioactivity Screening [41,42,43]
Antioxidant Assays
The antioxidant capacity was assessed using three complementary methods:
A) DPPH Radical Scavenging Assay
The antioxidant activity of Momordica charantia extracts was evaluated using the DPPH (2,2-diphenyl-1-picrylhydrazyl) radical scavenging assay, which is based on the reduction of DPPH radicals by antioxidants present in the extracts [44-53]. A freshly prepared 0.1 mM DPPH solution in methanol was used for the assay. The extracts (aqueous, ethanolic and hydroalcoholic) and the standard antioxidant ascorbic acid were prepared at concentrations of 25 µg/mL, 50 µg/mL and 100 µg/mL.
For the experiment, 2 mL of DPPH solution was mixed with 3 mL of extract or standard solution at the respective concentrations. A control containing DPPH solution and methanol (without extract) was also prepared. The reaction mixtures were incubated in the dark at room temperature for 30 minutes to allow the reaction between DPPH radicals and antioxidants. After incubation, the absorbance was measured at 517 nm using a UV–Visible spectrophotometer against a blank. The percentage inhibition of DPPH radicals was calculated. Finally, the IC₅₀ value (concentration required to scavenge 50% of DPPH radicals) was determined by plotting percentage inhibition against concentration.
B) ABTS Radical Cation Decolorization Assay
The ABTS assay was performed to evaluate the ability of extracts to scavenge the ABTS radical cation [54-63]. The ABTS radical was generated by reacting 7 mM ABTS solution with 2.45 mM potassium persulfate and incubating the mixture in the dark at room temperature for 12–16 hours. Prior to use, the solution was diluted with ethanol to obtain an absorbance of approximately 0.70 at 734 nm.
Extracts and ascorbic acid were prepared at concentrations of 25 µg/mL, 50 µg/mL and 100 µg/mL. For the assay, 1 mL of ABTS working solution was mixed with 1 mL of extract or standard solution. A control containing ABTS solution without extract was also maintained. The reaction mixture was incubated at room temperature for 6 minutes, after which the absorbance was recorded at 734 nm. The percentage inhibition of ABTS radicals was calculated and IC₅₀ value was determined from the dose-response curve.
C) Ferric Reducing Antioxidant Power (FRAP) Assay
The FRAP assay was carried out to determine the reducing power of the extracts based on their ability to reduce ferric ions (Fe³⁺) to ferrous ions (Fe²⁺) [64-73]. The FRAP reagent was freshly prepared by mixing acetate buffer (pH 3.6), TPTZ solution and ferric chloride solution in appropriate proportions and pre-warmed at 37°C. Extracts and ascorbic acid were prepared at concentrations of 25 µg/mL, 50 µg/mL and 100 µg/mL. For the assay, 1 mL of extract or standard solution was mixed with 2 mL of FRAP reagent. The reaction mixture was incubated at 37°C for 10 minutes, allowing the formation of a blue-colored Fe²⁺–TPTZ complex. The absorbance was measured at 593 nm using a UV–Visible spectrophotometer. The percentage inhibition was calculated and IC₅₀ value was determined from the dose-response curve.
Pancreatic Lipase Inhibition Assay (Anti-Lipase Activity)
The inhibitory potential of M. charantia extracts against pancreatic lipase was evaluated spectrophotometrically using p-nitrophenyl palmitate (p-NPP) as the substrate [74-79]. Briefly, extracts at varying concentrations were pre-incubated with porcine pancreatic lipase solution in Tris-HCl buffer (pH 8.2) for 10 minutes at 37°C. The reaction was initiated by adding p-NPP substrate and incubated for 30 minutes at 37°C. The hydrolysis of p-NPP to p-nitrophenol was measured at 405 nm. Orlistat was used as a positive control. The percentage inhibition was calculated and the IC50 value (concentration causing 50% inhibition) was determined from dose-response curves.
Anti-Adipogenic Assay (3T3-L1 Cell Model)
The effect of extracts on lipid accumulation was assessed using the 3T3-L1 preadipocyte cell line [80-85]. Cells were differentiated into adipocytes using a standard hormonal cocktail (insulin, dexamethasone and IBMX). During differentiation, cells were treated with non-toxic concentrations of the extracts. After 8–10 days, intracellular lipid accumulation was quantified by Oil Red O staining: cells were fixed, stained with Oil Red O solution and the dye was extracted with isopropanol for measurement at 520 nm. The percentage reduction in lipid accumulation compared to the differentiated control was calculated. Adiponectin secretion and expression of key adipogenic markers (e.g., PPAR-γ, C/EBP-α) were also analyzed via ELISA and/or qRT-PCR.
Data Analysis and Statistical Methodology [86]
Calculation of Bioactivity Endpoints
For each in-vitro assay, key quantitative endpoints were determined:
Percentage Inhibition: Calculated for lipase inhibition and antioxidant assays using the formula:
% Inhibition = [(Abscontrol – Abssample) / Abscontrol] × 100.
IC50 Values: The half-maximal inhibitory concentration (IC50) for pancreatic lipase inhibition and DPPH/ABTS radical scavenging was derived by fitting dose-response data to a linear regression equation.
Adipocyte Lipid Accumulation: Quantified as the percentage reduction relative to the fully differentiated control group.
Statistical Analysis
All experiments were performed in at least triplicate (n ≥ 3) and results are presented as mean ± standard deviation (SD). Statistical significance was evaluated using one-way analysis of variance (ANOVA) followed by Tukey’s post-hoc test for multiple comparisons between extract doses and control groups. A p-value of < 0.05 was considered statistically significant SPSS® software (version 27.0) or GraphPad Prism®.
RESULTS AND DISCUSSION:
Extraction of Momordica charantia
The percentage yield of different solvent extracts of Momordica charantia is presented in the table 1. Among the three extracts, the hydroalcoholic extract showed the highest yield (15.2 ± 0.94% w/w), followed by the ethanolic extract (12.4 ± 0.76% w/w), while the ethyl acetate extract exhibited the lowest yield (10.6 ± 0.62% w/w).
Table 1: Extraction and Yield value of Extracts of Momordica charantia.
|
Extract Type |
Yield (% w/w) |
|
Ethanolic extract |
12.4 |
|
Hydroalcoholic extract |
15.2 |
|
Ethyl acetate extract |
10.6 |
The higher yield obtained with the hydroalcoholic solvent system may be attributed to its intermediate polarity, which enables the extraction of a wider range of phytoconstituents, including both polar and moderately non-polar compounds. In contrast, ethyl acetate extract ion primarily dissolves highly polar compounds, while ethanol extracts moderately polar constituents, resulting in comparatively lower yields.
These findings indicate that the hydroalcoholic solvent system is more efficient for extracting bioactive constituents from Momordica charantia, making it a suitable choice for further phytochemical and pharmacological investigations.
Qualitative Phytochemical Analysis of Momordica charantia
The preliminary phytochemical screening of different extracts of Momordica charantia revealed the presence and absence of various bioactive constituents, as summarized in Table 2.
Table 2: Phytochemical analysis of extracts of Momordica charantia.
|
Phytoconstituent |
Ethanolic extract |
Hydroalcoholic extract |
Ethyl acetate extract |
|
Alkaloids |
+ |
+ |
- |
|
Flavonoids |
+ |
+ |
+ |
|
Saponins |
- |
+ |
+ |
|
Tannins and Phenolic Compounds |
+ |
+ |
+ |
|
Volatile oils |
- |
- |
- |
|
Steroids |
+ |
+ |
- |
Note: Results are represented “+”as Positive and “-” as Negative.
The ethanolic extract showed the presence of alkaloids, flavonoids, tannins and phenolic compounds and steroids, while saponins and volatile oils were absent. The hydroalcoholic extract demonstrated the presence of alkaloids, saponins, tannins and phenolic compounds and steroids, but lacked flavonoids and volatile oils. In contrast, the ethyl acetate extract contained flavonoids, saponins and tannins and phenolic compounds, whereas alkaloids, steroids and volatile oils were not detected.
Notably, tannins and phenolic compounds were present in all three extracts, indicating that these compounds are abundantly distributed in Momordica charantia and are readily extractable irrespective of solvent polarity. The variation in the presence of other phytoconstituents among the extracts can be attributed to differences in solvent polarity and solubility of phytochemicals. Ethanol, being moderately polar, efficiently extracted alkaloids and steroids, while the hydroalcoholic solvent system facilitated the extraction of a broader range of constituents, including saponins. Ethyl acetate extraction favored the isolation of highly polar compounds such as flavonoids and saponins.
The absence of volatile oils in all extracts suggests that Momordica charantia may contain negligible amounts of these constituents or that they were not extractable under the conditions used.
Quantitative Analysis of Momordica charantia
The total phenolic content (TPC) and total flavonoid content (TFC) of different extracts of Momordica charantia are presented in Table 3. The results are expressed as mean ± standard deviation (n=3), with TPC in terms of gallic acid equivalents (GAE) and TFC in terms of quercetin equivalents (QE), calculated from standard calibration curve (Figure 1).
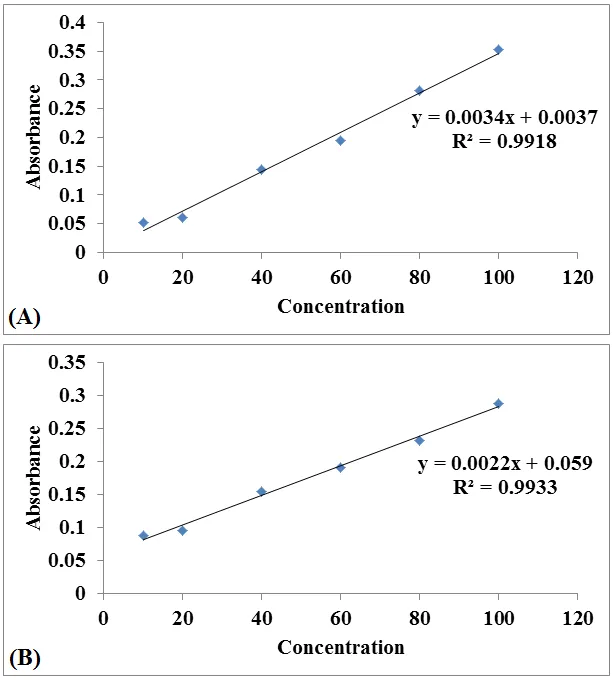
Figure 1: Standard calibration curve of (A) Gallic acid for total phenolic content and (B) Quercetin for total flavonoid content.
Among the extracts, the hydroalcoholic extract exhibited the highest TPC (112.75 ± 3.58 mg GAE/g) and TFC (89.61 ± 2.42 mg QE/g), followed by the ethanolic extract with TPC of 85.46 ± 2.14 mg GAE/g and TFC of 62.36 ± 1.82 mg QE/g. The ethyl acetate extract showed the lowest values, with TPC of 74.24 ± 1.96 mg GAE/g and TFC of 58.12 ± 1.68 mg QE/g (Table 3).
Table 3: Total Phenolic Content and Total Flavonoid Content of extracts of Momordica charantia.
|
Extract |
TPC (mg GAE/g) |
TFC (mg QE/g) |
|
Ethanolic extract |
85.46 ± 2.14 |
62.36 ± 1.82 |
|
Hydroalcoholic extract |
112.75 ± 3.58 |
89.61 ± 2.42 |
|
Ethyl acetate extract |
74.24 ± 1.96 |
58.12 ± 1.68 |
Note: Results are represented as mean ± standard deviation (n=3). TPC- Total Phenolic Content; TFC- Total Flavonoid Content; GAE- Gallic Acid Equivalent; QE- Quercetin Equivalent.
Data are expressed as mean ± SD (n = 3). Differences among extracts were analyzed using one-way ANOVA followed by Tukey's post-hoc test. Values were considered statistically significant at p < 0.05
The higher phenolic and flavonoid content in the hydroalcoholic extract may be attributed to the synergistic effect of water and ethanol, which enhances the extraction efficiency of both polar and moderately polar phytoconstituents. Phenolic compounds and flavonoids are known to be key contributors to antioxidant activity and their higher concentration in the hydroalcoholic extract suggests its superior potential in exhibiting antioxidant and free radical scavenging properties.
The comparatively lower values observed in the ethyl acetate extract indicate that water alone may not be as effective in extracting a broad spectrum of phenolic and flavonoid compounds, while ethanol shows moderate efficiency.
Antioxidant activity of extracts of Momordica charantia
A) DPPH Radical Scavenging Assay
The antioxidant activity of different extracts of Momordica charantia was evaluated using the DPPH radical scavenging assay and the results are presented in Table 4 and Figures 2 and 3. All extracts exhibited a concentration-dependent increase in percentage inhibition, indicating that the free radical scavenging ability improves with increasing concentration.
At 25 µg/mL, the ethyl acetate extract (45.38%) showed slightly higher antioxidant activity compared to the ethanolic (42.18%) and hydroalcoholic extracts (40.12%). This suggests that water-soluble phytoconstituents contribute significantly to the initial antioxidant effect. At 50 µg/mL, a notable increase in activity was observed for all extracts, with the ethyl acetate extract (62.84%) again demonstrating superior activity, followed by the ethanolic (58.67%) and hydroalcoholic extracts (58.36%). At the highest concentration (100 µg/mL), the ethyl acetate extract exhibited the maximum inhibition (83.96%), followed by the ethanolic extract (78.38%) and hydroalcoholic extract (75.82%). The standard drug, ascorbic acid, showed significantly higher antioxidant activity at all tested concentrations, reaching 91.97% inhibition at 100 µg/mL (Table 4), thereby validating the experimental model.
Table 4: Antioxidant activity of extracts of Momordica charantia by DPPH scavenging assay.
|
Concentration (µg/mL) |
% Inhibition |
|||
|
Ethanolic extract |
Hydroalcoholic extract |
Ethyl acetate extract |
Ascorbic acid |
|
|
25 |
42.18 ± 1.26 |
40.12 ± 1.12 |
45.38 ± 1.96 |
56.81 ± 1.42 |
|
50 |
58.67 ± 2.36 |
58.36 ± 1.98 |
62.84 ± 2.92 |
72.03 ± 3.25 |
|
100 |
78.38 ± 2.26 |
75.82 ± 2.56 |
83.96 ± 3.42 |
91.97 ± 3.52 |
Note: Results are represented as mean ± standard deviation (n=3).
The antioxidant potential of different extracts of Momordica charantia was quantitatively assessed determining IC₅₀ values serve as the primary indicator of efficacy calculated from Inhibitory concentration curve (Figure 2). The IC₅₀ value represents the concentration of extract required to inhibit 50% of DPPH free radicals; therefore, lower IC₅₀ values correspond to higher antioxidant activity.
As depicted in Figure 3, the hydroalcoholic extract exhibited the lowest IC₅₀ value (30.28 µg/mL), indicating superior free radical scavenging activity among all tested extracts. This enhanced activity may be attributed to the synergistic extraction of both polar and moderately non-polar phytoconstituents, such as phenolics and flavonoids, which are known contributors to antioxidant potential. The ethyl acetate extract demonstrated a moderate IC₅₀ value (37.61 µg/mL), suggesting appreciable antioxidant activity likely due to the presence of water-soluble phenolic compounds. In contrast, the ethanolic extract showed a comparatively higher IC₅₀ value (40.64 µg/mL), indicating lower antioxidant efficiency among the plant extracts studied.
Notably, the standard antioxidant, ascorbic acid, exhibited a significantly lower IC₅₀ value (6.89 µg/mL), confirming its strong radical scavenging capacity and serving as a benchmark for comparison. The marked difference between ascorbic acid and the plant extracts highlights that, although Momordica charantia possesses considerable antioxidant potential, it is less potent than the pure standard compound.
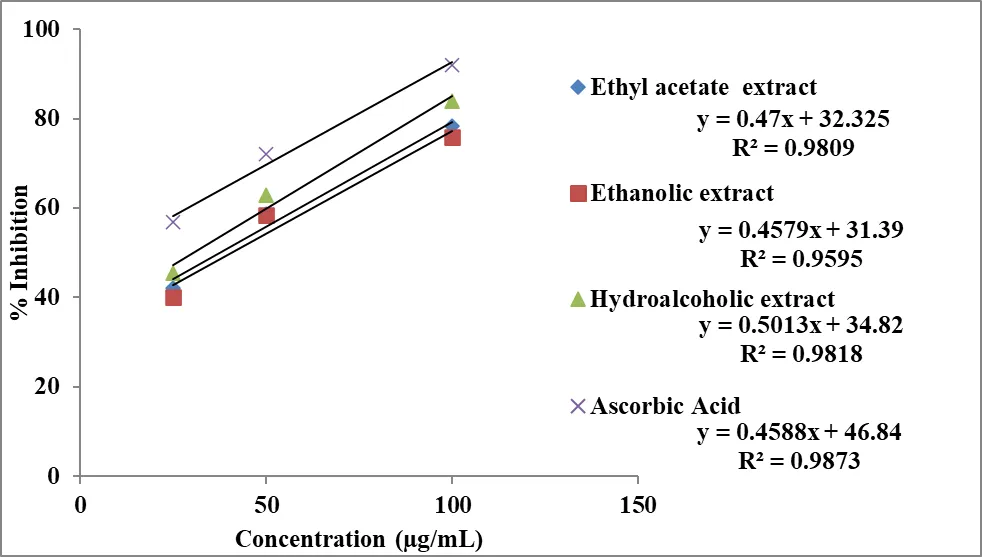
Figure 2: Inhibitory concentration curve of extract of Momordica charantia and Ascorbic acid in DPPH scavenging assay.
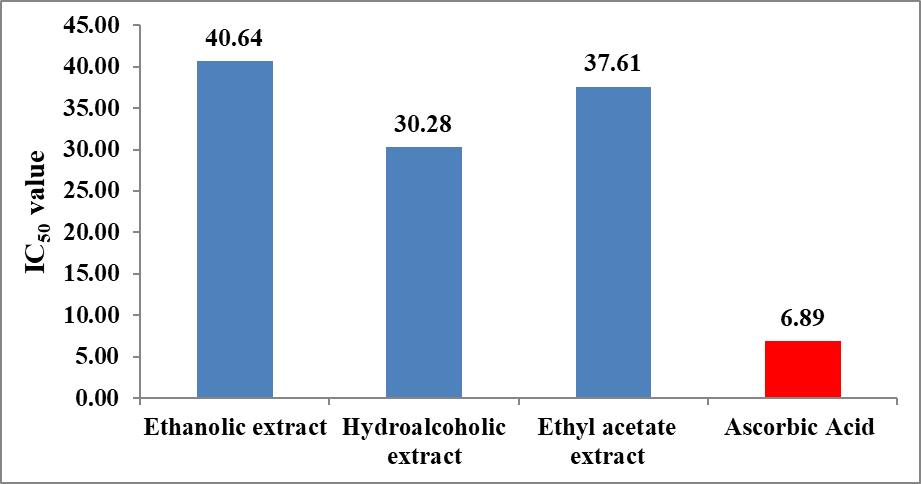
Figure 3: Antioxidant efficacy of extract of Momordica charantia by DPPH scavenging assay.
The IC₅₀ trend observed in Figure 3 follows the order: Ascorbic acid > Hydroalcoholic extract > Ethyl acetate extract > Ethanolic extract, clearly demonstrating that the hydroalcoholic extract is the most effective among the tested plant extracts in neutralizing DPPH radicals. These findings support the hypothesis that solvent polarity plays a critical role in extracting bioactive antioxidant compounds
B) ABTS Radical Cation Decolorization Assay
The antioxidant potential of different extracts of Momordica charantia was further evaluated using the ABTS radical cation decolorization assay and the results are presented in Table 5 and Figures 4 and 5. All extracts demonstrated a concentration-dependent increase in percentage inhibition, indicating progressive scavenging of ABTS⁺ radicals with increasing concentration.
At 25 µg/mL, the ethyl acetate extract exhibited the highest inhibition (29.18%), followed by the hydroalcoholic (25.19%) and ethanolic extracts (22.25%), suggesting that polar phytoconstituents contribute significantly to ABTS radical scavenging at lower concentrations. At 50 µg/mL, the activity increased markedly, with the ethyl acetate extract (52.41%) maintaining superiority, followed by hydroalcoholic (42.85%) and ethanolic extracts (41.72%). At 100 µg/mL, maximum inhibition was observed for the ethyl acetate extract (77.92%), followed by hydroalcoholic (63.73%) and ethanolic extracts (61.16%). The standard, ascorbic acid, showed significantly higher activity at all concentrations, reaching 84.65% inhibition at 100 µg/mL (Table 5), validating the assay system.
Table 5: Antioxidant activity of extracts of Momordica charantia by ABTS radical cation decolorization assay.
|
Concentration (µg/mL) |
% Inhibition |
|||
|
Ethanolic extract |
Hydroalcoholic extract |
Ethyl acetate extract |
Ascorbic acid |
|
|
25 |
22.25 ± 0.96 |
25.19 ± 1.18 |
29.18 ± 1.56 |
38.34 ± 1.95 |
|
50 |
41.72 ± 1.76 |
42.85 ± 1.76 |
52.41 ± 2.16 |
58.56 ± 2.44 |
|
100 |
61.16 ± 2.39 |
63.73 ± 2.52 |
77.92 ± 2.54 |
84.65 ± 2.96 |
Note: Results are represented as mean ± standard deviation (n=3).
The antioxidant efficacy was further quantified using IC₅₀ values derived from the inhibitory concentration curve (Figure 4). As shown in Figure 5, the hydroalcoholic extract exhibited the lowest IC₅₀ value (30.28 µg/mL), indicating the highest antioxidant activity among the extracts. The ethyl acetate extract showed a moderate IC₅₀ value (37.61 µg/mL), while the ethanolic extract demonstrated comparatively lower activity with a higher IC₅₀ value (40.64 µg/mL).
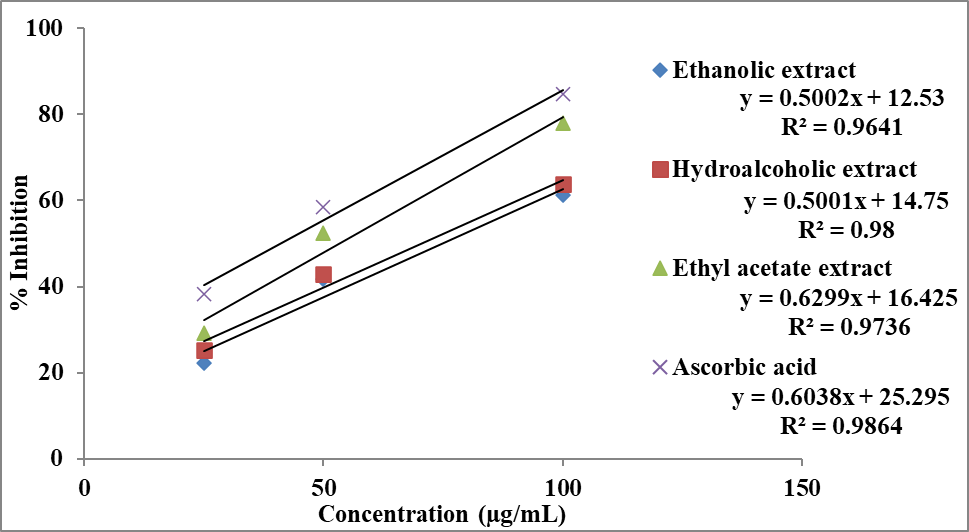
Figure 4: Inhibitory concentration curve of extract of Momordica charantia and Ascorbic acid in ABTS radical cation decolorization assay.
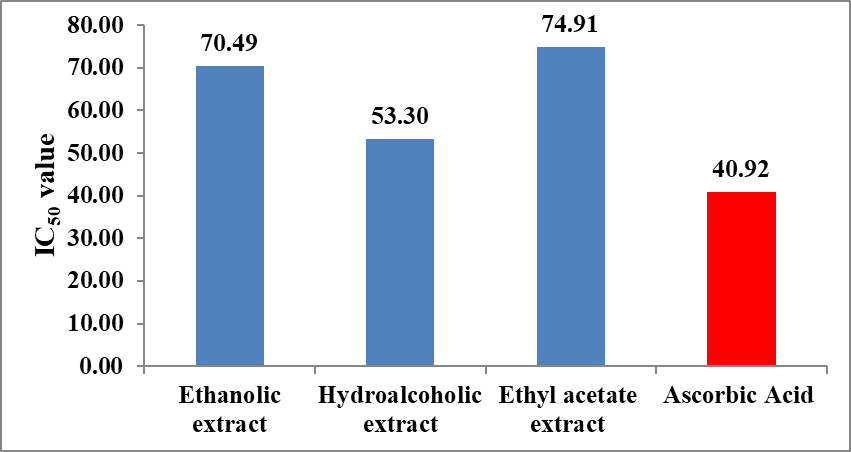
Figure 5: Antioxidant efficacy of extract of Momordica charantia by ABTS radical cation decolorization assay.
Ascorbic acid exhibited a markedly lower IC₅₀ value (6.88 µg/mL), confirming its superior radical scavenging capacity. The IC₅₀ trend observed in Figure 5 follows the order:
Ascorbic acid > Hydroalcoholic extract > Ethyl acetate extract > Ethanolic extract, indicating that the hydroalcoholic extract is the most efficient among the plant extracts. This enhanced activity may be attributed to the combined extraction of both hydrophilic and lipophilic antioxidant compounds, such as phenolics and flavonoids.
C) Ferric Reducing Antioxidant Power (FRAP) Assay
The reducing power of Momordica charantia extracts was assessed using the FRAP assay and the results are summarized in Table 6 and Figures 6 and 7. Similar to DPPH and ABTS assays, all extracts exhibited a dose-dependent increase in reducing power, reflecting their electron-donating capacity.
At 25 µg/mL, the ethyl acetate extract showed the highest activity (40.65%), followed by hydroalcoholic (35.27%) and ethanolic extracts (26.84%). At 50 µg/mL, the ethyl acetate extract (57.92%) again demonstrated the highest reducing power, followed by ethanolic (52.13%) and hydroalcoholic extracts (48.78%). At 100 µg/mL, the ethyl acetate extract exhibited maximum activity (82.38%), followed by ethanolic (74.56%) and hydroalcoholic extracts (67.94%). The standard ascorbic acid showed the highest activity overall, reaching 92.21% at 100 µg/mL (Table 6).
Table 6: Antioxidant activity of extracts of Momordica charantia by FRAP assay.
|
Concentration (µg/mL) |
% Inhibition |
|||
|
Ethanolic extract |
Hydroalcoholic extract |
Ethyl acetate extract |
Ascorbic acid |
|
|
25 |
26.84 ± 1.08 |
35.27 ± 1.25 |
40.65 ± 1.52 |
51.12 ± 2.14 |
|
50 |
52.13 ± 2.42 |
48.78 ± 1.68 |
57.92 ± 2.58 |
72.48 ± 2.86 |
|
100 |
74.56 ± 2.76 |
67.94 ± 2.52 |
82.38 ± 2.86 |
92.21 ± 2.88 |
Note: Results are represented as mean ± standard deviation (n=3).
The IC₅₀ values obtained from the inhibitory concentration curve (Figure 6) provide a quantitative comparison of reducing power. As illustrated in Figure 7, the hydroalcoholic extract showed the lowest IC₅₀ value (53.30 µg/mL), indicating comparatively higher reducing power among the extracts. The ethanolic (70.49 µg/mL) and ethyl acetate extract (74.91 µg/mL) exhibited higher IC₅₀ values, suggesting lower reducing efficiency. Ascorbic acid showed the lowest IC₅₀ value (40.92 µg/mL), confirming its strong electron-donating ability. The IC₅₀ trend for the FRAP assay follows: Ascorbic acid > Hydroalcoholic extract > Ethanolic extract > Ethyl acetate extract.
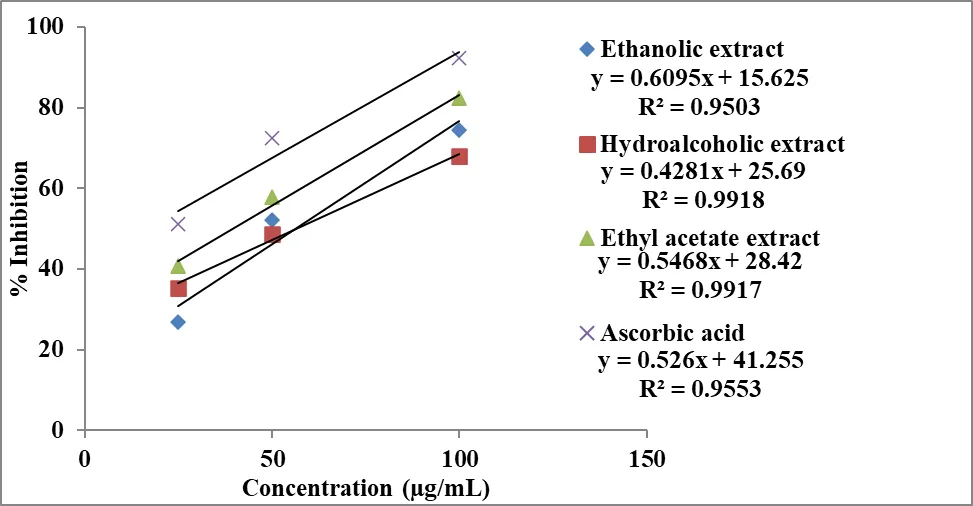
Figure 6: Inhibitory concentration curve of extract of Momordica charantia and Ascorbic acid in FRAP assay.
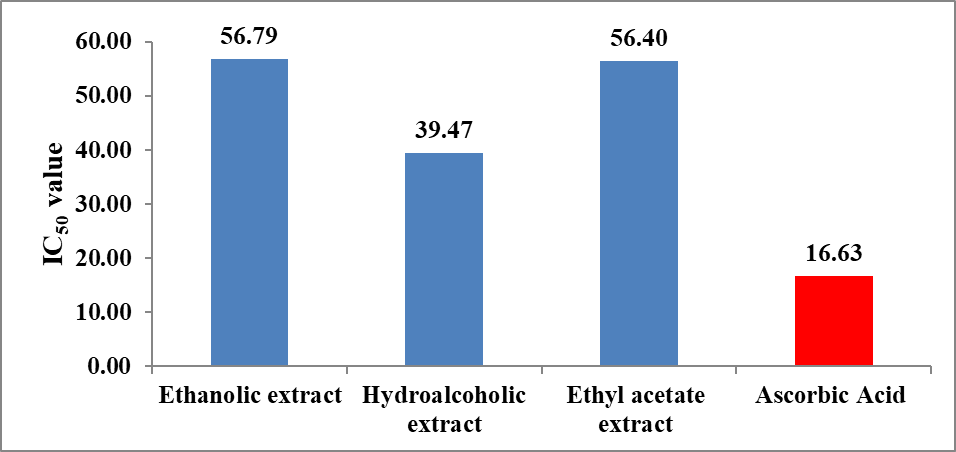
Figure 7: Antioxidant efficacy of extract of Momordica charantia by FRAP assay.
The antioxidant activity of Momordica charantia extracts was systematically evaluated using DPPH, ABTS and FRAP assays, which collectively assess free radical scavenging ability and reducing power. The results from all three assays demonstrated a clear concentration-dependent increase in antioxidant activity, indicating that the extracts possess significant power to neutralize reactive species (Tables 4–6; Figures 2–7). This confirms the presence of bioactive phytoconstituents contributing to the overall antioxidant potential of the plant.
IC₅₀ values indicated that the hydroalcoholic extract possesses superior antioxidant efficacy. It exhibited the lowest IC₅₀ values in DPPH (30.28 µg/mL), ABTS (30.28 µg/mL) and FRAP (53.30 µg/mL) assays, demonstrating that a lower concentration of this extract is required to achieve 50% antioxidant activity. In comparison, the ethyl acetateand ethanolic extracts showed relatively higher IC₅₀ values, indicating lower potency. Thus, the hydroalcoholic extract is identified as the most effective antioxidant fraction.
The enhanced activity of the hydroalcoholic extract can be attributed to its ability to extract a broader spectrum of phytoconstituents, including both polar and moderately non-polar compounds. This results in a synergistic effect of bioactive molecules such as phenolics and flavonoids, which are well known for their antioxidant properties. The findings also correlate with phytochemical content, further supporting the role of these compounds in antioxidant activity.
Pancreatic Lipase Inhibition Assay (Anti-Lipase Activity)
The anti-lipase activity of different extracts of Momordica charantia was evaluated using the pancreatic lipase inhibition assay and the results are presented in Table 7 and Figures 8 and 9. All extracts exhibited a concentration-dependent increase in percentage inhibition, indicating that the ability to inhibit pancreatic lipase improves with increasing concentration.
At 50 µg/mL, the hydroalcoholic extract (30.92%) showed higher inhibitory activity compared to the ethanolic (22.15%) and ethyl acetate extract s (20.22%), suggesting the presence of active phytoconstituents capable of inhibiting lipid digestion. At 100 µg/mL, a marked increase in inhibition was observed, with the hydroalcoholic extract (52.01%) maintaining superior activity, followed by ethanolic (38.73%) and ethyl acetate extract s (34.84%). At the highest concentration (200 µg/mL), the hydroalcoholic extract demonstrated the maximum inhibition (70.94%), followed by ethanolic (55.35%) and ethyl acetate extract s (53.28%). The standard drug, orlistat, showed significantly higher inhibition at all concentrations, reaching 82.93% at 200 µg/mL (Table 7), thereby validating the experimental model.
Table 7: Anti-lipase activity of extracts of Momordica charantia by pancreatic lipase inhibition assay.
|
Concentration (µg/mL) |
% Inhibition |
|||
|
Ethanolic extract |
Hydroalcoholic extract |
Ethyl acetate extract |
Orlistat |
|
|
50 |
22.15 ± 0.98 |
30.92 ± 1.06 |
20.22 ± 1.12 |
45.06 ± 1.58 |
|
100 |
38.73 ± 1.09 |
52.01 ± 1.56 |
34.84 ± 1.22 |
65.12 ± 1.78 |
|
200 |
55.35 ± 1.67 |
70.94 ± 1.74 |
53.28 ± 1.62 |
82.93 ± 1.94 |
Note: Results are represented as mean ± standard deviation (n=3).
The inhibitory potential was further quantified using IC₅₀ values derived from the inhibitory concentration curve (Figure 8). As illustrated in Figure 9, the hydroalcoholic extract exhibited the lowest IC₅₀ value (111.63 µg/mL) among the plant extracts, indicating superior anti-lipase activity. The ethanolic (169.36 µg/mL) and ethyl acetate extract s (181.14 µg/mL) showed comparatively higher IC₅₀ values, reflecting lower potency. The standard drug orlistat displayed the lowest IC₅₀ value (57.26 µg/mL), confirming its strong lipase inhibitory activity.
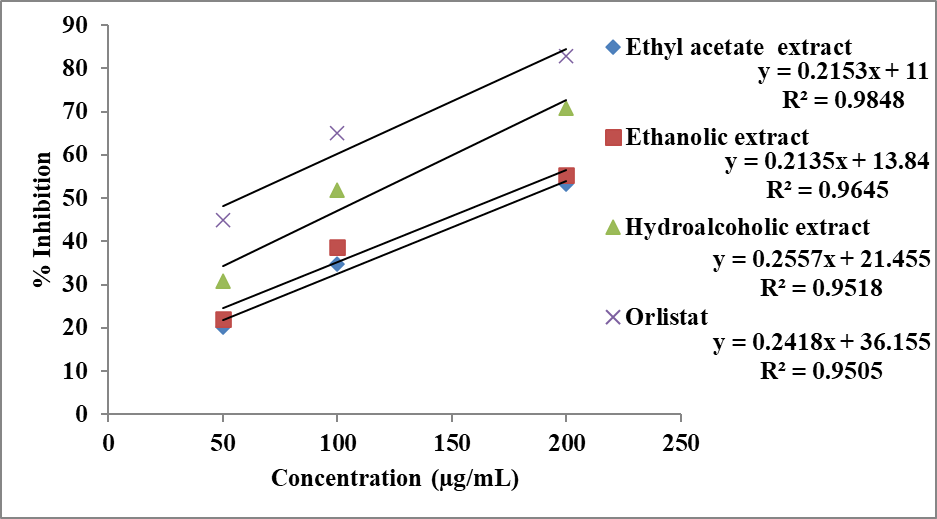
Figure 8: Inhibitory concentration curve of extract of Momordica charantia and orlistat in pancreatic lipase inhibition assay.
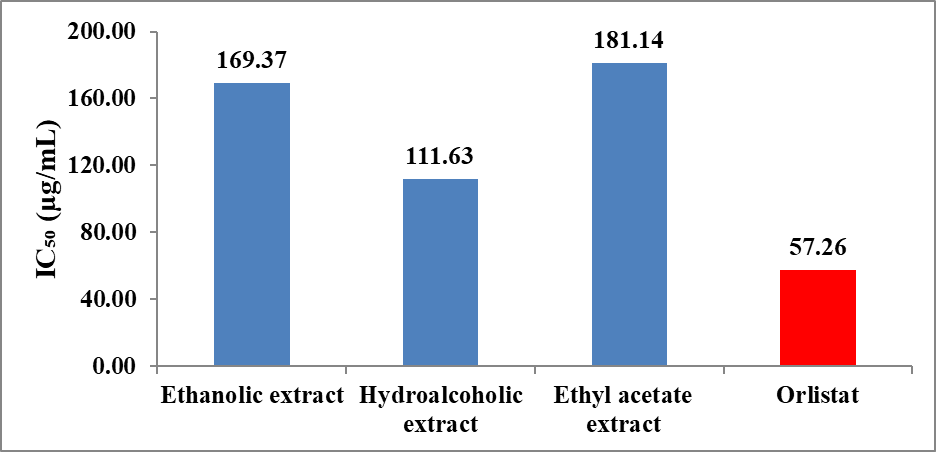
Figure 9: Anti-lipase activity of extract of Momordica charantia by pancreatic lipase inhibition assay.
The IC₅₀ trend observed follows the order: Orlistat > Hydroalcoholic extract > Ethanolic extract > Ethyl acetate extract , indicating that the hydroalcoholic extract is the most effective among the plant extracts. This enhanced activity may be attributed to the synergistic extraction of bioactive compounds, such as phenolics and flavonoids, which are known to inhibit pancreatic lipase by interacting with the enzyme’s active site and reducing fat hydrolysis.
Anti-Adipogenic Assay:
The anti-adipogenic potential of Momordica charantia extracts was assessed using the 3T3-L1 cell line model and the results are presented in Table 8 and Figure 10. The assay measures the ability of extracts to inhibit lipid accumulation in adipocytes, which is a key indicator of anti-obesity activity.
The control group exhibited 100% lipid accumulation, representing normal adipocyte differentiation. All extracts showed a significant reduction in lipid accumulation, indicating inhibition of adipogenesis. Among the extracts, the hydroalcoholic extract demonstrated the lowest lipid accumulation (45.62%), followed by the ethyl acetate extract (61.54%) and ethanolic extract (68.51%). The standard drug showed the highest inhibition, reducing lipid accumulation to 30.16% (Table 8).
Table 8: Anti-adipogenic activity of extracts of Momordica charantia using 3T3-L1 cell.
|
Sample |
Lipid Accumulation (%) |
|
Control |
100 |
|
Ethanolic extract |
68.51 ± 2.43 |
|
Hydroalcoholic extract |
45.62 ± 1.81 |
|
Ethyl acetate extract |
61.54 ± 1.98 |
|
Standard (Drug) |
30.16 ± 1.45 |
Note: Results are represented as mean ± standard deviation (n=3).
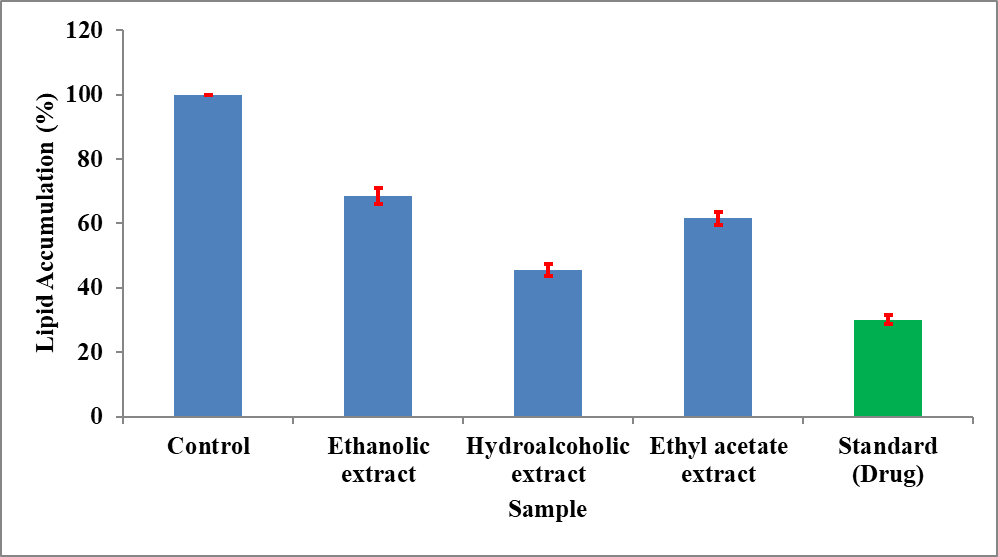
Figure 10: Anti-adipogenic property of extracts of Momordica charantia using 3T3-L1 cell model.
The results clearly indicate that the hydroalcoholic extract exhibits the strongest anti-adipogenic activity among the plant extracts. The reduction in lipid accumulation suggests that the extract may interfere with adipocyte differentiation and lipid storage processes. This effect may be attributed to the presence of bioactive compounds that regulate key transcription factors involved in adipogenesis, such as PPAR-γ and C/EBP-α, thereby inhibiting fat cell formation.
DISCUSSION
The present investigation was undertaken to systematically evaluate the antioxidant and anti-obesity potential of standardized extracts of Momordica charantia using a combination of phytochemical analysis, in vitro antioxidant assays, pancreatic lipase inhibition and anti-adipogenic studies. The integrated approach adopted in this study provides a comprehensive understanding of the relationship between phytochemical composition and biological activity, thereby addressing the existing research gap concerning standardization and mechanistic validation of this traditionally important medicinal plant.
The extraction yield data (Table 1) demonstrated that the hydroalcoholic extract yielded the highest percentage (15.2% w/w), followed by ethanolic (12.4% w/w) and ethyl acetate extract s (10.6% w/w). This finding highlights the critical role of solvent polarity in the extraction of phytoconstituents. Hydroalcoholic solvents, due to their intermediate polarity, are capable of dissolving a broader spectrum of compounds, including both hydrophilic and moderately lipophilic constituents. This observation is consistent with previous reports indicating that mixed solvent systems enhance extraction efficiency and yield a more diverse phytochemical profile [36].
The higher yield of the hydroalcoholic extract suggests that it may contain a richer reservoir of bioactive compounds, which subsequently contributes to its superior biological activity. This reinforces the importance of selecting appropriate extraction methods in phytopharmacological studies, particularly when the objective is to maximize therapeutic efficacy.
Qualitative phytochemical screening (Table 2) revealed the presence of alkaloids, flavonoids, tannins, saponins and steroids across different extracts. Notably, tannins and phenolic compounds were detected in all extracts, indicating their widespread distribution in M. charantia. However, the hydroalcoholic extract exhibited a more diverse phytochemical composition, including saponins and alkaloids, which are known to possess significant pharmacological activities.
The quantitative estimation of TPC and TFC (Table 3; Figure 1) further substantiated these findings, with the hydroalcoholic extract exhibiting the highest phenolic (112.75 mg GAE/g) and flavonoid content (89.61 mg QE/g) . Phenolic compounds are widely recognized for their antioxidant properties, primarily due to their ability to donate hydrogen atoms and electrons, thereby neutralizing free radicals [17]. Flavonoids, on the other hand, contribute through multiple mechanisms, including radical scavenging, metal chelation and modulation of enzyme activity.
The higher concentration of these bioactive compounds in the hydroalcoholic extract provides a biochemical basis for its enhanced antioxidant and anti-obesity activities. Furthermore, the presence of saponins and triterpenoids, as reported in previous studies [23], may contribute to lipid metabolism regulation and enzyme inhibition, thereby supporting the observed anti-obesity effects.
The antioxidant potential of M. charantia extracts was evaluated using three complementary assays such as DPPH, ABTS and FRAP (Tables 4 to 6; Figures 2 to 7) . These assays collectively assess different aspects of antioxidant activity, including free radical scavenging and reducing power.
In the DPPH assay (Table 4; Figures 2 and 3), all extracts exhibited a concentration-dependent increase in radical scavenging activity. Although the ethyl acetate extract showed higher percentage inhibition at certain concentrations, IC₅₀ values indicated that the hydroalcoholic extract was more potent (30.28 µg/mL). This suggests that while ethyl acetate extract s may provide immediate radical quenching, the hydroalcoholic extract is more efficient at lower concentrations.
A similar trend was observed in the ABTS assay (Table 5; Figures 4 and 5), where the hydroalcoholic extract again demonstrated the lowest IC₅₀ value. The ABTS assay is particularly useful for evaluating both hydrophilic and lipophilic antioxidant activity, further supporting the broad-spectrum efficacy of the hydroalcoholic extract.
The FRAP assay (Table 6; Figures 6 and 7) revealed that all extracts possess reducing power, with the hydroalcoholic extract showing superior electron-donating capacity. This assay reflects the ability of antioxidants to reduce Fe³⁺ to Fe²⁺, indicating their potential to act as reductants in biological systems.
Mechanistically, the antioxidant activity observed in this study can be attributed to both hydrogen atom transfer (HAT) and single electron transfer (SET) mechanisms. Phenolic compounds donate hydrogen atoms to neutralize free radicals (HAT), while flavonoids and other compounds participate in electron transfer reactions (SET). The ability of the hydroalcoholic extract to perform effectively in all three assays suggests its involvement in multiple antioxidant pathways.
The relevance of these findings extends beyond free radical scavenging, as oxidative stress plays a pivotal role in the pathogenesis of obesity and related metabolic disorders. Increased production of reactive oxygen species (ROS) leads to lipid peroxidation, inflammation and insulin resistance [15]. Therefore, the strong antioxidant activity of M. charantia may contribute to its anti-obesity effects by mitigating oxidative stress and improving metabolic homeostasis.
Pancreatic Lipase Inhibition and Its Therapeutic Significance
The pancreatic lipase inhibition assay (Table 7; Figures 8 and 9) demonstrated that all extracts exhibited significant inhibitory activity in a concentration-dependent manner . The hydroalcoholic extract showed the highest inhibition (70.94% at 200 µg/mL) and the lowest IC₅₀ value (111.63 µg/mL), indicating superior potency among the plant extracts.
Pancreatic lipase is a crucial enzyme responsible for the hydrolysis of dietary triglycerides into absorbable fatty acids. Inhibition of this enzyme reduces fat absorption, thereby contributing to weight management. The observed inhibitory activity may be attributed to phenolic compounds, flavonoids and saponins, which are known to interact with the enzyme’s active site and inhibit its function.
The standard drug orlistat exhibited higher inhibition, as expected, but the significant activity of the hydroalcoholic extract highlights its potential as a natural alternative with possibly fewer side effects. This is particularly important given the limitations associated with synthetic anti-obesity drugs, including gastrointestinal disturbances and long-term safety concerns.
The anti-adipogenic activity evaluated using the 3T3-L1 cell model (Table 8; Figure 10) revealed that the hydroalcoholic extract significantly reduced lipid accumulation (45.62%) compared to ethanolic and ethyl acetate extract s . This indicates its ability to inhibit adipocyte differentiation and lipid storage.
Adipogenesis is regulated by key transcription factors such as PPAR-γ and C/EBP-α, which control the differentiation of preadipocytes into mature adipocytes [41]. The reduction in lipid accumulation suggests that the hydroalcoholic extract may downregulate these transcription factors, thereby inhibiting adipogenesis.
Additionally, M. charantia has been reported to activate AMPK, a central regulator of energy metabolism that promotes fatty acid oxidation and inhibits lipogenesis [13]. Activation of AMPK also improves insulin sensitivity and reduces lipid accumulation, further supporting the anti-obesity potential of the extract.
The combined results of antioxidant, lipase inhibition and anti-adipogenic assays suggest that M. charantia exerts its anti-obesity effects through a multi-target mechanism:
The findings of this study are consistent with previous reports highlighting the antioxidant and metabolic benefits of M. charantia [13,23]. However, clinical studies have shown inconsistent results regarding its effect on body weight and BMI. This discrepancy may be attributed to the lack of standardization in extract preparation and variability in phytochemical composition.
The present study addresses this limitation by demonstrating that a standardized hydroalcoholic extract, characterized by higher phenolic and flavonoid content, exhibits superior biological activity. This underscores the importance of standardization in herbal research and supports the hypothesis that phytochemical composition directly influences therapeutic efficacy.
Limitations and Future Perspectives: Despite the promising findings, the study has certain limitations. The results are based on in vitro assays, which may not fully replicate in vivo conditions. Further studies involving animal models and clinical trials are necessary to validate these findings. Additionally, detailed molecular studies are required to elucidate the exact mechanisms of action, particularly the role of signaling pathways such as AMPK, PI3K/Akt and PPAR-γ.
CONCLUSION
The present study provides comprehensive evidence supporting the antioxidant and anti-obesity potential of Momordica charantia, with a particular emphasis on the influence of extraction methods on biological activity. Among the three extracts evaluated, the hydroalcoholic extract emerged as the most potent, demonstrating superior performance across phytochemical, antioxidant, anti-lipase and anti-adipogenic assays.
The extraction yield analysis confirmed that the hydroalcoholic solvent system is more efficient in extracting bioactive compounds, which was further supported by phytochemical screening and quantitative analysis. The higher total phenolic and flavonoid content observed in the hydroalcoholic extract provides a strong biochemical basis for its enhanced biological activity.
The antioxidant assays (DPPH, ABTS and FRAP) demonstrated that the extracts possess significant free radical scavenging and reducing capabilities. The hydroalcoholic extract consistently exhibited the lowest IC₅₀ values, indicating higher potency. These findings highlight its ability to act through multiple mechanisms, including hydrogen atom transfer and electron transfer, thereby providing broad-spectrum antioxidant protection.
The anti-obesity potential of the extracts was validated through pancreatic lipase inhibition and anti-adipogenic assays. The hydroalcoholic extract showed significant inhibition of pancreatic lipase, suggesting its role in reducing dietary fat absorption. Furthermore, its ability to reduce lipid accumulation in 3T3-L1 cells indicates inhibition of adipogenesis, a key process in obesity development.
The integrated results suggest that Momordica charantia exerts its anti-obesity effects through a dual mechanism, targeting both fat digestion and fat storage, while also reducing oxidative stress. This multi-target approach is particularly beneficial in managing complex metabolic disorders such as obesity.
Importantly, the study highlights the critical role of extract standardization, as variations in solvent systems significantly influence phytochemical composition and biological activity. The use of a hydroalcoholic solvent system resulted in a more potent extract, emphasizing the need for standardized protocols in future research and therapeutic applications.
Thus, Momordica charantia represents a promising natural therapeutic agent for obesity management, with the hydroalcoholic extract showing the highest potential. However, further studies, including in vivo and clinical investigations, are required to confirm these findings and facilitate its translation into clinical practice.
Financial Support
Nil.
Consent for Publication
Not Applicable
Conflicts of Interest
The authors declare that there are no conflicts of interest, whether financial or otherwise.
Acknowledgements
The authors wish to thank all researchers for providing an eminent literature source for devising this manuscript.
REFERENCES


Vikash Kumar Gupta, Dr. Sarika Shrivastava, Jitendra Banweer, Deepa Iyer, Evaluating Standardized Momordica Charantia (Bitter Melon) Extracts as A Therapeutic Intervention for Obesity, Int. J. of Pharm. Sci., 2026, Vol 4, Issue 6, 5844-5872, https://doi.org/10.5281/zenodo.20810655
 10.5281/zenodo.20810655