

We use cookies to ensure our website works properly and to personalise your experience. Cookies policy
Mandesh Institute of Pharmaceutical Science of Research Centre, Mhaswad , Maharashtra, India 415509.
Background: Luliconazole is a broad-spectrum imidazole antifungal agent widely used in the treatment of fungal skin infections. However, conventional topical formulations often exhibit limitations in drug retention and penetration. The present study aimed to develop and optimize a Luliconazole-loaded emulgel to improve topical drug delivery and antifungal efficacy.Methods: Luliconazole emulgels were prepared using Carbopol, liquid paraffin, and propylene glycol. Preformulation studies including FTIR, DSC, melting point determination, and drug–excipient compatibility studies were performed. Eight formulations (F1–F8) were developed and optimized using a Central Composite Design (CCD). The formulations were evaluated for drug content, in vitro drug release, pH, viscosity, spreadability, particle size, rheological behavior, extrudability, and antifungal activity.Results: FTIR and DSC studies confirmed drug purity and compatibility with formulation excipients. Among the developed formulations, batch F7 exhibited the highest drug content (103 ± 1.23%) and maximum drug release (91.3 ± 1.49%). The optimized formulation showed acceptable pH (6.15 ± 0.53), suitable viscosity, excellent spreadability (21.80 ± 0.89 g·cm/s), and good extrudability. Particle size analysis revealed an average particle size of 616 nm with a PDI of 0.602. Rheological studies demonstrated pseudoplastic and thixotropic behavior suitable for topical application. The optimized emulgel exhibited significant antifungal activity against Candida albicans (24.67 ± 1.06 mm) and Sporothrix schenckii (36.83 ± 0.98 mm), showing comparable or superior performance to the marketed formulation.Conclusion: The optimized Luliconazole emulgel demonstrated excellent physicochemical properties, enhanced drug release, and potent antifungal activity. The developed formulation represents a promising topical drug delivery system for the effective management of fungal skin infections and warrants further in vivo and clinical investigation
Superficial fungal infections of the skin are among the most prevalent dermatological disorders worldwide, affecting millions of individuals annually. [1] Dermatophytosis, candidiasis, and other cutaneous mycoses are commonly associated with itching,[2] inflammation, erythema, and discomfort, significantly impacting the quality of life of affected patients. The increasing incidence of fungal infections, coupled with emerging antifungal resistance and poor patient compliance associated with prolonged treatment regimens, necessitates the development of more effective topical drug delivery systems. [3-4]
Luliconazole is a novel imidazole antifungal agent with broad-spectrum activity against dermatophytes, yeasts, and other pathogenic fungi.[5] It exerts its antifungal action by inhibiting the fungal enzyme lanosterol 14α-demethylase,[6] thereby disrupting ergosterol biosynthesis and compromising fungal cell membrane integrity.[7] Luliconazole has demonstrated superior antifungal efficacy compared with several conventional azole antifungal agents and has been widely employed for the treatment of tinea pedis,[8] tinea corporis, tinea cruris, and cutaneous candidiasis. Despite its potent antifungal activity,[9] the therapeutic effectiveness of luliconazole is limited by its poor aqueous solubility, [10] which may result in inadequate drug dissolution and reduced penetration through the stratum corneum. [11]
Nanotechnology-based drug delivery systems have emerged as promising approaches for overcoming solubility and permeability-related challenges associated with poorly water-soluble drugs.[12] Nanoemulsions are thermodynamically or kinetically stable colloidal dispersions consisting of oil, water, surfactant, and co-surfactant, with droplet sizes typically ranging from 20 to 200 nm.[13] Due to their small droplet size, large interfacial surface area, and enhanced solubilization capacity,[14] nanoemulsions facilitate improved drug dissolution, enhanced skin permeation, controlled drug release,[15] and increased bioavailability. Furthermore, nanoemulsion systems can provide prolonged residence time at the site of application, thereby enhancing therapeutic efficacy. [16]
However, the low viscosity of nanoemulsions may limit their retention on the skin surface. [17] To address this limitation, nanoemulsions can be incorporated into a hydrogel matrix to form nanoemulgels. [18] Nanoemulgels combine the advantages of nanoemulsion technology with the favorable rheological properties of gels,[19] resulting in improved spreadability, enhanced patient acceptability, prolonged skin contact time, and controlled drug release.[20] The gel network also provides physical stability while facilitating uniform drug distribution throughout the formulation.[21]
Several studies have reported the successful incorporation of luliconazole into advanced topical delivery systems such as microemulsions,[22] nanoemulsions, nanocrystals, solid lipid nanoparticles, niosomes, and nanofibers to improve its therapeutic performance. [23] Nevertheless, there remains a need for a stable, patient-friendly, and effective nanoemulgel formulation capable of enhancing skin penetration and antifungal efficacy while maintaining desirable physicochemical characteristics. [24]
Therefore, the present study was undertaken to formulate and evaluate a luliconazole-loaded nanoemulgel intended for topical application. The developed formulation was characterized for its physicochemical properties, [25] droplet size distribution, zeta potential, drug content, pH, viscosity, spreadability, in vitro drug release, and stability. [26] The study aims to develop an optimized nanoemulgel system capable of improving the topical delivery and therapeutic effectiveness of luliconazole for the management of superficial fungal infections. [27]
Materials
The materials used in the formulation of Luliconazole emulgel included the active pharmaceutical ingredient (API) and various excipients required for the preparation of a stable and effective topical dosage form. Luliconazole was procured from Vajrachem Agency, Pune, and was used as the antifungal drug. Carbapol 940 was employed as the gelling agent to provide suitable viscosity and consistency to the formulation. Liquid paraffin served as the oil phase, while ethanol acted as a co-solvent to enhance the solubility of the drug. Methylparaben and propylparaben were incorporated as preservatives to prevent microbial growth and improve the shelf-life of the formulation. Span 20 and Tween 20 were used as emulsifying agents for the preparation and stabilization of the emulsion system. Triethanolamine was utilized as a pH-adjusting agent and neutralizer for Carbapol gel formation. Dimethyl sulfoxide (DMSO) was used as a penetration enhancer to improve drug permeation through the skin. All chemicals and reagents used in the study were of analytical grade and were used without further purification.
Instruments
Various analytical and processing instruments were utilized during the formulation development and characterization studies. A digital weighing balance (AB265-S/FACT, Mettler Toledo, Switzerland) was used for accurate weighing of materials. Mixing and stirring operations were performed using a magnetic stirrer (RQ-122, Remi Works, India). Purified water required for formulation preparation was obtained from a Milli-Q water purification system (Millipore, USA). The morphology and surface characteristics of the formulations were examined using a Field Emission Scanning Electron Microscope coupled with Energy Dispersive Spectroscopy (FE-SEM/EDS, Hitachi SU 8010 Series, Japan) and Transmission Electron Microscope (TEM, Hitachi, Japan). UV-visible spectrophotometric analyses were carried out using a UV-1700 Pharma Spec spectrophotometer (Shimadzu, Japan). An ultracentrifuge (3K-30, Sigma, USA) was employed for centrifugation studies, while pH measurements were performed using a digital pH meter (M-01, MAX, Navi Mumbai). Drying and heating processes were conducted in a hot air oven (PT-400, Perfitt, India). Particle size analysis of the formulations was performed using a Beckman Coulter particle size analyzer (USA). These instruments facilitated the accurate preparation, evaluation, and characterization of the developed emulgel formulations.
PREFORMULATION STUDY
Pre-formulation studies were carried out to evaluate the physicochemical properties of Luliconazole prior to formulation development. These studies provide essential information regarding the drug’s identity, purity, compatibility, stability, and suitability for formulation into a topical emulgel delivery system.
Identification of Drug
The identity and purity of Luliconazole were confirmed using standard analytical techniques including melting point determination, Fourier Transform Infrared (FTIR) spectroscopy, and UV–Visible spectrophotometry. These tests ensured the authenticity of the drug and its compliance with pharmacopoeial specifications.
Organoleptic Evaluation
Luliconazole was evaluated for its organoleptic characteristics including colour, odour, and physical appearance by visual inspection. These parameters provide preliminary information regarding the quality and purity of the drug sample.
Determination of Melting Point
The melting point of Luliconazole was determined using the capillary tube method. A small quantity of drug was filled into a sealed capillary tube and attached to a thermometer. The assembly was immersed in liquid paraffin and heated gradually. The temperature at which the drug began to melt was recorded as the melting point. This study was performed to assess the purity and identity of the drug.
Fourier Transform Infrared (FTIR) Spectroscopy
FTIR spectroscopy was performed to identify the characteristic functional groups of Luliconazole and to confirm its chemical structure. The FTIR spectrum was recorded using a BRUKER FTIR spectrophotometer over a wavelength range of 4000–650 cm⁻¹. The obtained spectrum was compared with reported reference spectra.
ANALYTICAL METHOD DEVELOPMENT BY UV SPECTROSCOPY
Determination of λmax
A UV–Visible spectrophotometer (Agilent 1800) equipped with a 1 cm quartz cell was used for wavelength determination. Accurately weighed 10 mg of Luliconazole was dissolved in ethanol and diluted to obtain a stock solution of 1000 µg/mL. Further serial dilutions were prepared to obtain a concentration of 10 µg/mL. The solution was scanned between 200–400 nm and the wavelength showing maximum absorbance (λmax) was recorded at 335 nm.
FORMULATION DEVELOPMENT OF LULICONAZOLE EMULGEL
Quality Target Product Profile (QTPP)
The Quality Target Product Profile (QTPP) was established to define the desired quality characteristics of the topical Luliconazole emulgel. The formulation was designed as a controlled-release topical dosage form intended for the treatment of acne, with acceptable drug content, stability, drug release profile, and patient compliance.
Table No. 05: Quality target product profile (QTPP) of Luliconazole emulgel
|
QTPP elements |
Target |
Justification |
|
Dosage form |
Gel |
For ease of administration |
|
Dosage type |
Controlled release |
Slow drug release of action |
|
Dosage administration |
Applied two to three times |
Dosage strength is less and effect is Controlled |
|
Route of Administration |
Topically |
Recommended route |
|
Indications and usage |
For the treatment of anti-acne anti-fungal similar to existing controlled-release product |
For safety and therapeutic action of the formulation |
|
Microbiological Evaluation |
Meets pharmacopeia standard [I.P.2007] |
To ensure patient safety |
|
Content uniformity |
NLT 90% NMT 120% Drug content uniformity. |
To ensure accurate dosing |
|
In vitro release |
NMT 100% drug release as per marked product |
To ensure total bioavailability with maximum absorption. |
|
Packaging |
Stored in cool and dried ventilated place like marketed formulation |
To maintain the therapeutic potential of drug product during shelf life and transportation |
Critical Quality Attributes (CQAs)
Critical Quality Attributes (CQAs) are the physical, chemical, biological, or microbiological properties that must be controlled within predefined limits to ensure product quality, safety, and efficacy.
Table No. 06: Critical Quality Attributes (CQA) of Luliconazole Emulgel
|
Quality Attributes or Drug profile |
Target |
Is this CQA? |
Justification |
|
Physical attributes color, odour, Appearance |
No unpleasant color, and odor. |
No |
Physical attributes of the formulation were not considered as critical, as these not directly linked to the efficacy and safety |
|
Assay and content uniformity |
100% |
Yes |
Total assay and content uniformity tend to affect the safety and efficacy of formulations, yet the in-gel was considered as the clear solution in which the drug is uniformly dispersed. This variable was regarded as moderately critical. |
|
Durg release |
Similar to a marketed product |
Yes |
Essential parameter to study the diffusion profile of formulation. Thus, it was considered critical. |
|
Pharmacokinetic parameter |
Similar to a marketed product |
Yes |
ℷmax and AUC within 80-100% is in between marketed product |
|
pH of solution |
Should meet the require as per BP/USP (4-7) |
Yes |
This will affect the absorption of a drug when it comes in contact with the skin. |
Among these parameters, drug content, drug release, and pH were identified as critical attributes directly affecting therapeutic performance.
Risk Assessment Analysis
A risk assessment study was conducted to identify formulation variables that may influence the CQAs of the emulgel. Parameters such as concentration of gelling agent, liquid paraffin, and emulsifying agents were evaluated for their impact on viscosity, drug content, and drug release characteristics. Based on the assessment, critical formulation variables were selected for optimization.
|
Drug Products CQA’s |
Risk Assessment Matrix |
||
|
Gelling agent |
Drug to polymer ratio |
Viscosity |
|
|
Gel strength |
Medium |
Medium |
Low |
|
Drug Content |
High |
High |
High |
PREPARATION METHODS OF LULICONAZOLE EMULGEL
The emulgel formulations were prepared by combining an emulsion phase with a gel base.
Preparation of Gel Base
Carbopol 940 was dispersed in distilled water under continuous stirring using a magnetic stirrer. The dispersion was allowed to hydrate completely, and the pH was adjusted to 6.0–6.5 using triethanolamine to obtain a clear gel.
Preparation of Emulsion
The oil phase was prepared by dissolving Span 20 in liquid paraffin. The aqueous phase was prepared by dissolving Tween 20 in distilled water. Methyl paraben and propyl paraben were dissolved in propylene glycol, while Luliconazole was dissolved in DMSO.
Both oil and aqueous phases were heated separately to 70–80°C. The oil phase was then added slowly to the aqueous phase with continuous stirring to obtain a stable emulsion. Stirring was continued until the emulsion cooled to room temperature.
Preparation of Emulgel
The prepared emulsion was mixed with the Carbopol gel base in a ratio of 1:1 under gentle stirring until a homogeneous emulgel was obtained.
Formulation table:
Table No. 07: Composition of different formulation batches (%w/w).
|
Ingredient(%w/w) |
F1 |
F2 |
F3 |
F4 |
F5 |
F6 |
F7 |
F8 |
F9 |
|
Luliconazole |
1 |
1 |
1 |
1 |
1 |
1 |
1 |
1 |
1 |
|
Carbopol 940 |
0.5 |
2.5 |
0.5 |
0.5 |
2.5 |
4.5 |
2.5 |
4.5 |
4.5 |
|
Liquid paraffin |
9.0 |
1.0 |
1.0 |
5.0 |
9.0 |
9.0 |
5.0 |
5.0 |
1.0 |
|
Tween 20 |
0.6 |
0.6 |
0.6 |
0.6 |
0.6 |
0.6 |
0.6 |
0.6 |
0.6 |
|
Span 20 |
0.9 |
0.9 |
0.9 |
0.9 |
0.9 |
0.9 |
0.9 |
0.9 |
0.9 |
|
Propylene glycol |
1.5 |
1.5 |
1.5 |
1.5 |
1.5 |
1.5 |
1.5 |
1.5 |
1.5 |
|
DMSO |
5 |
5 |
5 |
5 |
5 |
5 |
5 |
5 |
5 |
|
Methyl paraben |
0.03 |
0.03 |
0.03 |
0.03 |
0.03 |
0.03 |
0.03 |
0.03 |
0.03 |
|
Propyl paraben |
0.01 |
0.01 |
0.01 |
0.01 |
0.01 |
0.01 |
0.01 |
0.01 |
0.01 |
|
Water Triethanolamine |
q.s. |
q.s. |
q.s. |
q.s. |
q.s. |
q.s. |
q.s. |
q.s. |
q.s. |
|
|
Adjusted to pH 6-6.5 |
||||||||
OPTIMIZATION OF FORMULATION
A Central Composite Design (CCD) was employed to optimize the formulation variables and evaluate their effect on drug content and drug release.
Independent Variables
X₁ = Concentration of Carbopol 940 (Gelling Agent)
X₂ = Concentration of Liquid Paraffin
X₃ = Concentration of Emulsifying Agent
Dependent Variables
Y₁ = Drug Content (%)
Y₂ = Percentage Drug Release
The experimental data were fitted to a polynomial equation and analyzed using response surface methodology to identify the optimized formulation.
Table No. 08: Coded Factors and Levels for 23 Central composite design
|
Coded value |
Factor |
-1 |
+1 |
|
X1 |
Gelling agent |
0.5% |
1.5% |
|
X2 |
Liquid paraffin |
5% |
7.5% |
|
X3 |
Emulsifying agent |
1.5% |
2.5% |
“X1= Conc. Gelling agent; X2= Conc.of liquid paraffin; X3=Conc. of emulsifying agent, and to optimise the formulation parameters and analyse the primary effects, a two-level design was used in which each variable was tried at a low (-1) and high (1) level, F1to F8 emulgel formulations were developed using a two-level design in which each variable was evaluated at a low (-1) and high (1) level”
Table No. 09: Formulation based on the design of expert central composite design
|
Batches |
X1 carbapol 940 |
X2 liquid paraffin |
X3 emulsifying agent |
|
F1 |
+1 |
-1 |
-1 |
|
F2 |
+1 |
-1 |
-1 |
|
F3 |
+1 |
+1 |
+1 |
|
F4 |
+1 |
+1 |
-1 |
|
F5 |
+1 |
-1 |
+1 |
|
F6 |
-1 |
+1 |
+1 |
|
F7 |
-1 |
+1 |
-1 |
|
F8 |
-1 |
-1 |
+1 |
“The independent variables concentration Gelling agent (X1) and concentration Liquid paraffin (X2) dependent variable concentration emulsifying agent (X3), denoted the value (-1) and (1) in the above design respectively”.2 levels of gelling agent conc. were opted to be 0.5% &1.5% denoted -1 and 1 respectively and liquid paraffin denoted 5% & 7.5%. Finally, the emulsifying agent concentration was 1.5% & 2.5% denoted -1 and 1 respectively.
Table No. 10: Optimization of formulation Factor
Batches X1 carbapol agent
|
Batches |
X1 carbapol agent (carbapol 940) |
X2 liquid paraffin |
X3 emulsifying agent (propylene glycol) |
|
F1 |
1.50 |
5.00 |
1.50 |
|
F2 |
0.50 |
5.00 |
1.50 |
|
F3 |
1.50 |
7.50 |
2.50 |
|
F4 |
1.50 |
7.50 |
1.50 |
|
F5 |
1.50 |
5.00 |
2.50 |
|
F6 |
0.50 |
7.50 |
2.50 |
|
F7 |
0.50 |
7.50 |
1.50 |
|
F8 |
0.50 |
5.00 |
2.50 |
CHARACTERIZATION OF LULICONAZOLE EMULGEL
Physical Evaluation
The prepared formulations were evaluated visually for colour, homogeneity, consistency, and phase separation.
Drug Content Determination
An accurately weighed quantity of emulgel was dissolved in ethanol and sonicated to extract the drug. After suitable dilution, the absorbance was measured at 335 nm using a UV spectrophotometer, and drug content was calculated.
Differential Scanning Calorimetry (DSC)
DSC analysis was performed to investigate the thermal behaviour and compatibility of Luliconazole with formulation excipients. Approximately 2 mg of sample was sealed in an aluminium pan and heated from 20°C to 250°C under a nitrogen atmosphere.
FTIR Compatibility Study
FTIR analysis of pure drug and optimized formulation was performed using the KBr pellet method. Spectra were recorded over the range of 4000–650 cm⁻¹ and analyzed for any interaction between drug and excipients.
In Vitro Drug Release Study
Drug release studies were conducted using a Franz diffusion cell equipped with a dialysis membrane previously soaked in phosphate buffer pH 7.4. The receptor compartment was maintained at 37 ± 0.5°C with continuous stirring. Samples were withdrawn at predetermined intervals and analyzed spectrophotometrically at 335 nm.
pH Measurement
One gram of emulgel was dispersed in 100 mL distilled water and allowed to stand for two hours. The pH was measured using a calibrated digital pH meter. Measurements were performed in triplicate.
Rheological Evaluation
Viscosity measurements were carried out using a Brookfield rheometer equipped with spindle number 7. Measurements were recorded at 25°C and 50 rpm, and the average viscosity value was calculated.
Particle Size Analysis
Particle size distribution of the optimized formulation was determined using a Zetasizer. The formulation was suitably diluted with distilled water before analysis.
Spreadability
Spreadability was evaluated using the parallel glass slide method. The time required for the upper slide to move under a specified weight was recorded and spreadability was calculated using:
S = (M × L) / T
Where:
S = Spreadability
M = Weight tied to upper slide (g)
L = Length of glass slide (cm)
T = Time taken to separate the slides (s)
Extrudability
Extrudability was determined by measuring the force required to extrude the emulgel from collapsible aluminium tubes. The ease of extrusion was used as an indicator of formulation performance.
ANTI-FUNGAL ACTIVITY
In vitro Antifungal Activity of Luliconazole emulgel:
The qualitative antifungal activity of Luliconazole emulgel is tested and compared with that of marketed antifungal formulation (BM; Luliconazole 1% w/w 30 gm cream with brand name LufungalTM Cream) and placebo gel (BM) and (LF-F7), respectively. Using an agar well diffusion assay, this test was done against two skin disease-causing fungi. Nearly 100 μL of the fungi inoculum suspension was spread evenly on the sabouraud dextrose agar plate surface. An 8 mm well was created at the centre of the plates, and about 150 mg of test samples were kept in it. The sampled plates were incubated for 3 days at 37 ºC. Three replicates were tested in each case, and the zone of growth inhibitions (ZGI) was calculated in mm.
RESULTS AND DISCISSION
PRE-FORMULATIONS
Identification test
The identification tests for Luliconazole were performed by the following methods. The outcomes are mentioned in table no 11 and the values observed are within the range. From the result is inferred that the Luliconazole is in the unadulterated form.
Table No. 11: Identification test of Luliconazole
|
Sr No. |
Physical properties and test |
Methods |
Description |
|
1. |
Physical |
Visual observation |
Crystalline powder |
|
2. |
Colour |
Visual observation |
Yellow |
|
3. |
Odour |
Smelling by nose |
Odourless |
|
4. |
Melting point |
Capillary method |
1800C |
FTIR analysis
The “FTIR spectrum of Luliconazole was recorded using FTIR (Cary-630 Agilent technology) and the spectrum was recorded over the range of wave number 4000-650cm-1. The spectra are shown in figure 15 the values of major peaks in the FTIR spectrum of Luliconazole mentioned in table 10 from the observed peak it is clear that Luliconazole is the pure form.
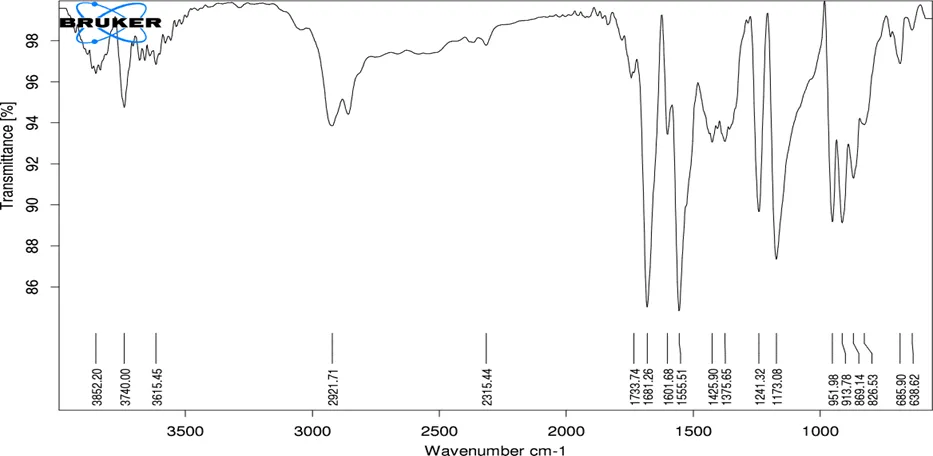
Figure No. 15: FTIR Spectra of Luliconazole
Table No. 12: IR values of functional groups of Luliconazole
|
Sr. No. |
Functional Group |
Peak (Wavenumber) cm⁻¹ (Observed) |
Peak (Wavenumber) cm⁻¹ (Standard) |
|
1 |
O–H Stretching |
3852.20 |
3600–3850 |
|
2 |
O–H Stretching |
3740.00 |
3600–3750 |
|
3 |
O–H Stretching |
3615.45 |
3200–3650 |
|
4 |
Aromatic C–H Stretching |
2921.71 |
2850–3100 |
|
5 |
C≡N (Nitrile) Stretching |
2315.44 |
2210–2260 |
|
6 |
C=N Stretching (Imidazole ring) |
1733.74 |
1650–1750 |
|
7 |
Aromatic C=C Stretching |
1681.26 |
1600–1680 |
|
8 |
Aromatic C=C Stretching |
1601.88 |
1500–1600 |
|
9 |
Imidazole Ring Vibration / C=N |
1555.51 |
1500–1600 |
|
10 |
C–N Stretching |
1425.90 |
1250–1450 |
|
11 |
Aromatic Ring Vibration |
1357.65 |
1300–1450 |
|
12 |
C–N Stretching (Imidazole) |
1241.32 |
1200–1350 |
|
13 |
C–F Stretching |
1173.08 |
1000–1300 |
|
14 |
Aromatic C–H Bending |
951.98 |
900–1000 |
|
15 |
Aromatic C–H Bending |
913.74 |
850–950 |
|
16 |
Aromatic C–H Bending |
891.26 |
850–900 |
|
17 |
C–Cl Stretching |
824.13 |
700–850 |
|
18 |
C–Cl Stretching |
685.90 |
600–800 |
|
19 |
C–Cl Stretching |
638.62 |
600–800 |
Determination of λ max
Luliconazole 10mg, weighed precisely, was dissolved in 10 ml of ethanol (1000 ppm). Used as the stock solution from this 1 ml withdrawn and diluted up to 10ml with ethanol (100 ppm) then form this withdrawn 1ml diluted in 10ml (10 ppm).
This dilution taken λmax of Luliconazole by UV- spectrophotometer in ethanol was found to be 335 nm and it is very close to standard λ max. the UV visible spectrum of Luliconazole is shown in figure 16 and the value observed is shown in table 13.
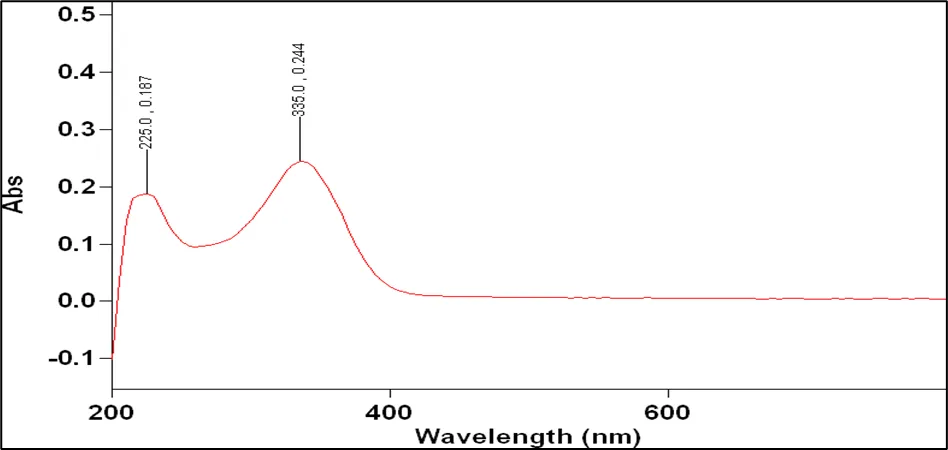
Figure No. 16: UV- Visible absorption spectrum of Luliconazole
Table No. 13: Wavelength of maximum absorbance (λ max)
|
Sr. No |
Solvent |
λ max (nm) |
|
1. |
Ethanol |
335 |
Standard calibration curve of Luliconazole in ethanol:
Luliconazole 10 mg, weighed precisely, was dissolved in 10 ml of ethanol (1000 ppm). Used as the stock solution from the stack solution 1 ml withdrawn and diluted up to 10ml with ethanol (100 ppm) then form this withdrawn 1ml diluted in 10ml (10 ppm). form the solution of 10 ppm made the concentrations of 2,4,6,8,10 ppm. The graph of Abs v/s. Conc. for Luliconazole was inferred to be linear in concentration range 2-10ppm standard calibration curve values of Luliconazole in ethanol are shown in table 14 and calibration curve shown in figure 17. The R2 value was found to be 0.998.
Table No. 14: Calibration curve values of Luliconazole in ethanol by UV spectrometry
|
Sr. No. |
Concentration (ppm) |
Absorbance |
|
1 |
2 |
0.144 |
|
2 |
4 |
0.315 |
|
3 |
6 |
0.522 |
|
4 |
8 |
0.714 |
|
5 |
10 |
0.932 |
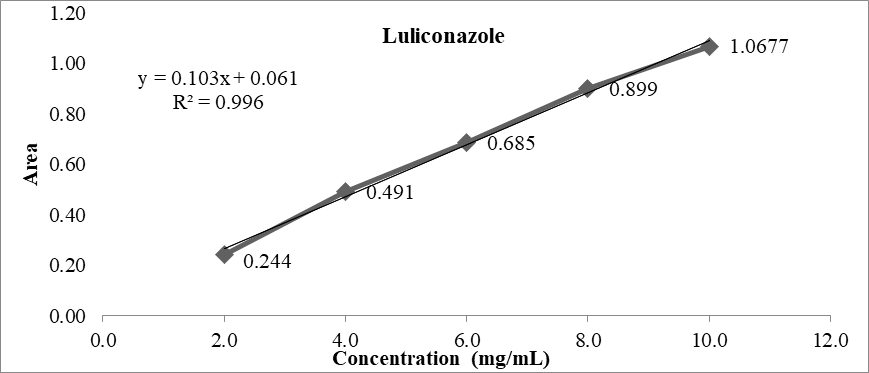
Figure No. 17: Graph of the calibration curve in ethanol
Standard calibration curve of Luliconazole in PBS 7.4:
Luliconazole 10 mg, weighed precisely, was dissolved in 10 ml of ethanol (1000 ppm) used as stock solution. From the stock solution 1 ml withdrawn and diluted up to 10ml with PBS 7.4 (100ppm) then from this with drawn 1ml diluted in 10ml (10ppm). From the solution of 10 ppm made the concentrations of 2,4,6,8,10 ppm. The absorbance of all the solutions was measured by using a UV visible Spectrophotometer at 335nm and the graph of absorbance vs. concentration for pure Luliconazole was found to be linear in the concentration range 2-10 ppm standard calibration curve values of Luliconazole in ethanol are shown in table 15 and calibration curve showed in figure 18 the R2 value was found to be 0.996.
Table No. 15: Calibration curve values of Luliconazole in PBS 7.4 by UV-visible spectrophotometry.
|
Sr. No. |
Concentration (ppm) |
Absorbance |
|
1 |
2 |
0.244 |
|
2 |
4 |
0.491 |
|
3 |
6 |
0.685 |
|
4 |
8 |
0.899 |
|
5 |
10 |
1.0677 |
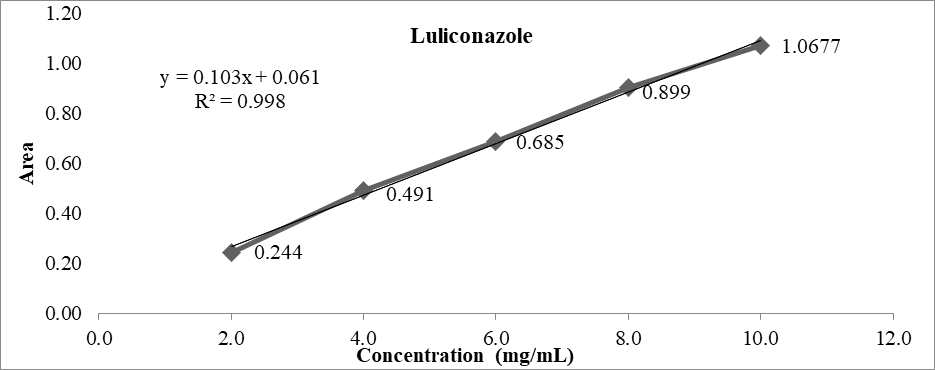
Figure No. 18: Graph of the calibration curve in PBS 7.4
Table No. 16: Characteristics of calibration curve of Luliconazole in different media
|
Sr. No. |
Conc. (ppm) |
Absorbance |
|
|
Ethanol |
PBS pH 7.4 |
||
|
1 |
2 |
0.144 |
0.244 |
|
2 |
4 |
0.315 |
0.491 |
|
3 |
6 |
0.422 |
0.685 |
|
4 |
8 |
0.612 |
0.899 |
|
5 |
10 |
0.824 |
1.0677 |
Drug excipient Compatibility study
It is generally established that interactions between the active ingredient and excipients can affect the way medications behave and have pharmacological effects in biological systems. The interaction between the medication and the excipients employed was investigated using IR spectral investigations of pure Luliconazole and formulations comprising additional excipients. By using an FTIR (BRUKER) spectrophotometer, IR spectra were acquired. O-H stretching, C=O of carbonyl stretching, C=C stretching, and C-O of pure Luliconazole as well as the Luliconazole emulgel formulations including a larger proportion of excipients were virtually in the same region. “It demonstrated that the basic peaks and patterns in the IR spectra of pure, Luliconazole, and emulgel formulations were comparable and the findings demonstrated that there were no significant interactions between any of the excipients and the medication”. Figure 19 gives the further explanations.
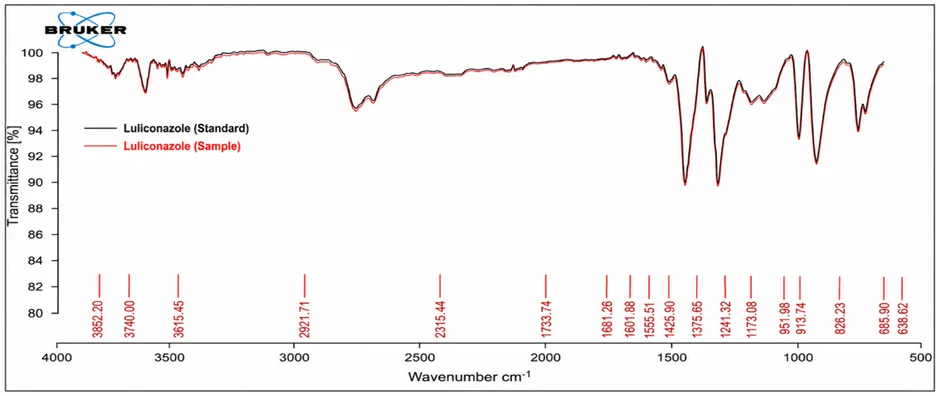
Figure No. 19: FTIR spectra of Luliconazole and formulation compatibility
DSC of Luliconazole pure drug
DSC can be “applied to analyze and predict physicochemical interaction between components in a formulation thus helps in selecting suitable chemically compatible excipients.”
Figure No. 20: DSC thermogram of Luliconazole
The capillary technique was used to estimate the Modal drug's typical melting point and was observed in the range of 1750C – 1810Cwhich is with the reported melting point. The melting point was confirmed using Differential Scanning Calorimetry [Mettler Toledo]
In DSC thermogram single sharp endothermic peak at 1800C indicates the desired purity of modal drug Sharp peak indicates the crystalline nature of API.
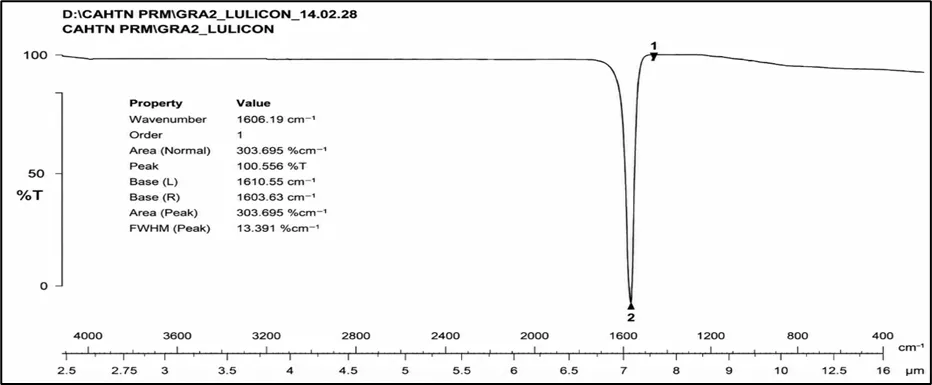
Figure No. 21: DSC thermograph of Luliconazole and formulation
This similarity in peaks indicates the compatibility of Luliconazole with the gel formulation polymers. Pure drug melting point 1800C and formulation 1740C Similarity as pure drug indicates the purity of API and no interaction and degradation of API in the formulation. So, there was no interaction was observed between the Pure drug sample and excipients used in topical.
OPTIMIZATION OF LULICONAZOLE EMULGEL:
Drug content determination by UV
1gm of emulgel was dissolved in 10 ml of ethanol. “The volumetric flask was kept for 1 hour and shaken well in a shaker to mix it properly and the solution was passed through the filter paper and filtered, further, withdrawn 1ml was diluted up to 10 ml with PBS7.4 the absorbance was measured spectrophotometrically at 335nm and finally the drug content was determined using a standard plot”. Following data shown in the table and graph.
Table No. 17: Drug content of percentage value
|
Sr no. |
Formulation code |
%drug content |
|
1 |
F1 |
85±1.52 |
|
2 |
F2 |
92±1.21 |
|
3 |
F3 |
79±1.89 |
|
4 |
F4 |
94±1.59 |
|
5 |
F5 |
80±1.62 |
|
6 |
F6 |
99±1.58 |
|
7 |
F7 |
103±1.23 |
|
8 |
F8 |
92±1.57 |
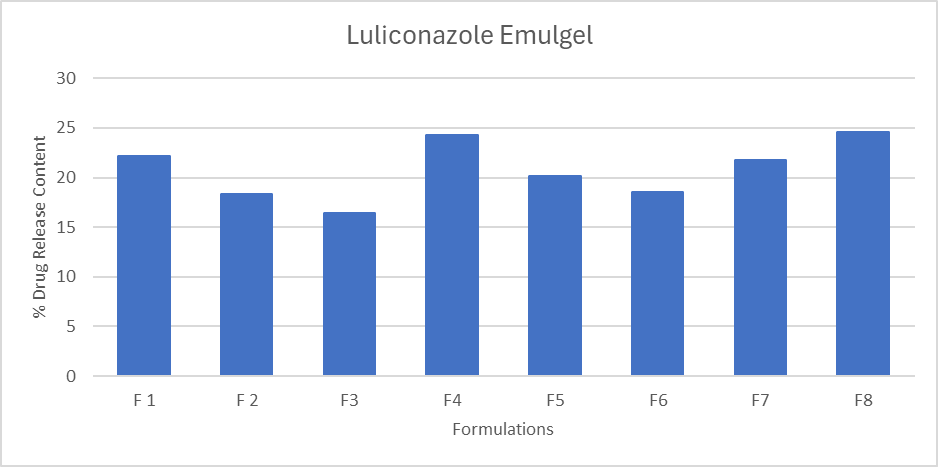
Figure No. 22: Graph of formulation batches of drug content
The average drug content of Luliconazole gel was found to be in percentage Drug content values were almost uniform in all F1-F8 formulations as mentioned in table no17 formulation F7 shows very good drug content.
Selection of optimization batch formulation
A total of 8 batches were prepared for their optimization purpose. The optimized batch was selected based on the drug content among the 8 batches batch F7 showed maximum drug content 103±1.23 compare to other batches therefore it was selected as an optimized batch. This batch was a good consistency and physical appearance. And other characterization results get appropriate and reproducible.
Effect of formulation variables on drug content (Response 1; Y1) Statistical Analysis:
Statistical Analysis of the central composite design batches was performed by multiple regression analysis using Design of Experiment (version 10) software, results of ANOVA shown below table 18
Table No. 18: Results of ANOVA for drug content
|
Source |
Sum of Squares |
Degree of freedom |
Mean Square |
F Value |
p-value Prob > F |
Level of Significance |
|
Model |
444.50 |
3 |
148.17 |
8.06 |
0.0359 |
Significant |
|
A-carbapol |
288.00 |
1 |
288.00 |
15.67 |
0.0167 |
|
|
B-Liq.paraffin |
84.50 |
1 |
84.50 |
4.60 |
0.0986 |
|
|
C-propylene glycol |
72.00 |
1 |
72.00 |
3.92 |
0.1189 |
|
|
Residual |
73.50 |
4 |
18.37 |
- |
- |
|
|
Core Total |
518.00 |
7 |
- |
- |
- |
|
The model is suggested to be significant by the model's F-value of 8.06. A "Model F- value” this large could only happen owing to noise 3.59% of the time. When "Prob > F" is <0.0500, model terms are considered significant. Here, and are important model terms.
The ANOVA for the dependent variables demonstrates that “the model was significant for all response variables and the effect is like, the amount of carbapol and liquid paraffin were found to be significant, along with its quadratic and interaction terms for all the dependent variables”.
Final Equation in Terms of Coded Factors:
drug content=+90.50 A (-6.00) B (+3.25) C (-3.00)
Final Equation in Terms of Actual Factors:
drug content= +98.25000 * carbopol(-12.0000) * liquid paraffin(+2.60000) * propyline glycol(-6.0000)
Response surface plot for drug content:
A Normal probability graph of drug content Explained “whether the residuals follow a normal distribution, in which case the points will follow a straight line and expect
some scatter even normal data”. All points will be nearer to a straight line so, drug content is normal data.
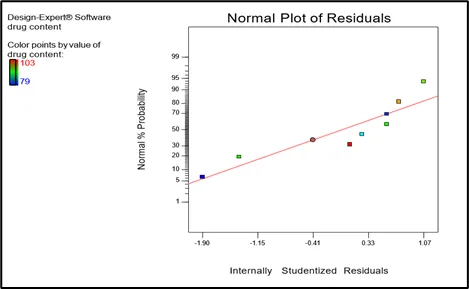
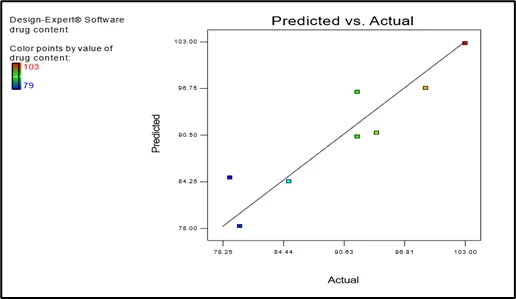
Figure No. 23: Normal plot for drug content Figure No. 24: Predicted values vs Actual values plot for drug content
Predicted vs actual plot:
Figure 24, Predicted values vs Actual values plot for drug content explained the differential residue present among the predicted & actual values obtained from results. The plot showed the significant value of drug content results i.e. 103 which was nearer to the expected value. No difference between the predicted value and the actual value.
Interaction of excipient plot
With the interaction of excipient figure 25, interaction of excipient plot for drug content is carbapol and liquid paraffin no interaction to each other the plot excipients values of line perpendicular. So, this graph of interaction shows a significant effect on excipient with drug content.
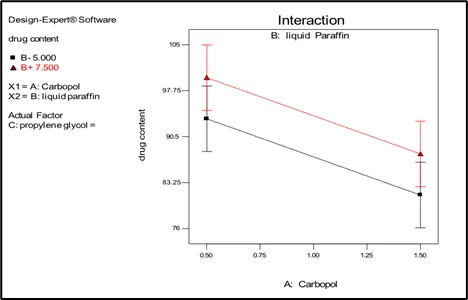
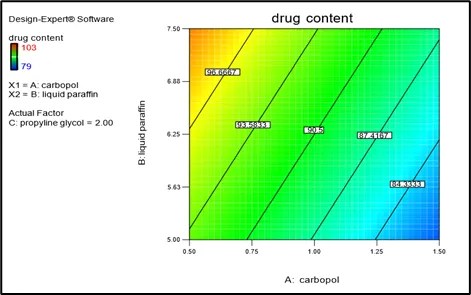
Figure No. 25: Interaction of excipient plot for explained Figure No. 26: Contour plot of drug content
Analysis of Contour plot & response surface model:
Figure 26 displays 2D contour plots, which are excellent for examining how a component interacts with the responses. These kinds of plots are helpful for examining the simultaneous impact of two variables on the answer and the overall given figure. The effects of X1 (carbapol) and X2 (liquid paraffin) with their non- interaction on drug content at a fixed or level X2 are all linear up to a specified range. The plots were determined to be linear up to 96.66, showing that X1 and X2 had a linear relationship. Likewise, all values for the dependent variables were remembered.
The contour plot showed that an optimal drug content value could be attained with X1 levels between 96.66 and 93.58 and X2 levels between 90.5 and 87.41. The counterplot makes it clear that the formulation benefits from the increased amount of both X1 and X2.
Response surface of 3D plot:
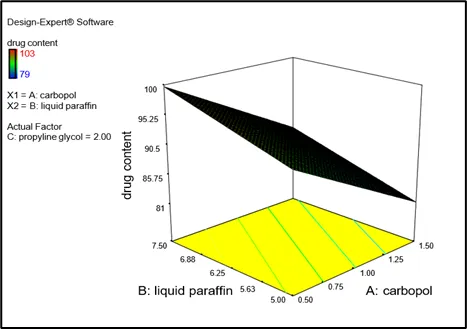
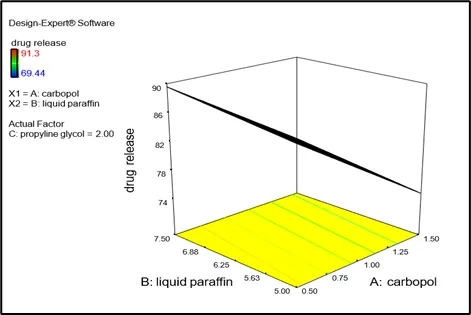
Figure No. 27: Response surface plot (3D) of drug content Figure No. 28: Contour plot of drug release
Figure 27, shows two- and three-dimensional response surface plots, which are both highly helpful for examining how different factors interact to affect responses. These charts are highly helpful for forecasting the outcomes of experiments. These diagrams are highly helpful for understanding the link between the dependent and independent variables, as well as the simultaneous effects of two components.
Polynomial equation
Final Equation in Terms of Actual Factors:
Drug content= Y1=90.50 - 6.00X1 + 3.25X2 – 3.00X1X2
Final Equation in Terms of Actual Factors:
Drug content = Y1=98.25-12.00 X1+2.60 X2-6.00 X1X2
Effect of formulation variables on in vitro release of TRT (Response 2; Y2)
Drug release studies were performed in Franz diffusion cell applied on dialysis membrane which is used in diffusion media of phosphate buffer solution 7.4 withdrawn 2ml sample diluted in PBS 7.4 at 10 min time interval absorbance measured in determining λ max at 335 nm by UV spectrophotometer in all formulation.
The in vitro test was performed to ensure the uniform and accurate permeability of the drug. a good drug permeability was observed among all emulgel formulations and was found to be 91.3 The drug permeability of all formulations was tabulated in Table 19.
Table No. 19: Drug release of formulation F1-F8
|
Formulation Code |
% Drug Release |
|
F1 |
74.33±1.61 |
|
F2 |
84.22±0.66 |
|
F3 |
82.44±1.96 |
|
F4 |
69.44±1.37 |
|
F5 |
76.55±0.89 |
|
F6 |
89.23±1.68 |
|
F7 |
91.3±1.49 |
|
F8 |
89.44±1.96 |
Figure 28, shows two-dimensional contour plots, which are excellent for seeing how a component interacts with the responses. These plots are helpful for examining the simultaneous impact of two variables on the answer and the overall given figure. The plots were found to be linear up to 87.06, showing a linear connection between X1 and X2. The effect of X1 (carbapol) and X2 (liquid paraffin) with their non- interaction on drug release at a fixed or level X2 The relationships among the three variables are all linear up to a particular range. Likewise, all values for the dependent variables were remembered.
The contour plot showed that an optimal drug content value could be attained with X1 levels between 87.06 and 84.58 and X2 levels between 82.11 and 79.64. The counterplot makes it clear that the formulation benefits from the increased amount of both X1 and X2.
Figure 28 shows two- and three-dimensional response surface plots, which are both highly helpful for examining how different factors interact to affect responses. These charts are highly helpful for forecasting the outcomes of experiments. These diagrams are highly helpful for understanding the link between the dependent and independent variables, as well as the simultaneous effects of two components.
Polynomial Equation:
Final Equation in Terms of Actual Factors:
Drug release= Y2= 82.12 -6.43X1+0.98X2+2.30X1X2
Final Equation in Terms of Actual Factors:
Drug release= Y2= 80.8725 X1-12.857 X2+0.789+4.599 X1X2
Model significance is shown by the model's “Model F-value” of 7.82. A "Model F- value" this large may happen by chance just 3.78% of the time. "Prob > F" values
<0.0500 reflect the significance of the model terms.
The “ANOVA for the dependent variables demonstrates that the model was significant for all response variables and the effect is like, the amount of carbapol and liquid paraffin were found to be significant, along with its quadratic and interaction terms for all the dependent variables”.
ANOVA for Response Surface Linear Model
Table No. 20: Results of ANOVA for drug release
|
Source |
Sum of Squares |
Degree of freedom |
Mean Square |
F Value |
p-value Prob>F |
|
Model |
380.55 |
3 |
126.85 |
782 |
0.0378 |
|
A-carbapol |
330.63 |
1 |
330.63 |
20.39 |
0.0107 |
|
B-Liq. paraffin |
7.74 |
1 |
7.74 |
0.48 |
0.5276 |
|
C- Propylene glycol |
42.18 |
1 |
42.18 |
2.60 |
0.1821 |
|
Residual |
64.86 |
4 |
64.21 |
- |
- |
|
Core Total |
445.41 |
7 |
- |
- |
- |
Final Equation in Terms of Coded Factor
drug release =+82.12 * A(-6.43) * B(+0.98) * C (+2.30)
Final Equation in Terms of Actual Factors:
drug release=+80.87250 *carbopol(-12.85750) * liquid paraffin(+0.78700) * propyline glycol (+4.59250)
Response surface plot for drug release:
The release described if the residuals follow a normal distribution, in which case the points will follow a straight line, using a normal probability graph of a medicine. Even with typical data, expect some dispersion. All points will be nearer to a straight line so, drug content is normal data.
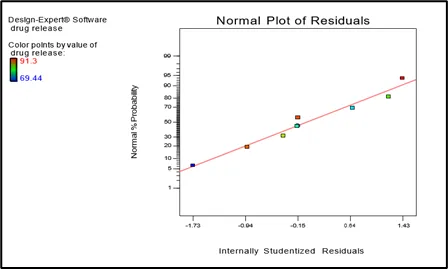
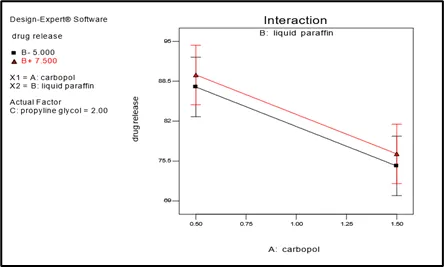
Figure No. 29: Normal plot of drug release Figure No. 30: Predicted vs Actual values plot for Drug release
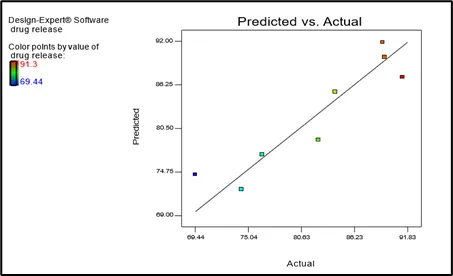
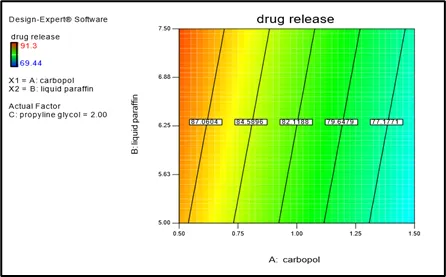
Figure No. 31: Interaction of excipient Figure No. 32: Response surface plot of drug release
Predicted vs actual plot:
Figure30, Predicted values vs Actual values plot for drug release explained the differential residue present between the predicted values and actual values obtained from results. The plot showed the significant value of drug release results i.e. 91.3 which were nearer to the expected value.
With the interaction of excipient figure 37, interaction of excipient plot for drug release is carbapol and liquid paraffin no interaction to each other the plot excipients values of line perpendicular. So, this graph of interaction shows a significant effect on excipient with drug release.
EVALUATION OF EMULGEL
Physical stability
The physical properties (colour, appearance, homogeneity, and phase separation) of optimized Luliconazole emulsion were observed visually and by touching to assess any changes. The homogeneity and texture of Luliconazole emulsion were assessed by pressing a small quantity of Luliconazole emulsion between the thumb and index finger. The optimized Luliconazole emulsion showed yellow color, and pleasing and graceful (transparent or elegant) appearance. Moreover, the Luliconazole emulsion was found to be homogeneous in character or appearance (homogeneous texture) when pressed between the thumb and index finger.
FTIR study of emulgel batch formulation
The FTIR spectrum of Luliconazole emulgel Batch no. F7 As it contains the highest drug content as compared to other batches of the formulation was recorded using FTIR (BRUKER). The spectrum was recorded over the range of wave no.4000-650 cm-1 the spectra observed is shown in figure 33, the values of major peaks in FTIR spectrum of Luliconazole emulgel formulation mentioned in interpretation.
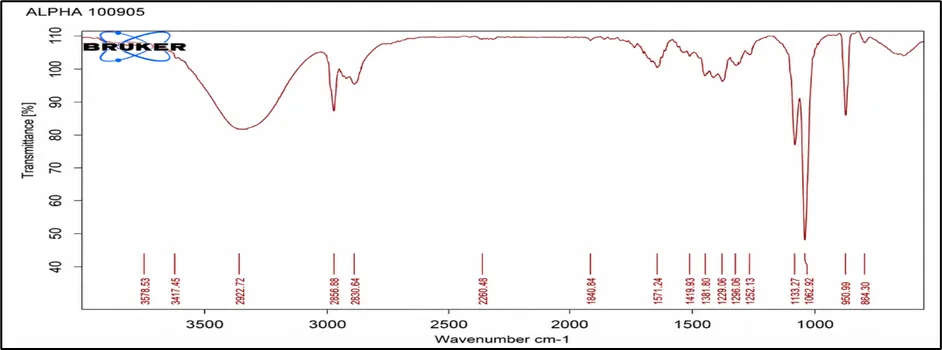
Figure No. 33: The FTIR spectra of Luliconazole Emulgel formulation
Interpretation
• The peaks around 2973–2888 cm⁻¹ confirm the presence of aliphatic C–H stretching.
• The band near 1677 cm⁻¹ corresponds to C=N stretching associated with the imidazole ring of Luliconazole.
• Peaks between 1542 and 1452 cm⁻¹ indicate aromatic ring (C=C) vibrations.
• The 1328–1275 cm⁻¹ region is attributed to C–N stretching.
• Peaks near 1086 and 1044 cm⁻¹ are characteristic of C–O stretching, often arising from the emulgel polymers or excipients.
• The bands at 874 and 802 cm⁻¹ are due to aromatic C–H out-of-plane bending, supporting the presence of the substituted aromatic rings in Luliconazole.
These observations indicate that the characteristic functional groups of Luliconazole remain present in the emulgel formulation, suggesting no significant chemical incompatibility between the drug and formulation excipients.
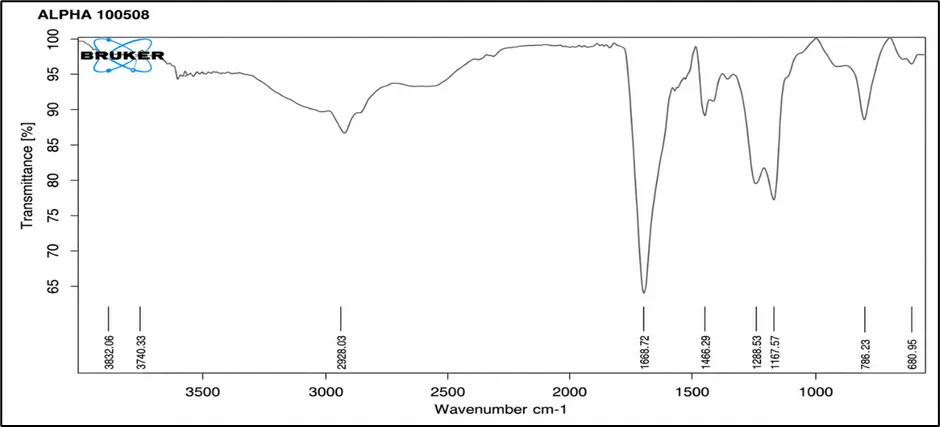
Figure No. 34: FTIR Spectra of carbapol
Table No. 21: IR values of functional groups carbapol
|
Sr no. |
Groups |
Peak (wavenumber) cm -1 (observed) |
|
1 |
O-H (Alcohol) |
2928.03 |
|
2 |
C=O(Amide) |
1696.72 |
|
3 |
CH3 |
1446.29 |
|
4 |
C-O (Ether) |
1229.53 |
Measurement of pH:
“The pH of developed emulgel formulations was determined using a digital pH meter, first, 1gm of emulgel was dissolved in 100 ml distilled water and kept aside for two hours and the measurement of pH of each formulation was done in triplicate and average values are calculated shown in table 22”.
Table No. 22: pH values of formulation F1-F8
|
Sr. No. |
Formulation code |
pH |
|
1 |
F 1 |
6.20±0.36 |
|
2 |
F 2 |
6.50±0.35 |
|
3 |
F3 |
6.34±0.18 |
|
4 |
F4 |
6.64±0.16 |
|
5 |
F5 |
6.10±0.44 |
|
6 |
F6 |
6.03±0.37 |
|
7 |
F7 |
6.15±0.53 |
|
8 |
F8 |
6.69±0.29 |
Selection of optimization of pH:
All formulation batches' pH values vary but F7 batches are good pH value-related standard ranges of pure drug form. Previously characterization selection optimized to F7 batches therefore it was selected as F7 batch this batch pH value is avoided for skin irritation.
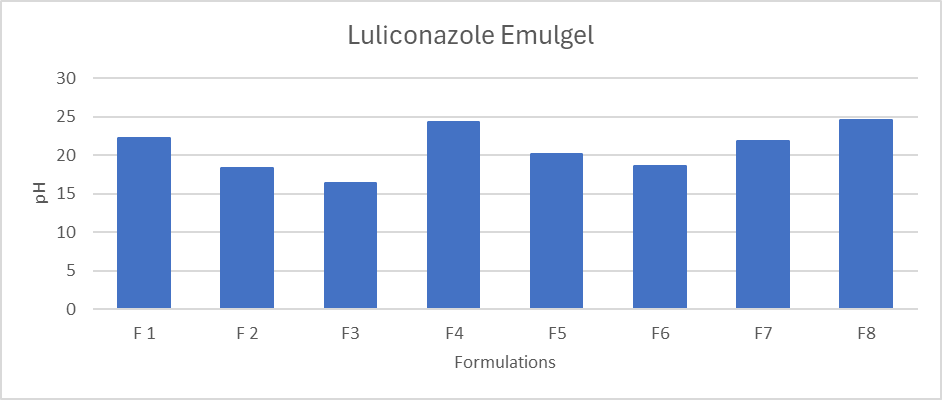
Figure No. 35: Graph of pH F1-F8
Rheological study:
Using a cone and plate viscometer with spindle7 (also known as a Brookfield rheometer), the viscosity of the prepared batches was assessed.
Rheological study of Luliconazole Loaded Emulgel
The viscosity of Luliconazole emulgel was measured via “Brookfield rheometer” (spindled no.7). The viscosity of all the formulations was found to be 3.24(Pa*s) and the average viscosity was found to be 0.3636 shown in table 23. “The observed viscosity of my formulation matched with the viscosity of Standard ranges of pure drug form so, formulation viscosity is appropriate and from these results, we could expect good Stability of formulation, further, physical nature is good in this gel formulation so the therapeutic efficacy of gel formulation is significant”.
The graph shows fig 36 Viscosity of the optimized batch shows an increase in conc. of the polymers; there is an increase in viscosity of emulgel formulation. After the 20 cycles run it is concluded that there is a significant increase in the viscosity and this viscosity is in the acceptance range.
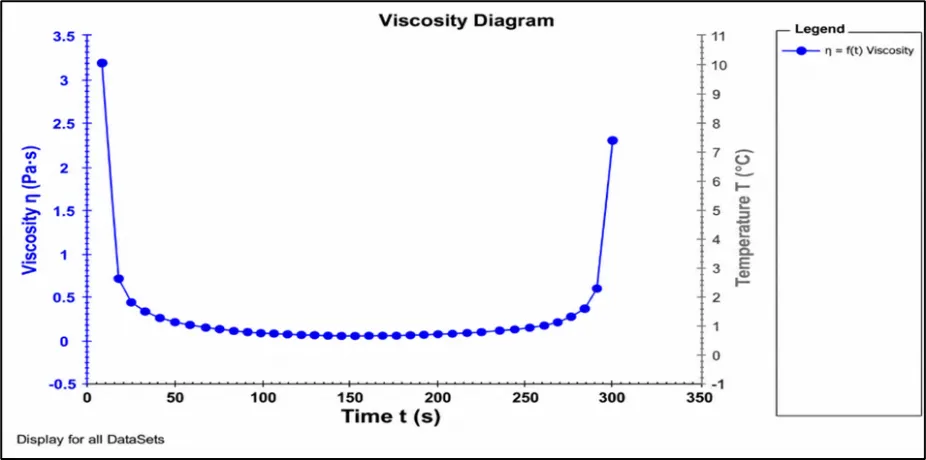
Figure No. 36: Graph of viscosity in Luliconazole
Table No. 23: Basic analysis of viscosity
|
Parameter |
Minimum |
Maximum |
Average |
|
Viscosity (Pa *s) |
0.0874 |
0.248 |
0.3636 |
|
Torque (mNm) |
0.3016 |
1.030 |
0.8723 |
|
Speed (1/min) |
0.3300 |
33.30 |
16.8301 |
|
Speed stess (Pa) |
2.7307 |
9.375 |
7.8982 |
|
Shear rate (1/s) |
0.9900 |
99.9900 |
50.4903 |
|
Kinematic viscosity (m2/s) |
0.0001 |
0.00 2 |
0.0004 |
|
Density (g/cm3) |
1.0000 |
1.00 0 |
1.0000 |
|
Angular velocity (1/s) |
0.0000 |
0.00 0 |
0.0000 |
Thixotropy
Thixotropy is a “property exhibited by non-Newtonian materials, they return to their original viscosity after a lag time when applied shear stress is removed and this is a useful property for topical formulations that ideally should have high consistency or spread easily”.
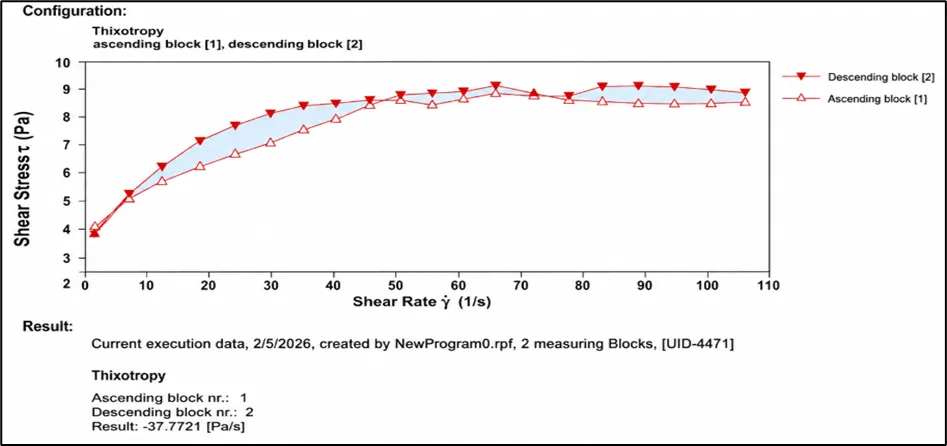
Figure No. 37: Thixotropic graph of Luliconazole gel
Figure 37 the gel formulation shows that “measured ascending and descending curves are not congruent showing that the gel has lower viscosity at any one shear rate on the down curve than it had on the up curve and this indicates that a breakdown of the internal structure of the cream takes place which does not reform immediately when stress is removed, further, the gel undergoes a gel-to-sol transformation and the small area between two curves (hysteresis area) defines the extent of the time- dependant flow behavior”. The smaller size area in Figure shows 37 less time is required for regaining the original viscosity. So the therapeutic efficacy of gel formulation was significant.
Rheological study of loaded marketed Luliconazole marketed formulation emulgel:
The viscosity of Luliconazole emulgel and compare marketed Luliconazole marketed formulation was measured by using “Brookfield rheometer” (spindled no.7). “The viscosity of all the formulations was found to be 3.24 (Pa*s) compare with marketed was found to be 3.12 (Pa*s) and the average viscosity was found to be 0.3052 shown in table 8.15 and the observed viscosity of my formulation matched with the viscosity of Standard ranges of pure drug form so, formulation viscosity is appropriate”. From these results, we could expect good Stability of formulation. Physical nature is good in this gel formulation so the therapeutic efficacy of gel formulation is significant.
The graph shows fig 38 “Viscosity of the optimized batch shows an increase in concentration of the polymers; there is an increase in viscosity of marketed emulgel and after the 20 cycles run it is concluded that there is a significant increase in the viscosity and this viscosity is in the accepted range”.
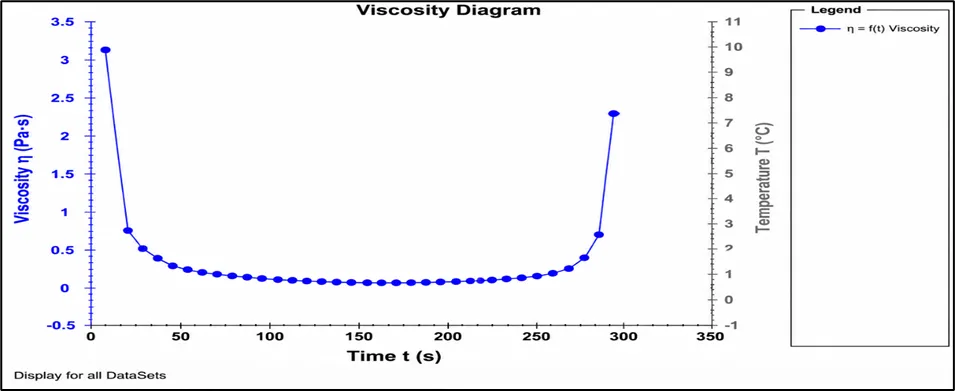
Figure No. 38: Graph of viscosity in Luliconazole marketed formulation
Table No. 24: Basic analysis of viscosity
|
Parameter |
Minimum |
Maximum |
Average |
|
Viscosity (Pa *s) |
0.0813 |
0.3.132 |
0.3052 |
|
Torque (mNm) |
0.2590 |
0.903 |
0.6927 |
|
Speed (1/min) |
0.3280 |
33.3300 |
16.8300 |
|
Speed stess (Pa) |
2.3450 |
8.170 |
6.2713 |
|
Shear rate (1/s) |
0.9840 |
99.90 |
50.4899 |
|
Kinematic viscosity (m2/s) |
0.0001 |
0.001 |
0.0003 |
|
Density (g/cm3) |
1.0000 |
1.000 |
1.0000 |
|
Angular velocity (1/s) |
0.0000 |
0.000 |
0.0000 |
Thixotropy:
Thixotropy is a “property exhibited by non-Newtonian materials, they return to their original viscosity after a lag time when applied shear stress is removed and this is a useful property for topical formulations that ideally should have high consistency or spread easily”.
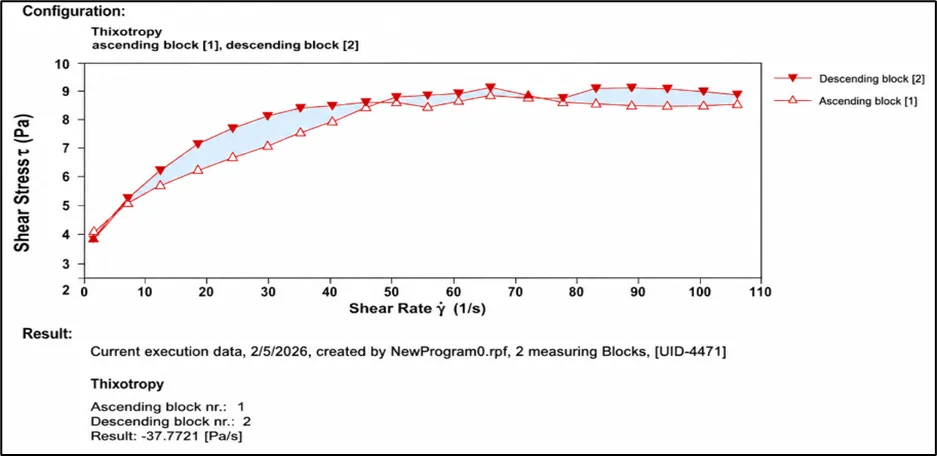
Figure No. 39: Thixotropic graph of Luliconazole marketed formulation
Figure 39 “the standard formulation of Luliconazole marketed formulation shows that measured ascending and descending curves are not congruent showing that the gel has lower viscosity at any one shear rate on the down curve than it had on the up curve and his indicates that a breakdown of the internal structure of the gel takes place which does not change immediately when stress is removed”. The gel undergoes a gel-to-sol transformation. The area between two curves is “very close defines the extent of the time-dependant flow behavior and so comparisons to gel formulation and marketed formulation show similar to the thixotropic graph area show curves close to each other so therapeutic efficacy of significant”.
Particle size determination:
The particle size analysis of the optimized formulations was determined by Zetasizer. 1 gm of Luliconazole is dissolved in water and the result shown in fig 40
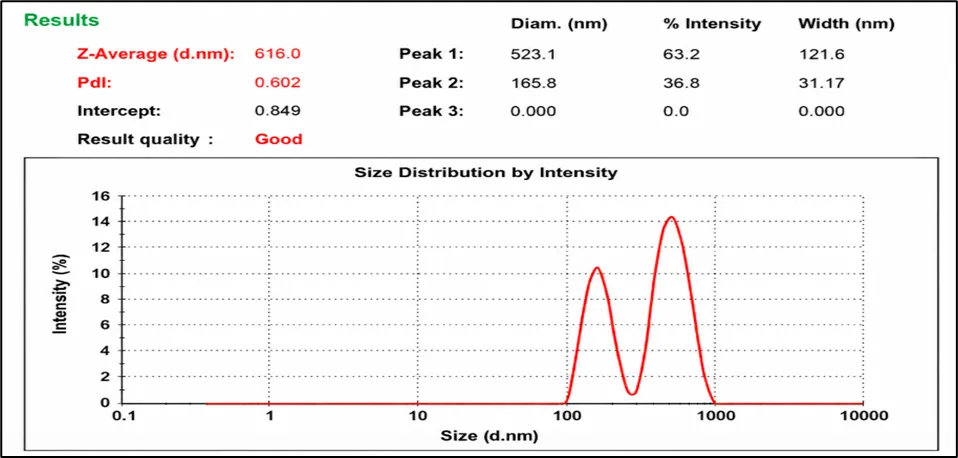
Figure No. 40: Particle size of Luliconazole emulgel
The particle size distribution of Luliconazole emulgel was shown in figure 40 the particle size of the prepared formulation was determined by using a particle size analyzer (Ver. 6.20 Malvern Instruments Ltd. the average particle size of Luliconazole was found to be standard range up to more than 500nm so given results obtained 616nm with PDI 0.602. Therefore, it was concluded that the emulgel formulation formed is monodispersed or uniform in size.
Spreadability:
Spreadability is a term expressed to denote “the extent of the area to which the topical application spreads on application to the skin on the affected parts and the efficacy of a topical therapy depends on the patient spreading the drug formulation in an even layer to administer a standard dose, hence, the determination of spreadability is very important in evaluating topical application characteristics”. The spreadability of the Luliconazole emulgel was found to be 21.80±0.89 g.cm/sec which indicates it has good spreadability. it is calculated using formula and results have been reported in graph.
Table No. 25: Spreadability values of formulation F1-F8
|
Sr no. |
Formulation code |
Spreadability g.cm/sec |
|
1 |
F1 |
22.20±0.48 |
|
2 |
F2 |
18.36±0.56 |
|
3 |
F3 |
16.40±0.92 |
|
4 |
F4 |
24.32±1.11 |
|
5 |
F5 |
20.18±1.68 |
|
6 |
F6 |
18.59±1.66 |
|
7 |
F7 |
21.80±0.89 |
|
8 |
F8 |
24.62±1.26 |
Selection of spreadability formulation:
Previously batches were selected in optimized F7 batch so gel formulation was performed in spreadability F7 batch was good spreading coefficient or uniform size of gel formulation.
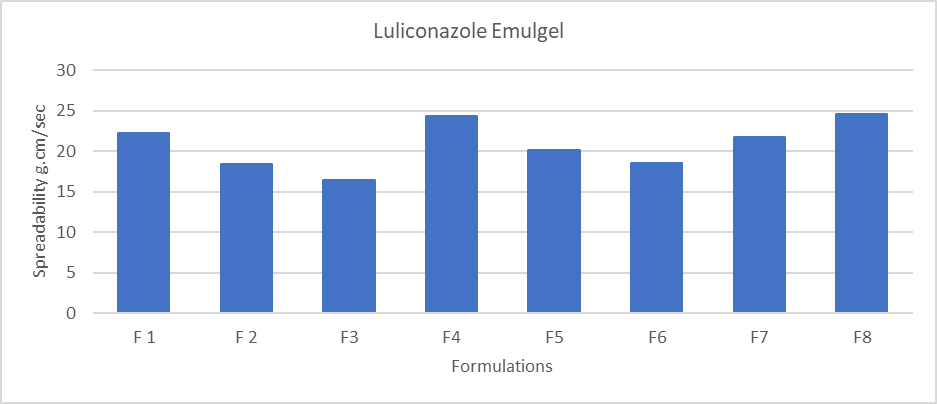
Figure No. 41: Graph of spreadability F1-F8
Microphotograph of Luliconazole emulgel:
Microphotograph of prepared Luliconazole emulgel was captured in digital camera attached microscope at room temp it showed that small globules spread in formulation shown in fig 42.
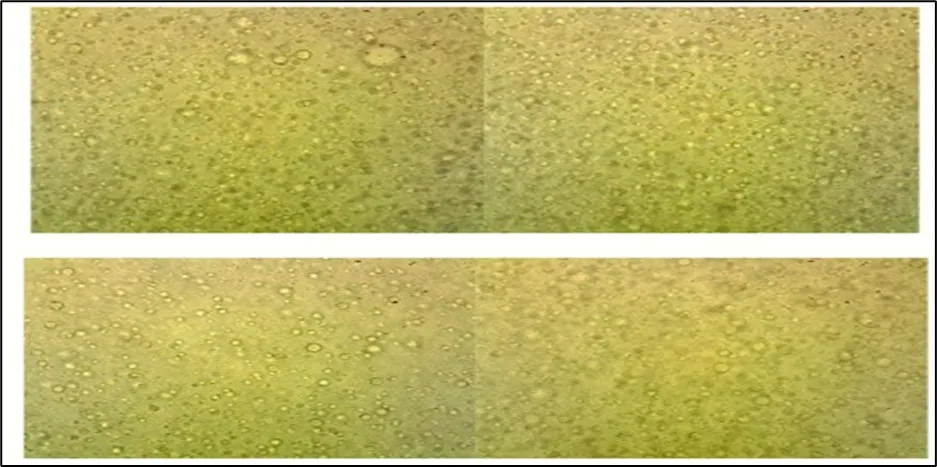
Figure No. 42: Microphotograph of Luliconazole emulgel
Extrudability:
It is a “usual empirical test to measure the force required to extrude from a material tube, and the emulgels were filled into crimped, collapsible tubes and the extrudability of all formulation from the packed material was tested”.
Table No. 26: Extrudability of formulation F1-F8
|
Sr no. |
Formulation code |
Extrudability |
|
1 |
F1 |
Easily extrudable |
|
2 |
F2 |
Easily extrudable |
|
3 |
F3 |
Easily extrudable |
|
4 |
F4 |
Easily extrudable |
|
5 |
F5 |
Easily extrudable |
|
6 |
F6 |
Easily extrudable |
|
7 |
F7 |
Easily extrudable |
|
8 |
F8 |
Easily extrudable |
IN VITRO ANTI-FUNGAL ACTIVITY
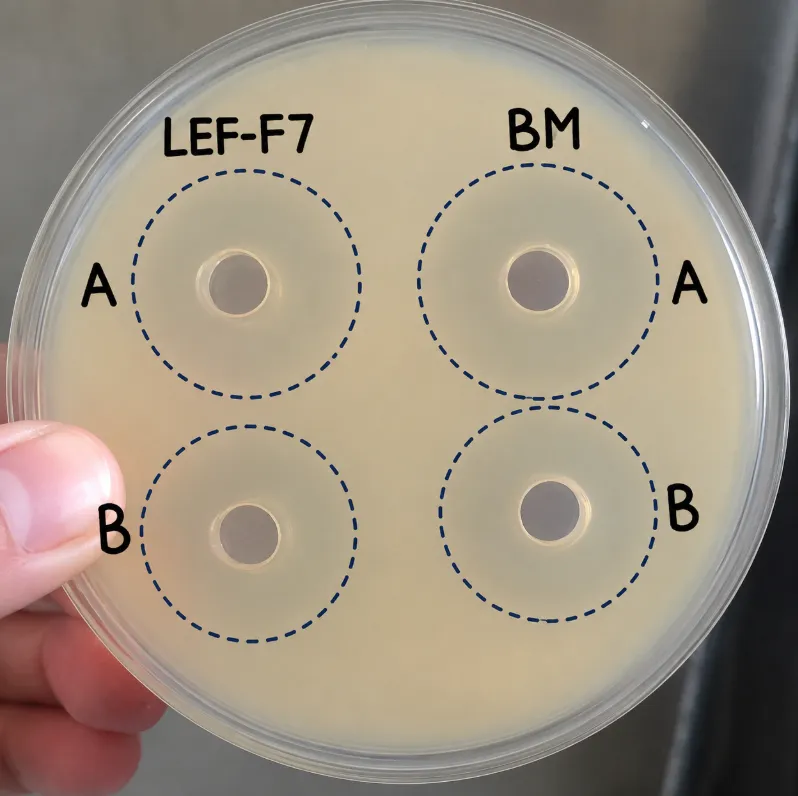
The in vitro antifungal activity of the optimized Luliconazole emulgel formulation was evaluated by the agar well diffusion method and compared with the marketed Luliconazole formulation. The antifungal efficacy was assessed by measuring the zone of growth inhibition (ZGI) against the tested pathogenic fungi.
The optimized Luliconazole emulgel exhibited appreciable antifungal activity against both Candida albicans and Sporothrix schenckii. A zone of inhibition of 24.67 ± 1.06 mm was observed against Candida albicans, while the marketed formulation showed a slightly higher inhibition zone of *27.50 ± 0.94 mm. In contrast, the optimized emulgel demonstrated superior antifungal activity against Sporothrix schenckii, producing a zone of inhibition of 36.83 ± 0.98 mm, compared with 33.84 ± 2.20 mm for the marketed formulation.
The enhanced activity of the optimized emulgel against Sporothrix schenckii may be attributed to improved drug diffusion from the emulgel matrix and better release characteristics of Luliconazole. The formulation provides efficient dispersion of the drug and prolonged residence time at the application site, resulting in effective fungal growth inhibition. Overall, the developed Luliconazole emulgel exhibited antifungal activity comparable to or better than the marketed product, suggesting its suitability as an effective topical dosage form for the treatment of fungal skin infections.
Table No. 27: antifungal activity of Luliconazole Emulgel and marketed formulation
|
Parameters |
Formulations |
||
|
Luliconazole Emulgel Formulation (LEF-F7) |
Marketed Batch (BM) |
||
|
Zone of growth inhibition (mm) |
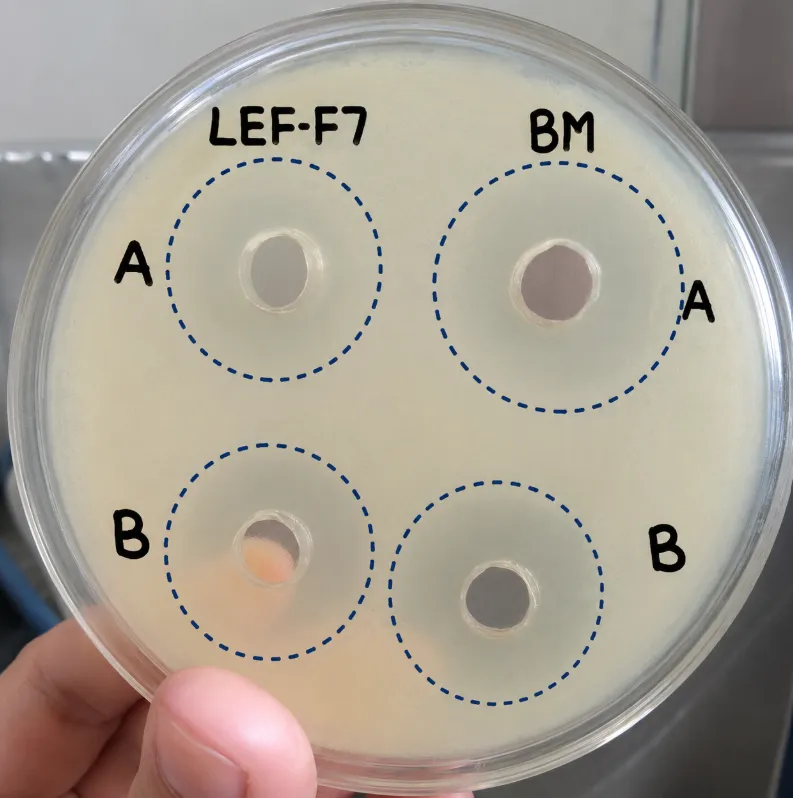
Candida albicans |
24.67±1.06 |
27.50±0.94 |
|
Sporotheix schenckii |
36.83±0.98 |
33.84±2.20 |
|
CONCLUSION
The present study was undertaken to formulate, optimize, and evaluate a Luliconazole-loaded emulgel for topical antifungal therapy. Preformulation studies confirmed the identity, purity, and suitability of Luliconazole for formulation development. FTIR analysis revealed the characteristic functional groups of the drug, while DSC studies demonstrated its crystalline nature with a sharp endothermic peak around 180°C. Drug–excipient compatibility studies confirmed the absence of significant interactions between Luliconazole and the selected excipients.
Eight emulgel formulations (F1–F8) were prepared using varying concentrations of Carbopol, liquid paraffin, and propylene glycol. Optimization was carried out using a Central Composite Design (CCD) and response surface methodology. Among all formulations, batch F7 exhibited the highest drug content (103 ± 1.23%) and maximum in vitro drug release (91.3 ± 1.49%), and was therefore selected as the optimized formulation.
Statistical analysis using ANOVA demonstrated that formulation variables significantly influenced drug content and drug release responses. The optimized formulation showed desirable physicochemical characteristics, including homogeneous appearance, acceptable pH (6.15 ± 0.53), appropriate viscosity, excellent spreadability (21.80 ± 0.89 g·cm/s), and good extrudability.
Particle size analysis indicated an average particle size of 616 nm with a PDI of 0.602, suggesting uniform particle distribution within the emulgel system. Rheological studies confirmed pseudoplastic and thixotropic behavior, which is advantageous for topical application and patient compliance.
The antifungal activity of the optimized formulation was evaluated against Candida albicans and Sporothrix schenckii using the agar well diffusion method. The optimized emulgel exhibited a zone of inhibition of 24.67 ± 1.06 mm against Candida albicans and 36.83 ± 0.98 mm against Sporothrix schenckii. The formulation demonstrated comparable or superior antifungal activity compared to the marketed formulation, particularly against Sporothrix schenckii, indicating enhanced drug diffusion and therapeutic performance.
Overall, the developed Luliconazole emulgel demonstrated excellent physicochemical properties, satisfactory drug release characteristics, and potent antifungal activity, making it a promising topical drug delivery system for the treatment of fungal skin infections.
The present investigation successfully developed and optimized a Luliconazole-loaded emulgel for topical antifungal application. Preformulation studies confirmed the purity and compatibility of Luliconazole with the selected excipients. The optimization process using response surface methodology identified formulation F7 as the optimized batch, exhibiting maximum drug content (103 ± 1.23%) and in vitro drug release (91.3 ± 1.49%).
The optimized emulgel showed desirable physicochemical properties, including acceptable pH, suitable viscosity, good spreadability, excellent extrudability, and satisfactory rheological behavior. FTIR and DSC studies confirmed the stability of the drug within the formulation and indicated the absence of any significant drug–excipient interaction.
Furthermore, the optimized formulation exhibited significant antifungal activity against Candida albicans and Sporothrix schenckii. The enhanced antifungal performance, particularly against Sporothrix schenckii, suggests improved drug diffusion and prolonged retention at the site of application. The formulation also demonstrated comparable or better efficacy than the marketed product.
Therefore, it can be concluded that the developed Luliconazole emulgel is a stable, effective, and patient-friendly topical delivery system with considerable potential for the treatment of fungal skin infections. Further in vivo and clinical studies are recommended to establish its therapeutic efficacy and commercial applicability.
ACKNOWLEDGEMENT
The authors express sincere gratitude to the management and faculty members of the Mandesh Institute of Pharmaceutical Science and Research centre, Mhasawad, Satara for providing the necessary laboratory facilities and continuous support to carry out this research work successfully. Special thanks are extended to colleagues and friends for their encouragement and cooperation throughout the study.
CONFLICT OF INTEREST
The authors declare that there is no conflict of interest regarding the publication of this research work. The study was carried out independently without any financial or commercial influence that could affect the outcome of the research.
REFERENCES




Anushka Lad, Digvijay Patil, V. N. Kodalkar[, Dr Naga Raju Potnur, Formulation and Evaluations of Luliconazole Loaded Nanoemulgel for Topical Application, Int. J. of Pharm. Sci., 2026, Vol 4, Issue 7, 2698-2727, https://doi.org/10.5281/zenodo.21349876
 10.5281/zenodo.21349876