
We use cookies to ensure our website works properly and to personalise your experience. Cookies policy
Srinath College of Pharmacy, Waluj, Chhatrapati Sambhajinagar, Maharashtra -431136, INDIA.
One of the most popular analytical techniques in the fields of chemistry, medicine, Biochemistry, and environmental sciences is ultraviolet (UV) and visible spectroscopy. Its foundation is the idea that electromagnetic radiation in the visible (400-800nm) and ultraviolet (200-400nm) spectrums is absorbed, leading to electronic transitions within molecules. The principles, equipment, and uses of UV- visible spectroscopy are all thoroughly covered in this review. The concept of electronic transitions, Beer-Lambert law, Auxochromes, Chromophores, solvent effects, and both quantitative and qualitative applications are emphasized. The article also discusses recent advancements like UV- imaging, miniaturized devices for real-time analysis, and the coupling of UV detectors with chromatographic techniques (HPLC-UV). The review also looks at UV spectroscopy’s drawbacks, such as its reliance on chromophores and problems with selectivity, but it also highlights the technology’s potential in contemporary analytical science. The purpose of this paper is to provide a comprehensive resource for professionals, researchers, and students who want to learn more about UV- visible spectroscopy.
Spectroscopy’s Function in Chemistry and Medicine One of the most basic and useful methods for studying matter is spectroscopy. It addresses how electromagnetic radiation interacts with atoms or molecules and offers important information about their dynamics, structure, and bonding. Spectroscopy aids in the identification of compounds, the assessment of their purity, and the comprehension of electronic structures in chemistry. Spectroscopic methods are crucial for drug analysis, formulation research, stability testing, and quality control in the pharmaceutical industry. Because of its ease of use, accuracy, and versatility, ultraviolet-visible (UV-Vis) spectroscopy has continued to be one of the most popular spectroscopic techniques. Unlike more advanced and complex techniques such as NMR or Mass spectroscopy, UV-Vis spectroscopy requires relatively simple instrumentation and minimal sample. It is a measuring tool used for quantitative analysis, typically for chemical substances, by figuring out how much light is partially absorbed by the analyte in the solution. It can be categorized by spectral region, including near infrared (from 800 nm to 2500 nm), VIS (from 380 nm to 750 nm), and UV (from 190 nm to 380 nm). The fundamental principle entails the absorption of visible and ultraviolet radiation (200-400), which is linked to the excitation of electrons.
The fundamental idea is that excitation of electrons from low to high energy levels is linked to the absorption of visible and UV radiation (200-400nm). It is also referred to as electron spectroscopy and involves the observation of electrons. It entails calculating the electromagnetic radiation (EMR) that is absorbed or released when the sample’s molecules, atoms, or ions transition between different energy states. From lower to higher energy states.
In essence, UV spectroscopy measures the different wavelengths of ultraviolet light that are absorbed or transmitted by a sample in relation to a blank. The feature, which is directly tied to the composition of the sample, can reveal details about its constituent parts and concentrations. Results from UV spectroscopy are displayed as spectra in a graphical format, providing both a visual and quantitative depiction of the spectra.
Using spectroscopic techniques, other researchers have also examined natural blood samples from healthy individuals in order to diagnose the disease as well as comprehend its biological nature.
2.Principle
The UV visible principle involved the distinctive spectra that are created chemicals absorb visible or ultraviolet light from the basis of spectroscopy. The foundation of spectroscopy is the relationship between matter and light. When the sample absorbs light and experiences excitation and de-excitation phases, a spectrum is produced. An electromagnetic wave can hit a material and cause it to to transit, absorb, reflect, or scatter. (Sheikh Wajiha Shabbir & Shilpi Chauhan, 2024)
2.1. Electronic transitions
The molecules in the sample will undergo an electronic change when ultraviolet or visible light is absorbed by it. As a result, the electrons will be elevated from their ground state orbit to higher energy orbits that are excited by the energy of the absorbed light or antibonding orbit.
There are three different kinds of ground state orbits could be involved:
Two kinds of antibonding orbitals, that also be involved in the transition process and these are:
Because of n electrons do not form bonds, there is no antibonding orbital. As a result, electronic transitions can occur through the absorption of visible and ultraviolet light.
The following are the electronic transitions brought about by the absorption of visible and ultraviolet light:
3. n to π*
4. π to π* (Azhar S. Alaboodi et al., 2025)
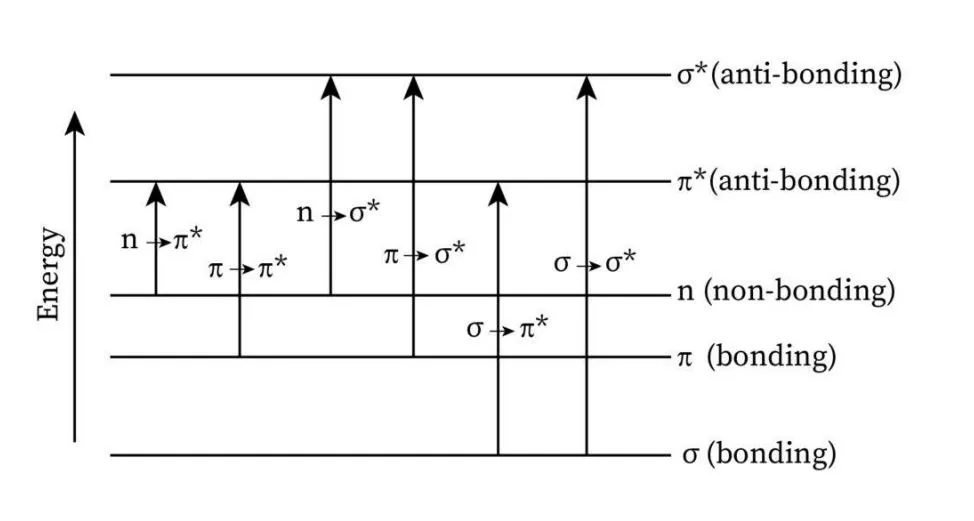
Fig:-1 Electronic Transition
1. σ to σ* Transitions
2.2. Terminologies
1. Wavelength
The distance between two successive points in the same wave phase, such as crest to crest or trough to trough, is known as the wavelength. It is commonly represented by the Greek letter λ(lambda) and indicates the length of one full wave cycle.
2. Radiant Power
The rate at which a source emits or transfers electromagnetic energy, such as light or infrared radiation, is known as radiant power.
3. Transmission
The percentage of incident light that flows through a sample is known as its transmittance. The ratio of the incident radiant power to the transmitted radiant power.
4. Absorbance
The amount of light absorbed by a sample is expressed as a logarithmic measure of absorbance, formerly known as optical density.
Absorbance is directly proportional to the concentration of absorbing species and the pathlength of the sample, according to Beer Lambert’s law.
5. Chromophores
These are the compounds which shows the presence of a functional group that gives the compound its colour or any group that exhibits absorption of electromagnetic radiation in both the visible and ultraviolet spectrums.
These are covalently unsaturated spectrums.
Ex. NO2 group
6. Auxochromes
A group that does not act as a chromophore on its own, but when combined with one, alters absorption maxima at longer wavelengths and increases absorbance intensity. For instance, the groups -OH, -NH2, -OR, -NHR, -NR2, etc. Benzene’s absorbance maxima shifts from 255 to 280nm.(Ghosh & Nandi, n.d.)
2.3. Spectral Shifts
In UV-visible spectroscopy, a “spectral shift” is a change in the absorption maximum (either to higher or lower wavelengths) brought on by structural or environmental changes in the sample. By examining these shifts, one can gain insight into the interactions and characteristics of molecules. (Sheikh Wajiha Shabbir & Shilpi Chauhan, 2024)
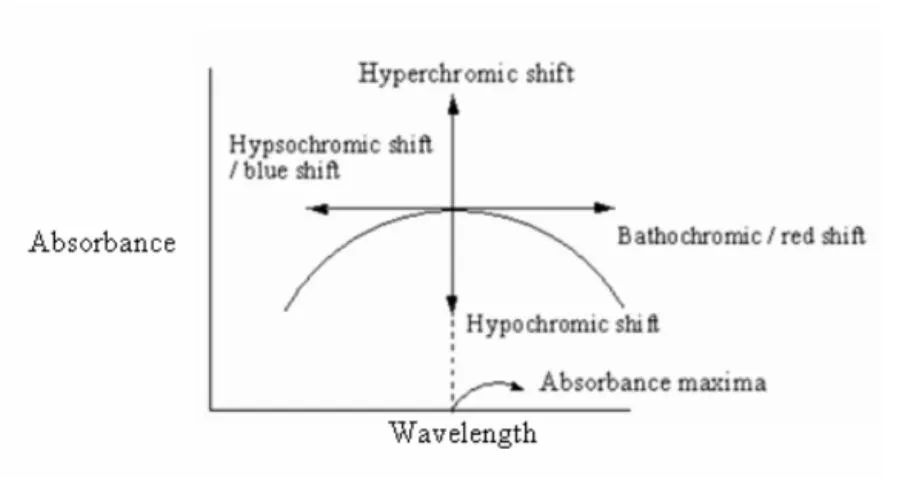
Fig:-2 Spectral Shift
Changes in the polarity of the solution or the elimination of conjugation in a system may cause a shift in absorbance maxima towards the shorter wavelength.
A shift in absorbance maxima toward longer wavelengths brought on by a change in solvent or the presence of particular groups like -OH or -NH2 group (auxochrome).
A possible increase in absorption intensity brought on by the addition of auxochrome. For instance, adding a methyl group to pyridine at position two results in hyperchromic effect
Reduction in absorption intensity, potentially brought on by groups that have the ability to change the molecular structure. For instance, a hypochromic effect is produced when a methyl group is introduced at position 2 of the biphenyl moiety. (Ghosh & Nandi, n.d.)
2.4. Beer and Lambert’s Law
The Beer-Lambert’s law is the most crucial idea in absorption analysis. According to this law, concentration and absorbance have a linear relationship for a given ideal solution as long as the pathlength remains constant; the absorptivity € is constant for every molecule at every wavelength.
A = €cl
Where,
A= Dimensionless quantity known absorbance
€ = Absorptivity or Molar Extinction Coefficient, also known as Epsilon
c = concentration of the absorbing species solution
l = Light’s pathlength through the solution; it is commonly expressed in centimetres
Deviations from beer lambert’s law
If a graph between absorbance and concentration shows a straight line going through origin, the system is said to be Beer and Lambert’s law. However, the linear relationship between absorbance and concentration is never entirely maintained, especially at higher concentrations; as a result, the absorption curve varies as the solution’s concentrations does.
The deviation could be either positive or negative.
The reasons for deviation of beer lambert’s law
It is also called as chemical deviation.
One significant chemical deviation is colour change brought on by solvent dilution. Example: A deviation in the absorption curve is expected because benzoic acid and benzene combine to form a dimer.
3.Instrumentation
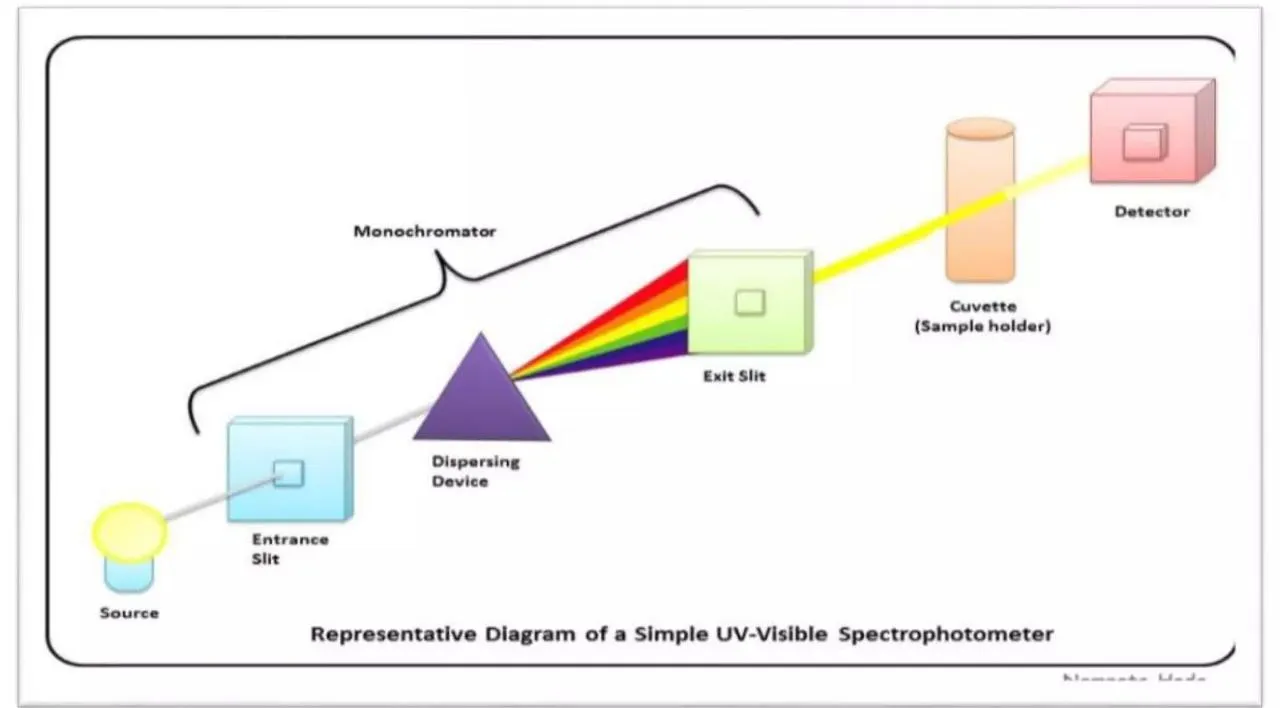
Components – A spectrophotometer is a device that measures a sample transmittance absorbance in relation to the electromagnetic radiation’s wavelength.
To gather UV absorption spectra, two kinds of absorbance instruments are available land they are:
To analyze one wavelength at a time, the single beam instrument places a filter or monochromator between the source and the sample.
More accurate analysis is mad possible by the double beam instrument’s single source and monochromator, which are followed by a splitter and a number of mirrors to direct the beam to a reference sample and the sample for analysis. Double beam UV spectrophotometers are typically faster and more effective simultaneous instruments.
The essential components of a spectrophotometer are :
3.1. Light Source
The perfect light source would produce long term stability, low noise, and a consistent intensity across all wavelengths. Various sources of ultraviolet radiation include:
3.2. Monochromator (wavelength selector)
Monochrome devices, which are thought to be superior to filters in terms of efficiency, are used to transform heterochromatic or multi-coloured light into monochromatic light.
The following parts make up the monochromator:
Polychromatic light enters the monochromator through the entrance slit, and then the beam is collimated and angled toward the dispersion component.
Prism – A prism uses sunlight to create a rainbow. Spectrophotometers operates on the principle of same principle. The dispersion produced by prisms is angularly nonlinear, despite their simplicity and low cost. Additionally, temperature affects the angle of dispersion.
Grating – These gadgets are constructed from glass blanks with extremely thin grooves. Reflecting source is created by applying an aluminium coating. Depending on the wavelength, light falling on the grating is reflected at various angles. Light is simultaneously dispersed and focused by a concave grating. (Owen, n.d.)
3.3. Sample Cell or Sample holder
For radiation to flow through, they require transparent containers. The cuvettes with wavelengths between 350 and 2000 nm are made up from quartz or fused silica. In the visible spectrum, these cells are likewise transparent. (Azhar S. Alaboodi et al., 2025)
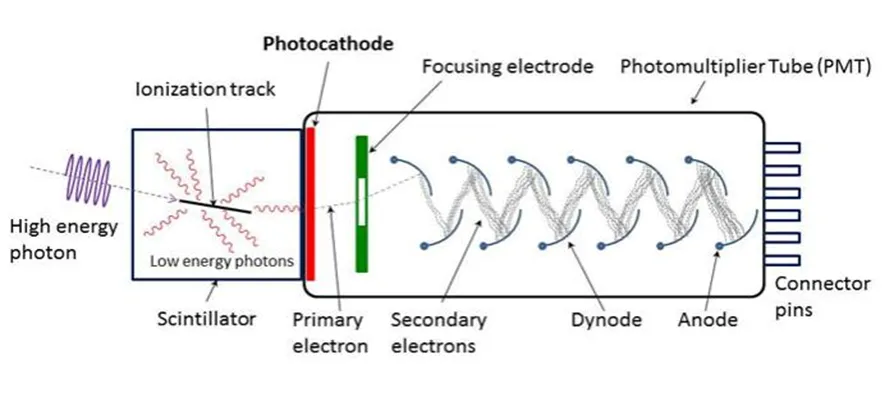
3.4. Detectors
A light signal is transformed into an electrical signal by a detector. Over a broad range of low noise and high sensitivity, it bought to provide a linear response.
The photomultiplier tube is a commonly used detector in UV-Vis spectroscopy. It consists of a photoemissive cathode that releases electrons when exposed to photons of radiation and an anode that releases multiple electrons for each electron that strikes it. A photon of radiation enters the tube and hits the cathode, causing the release of multiple electrons. These electrons are driven by the initial anode, which is 90 volts more positive than the cathode. Multiple electrons are released for each incident electron that hits the first electrode.
The photomultiplier tube combines multiple amplification stages inside the tube body with signal conversion. Spectral sensitivity is determined by the cathode material’s composition. Across the whole UV-visible spectrum, a single photomultiplier produces good sensitivity. At low light levels, this kind of detector produces high sensitivity. High sensitivity, on the other hand, is linked to low concentrations in analytical spectroscopy applications, which lead to low absorbances and high intensity levels. The detector needs to have low noise at high intensity levels in order to precisely detect minute variations between blank and sample measurements. Resulting in the emission of multiple electrons for every electron that is incident. In order to create more electrons
that are accelerated towards the anode, these electrons are subsequently accelerated towards the second anode. The anode is where the electrons are gathered. Each initial photon has now generated between 106 and 107 electrons. They measure and amplify the resultant current. Photomultipliers are extremely sensitive to visible and ultraviolet light. Their reaction times are quick . (Sheikh Wajiha Shabbir & Shilpi Chauhan, 2024)
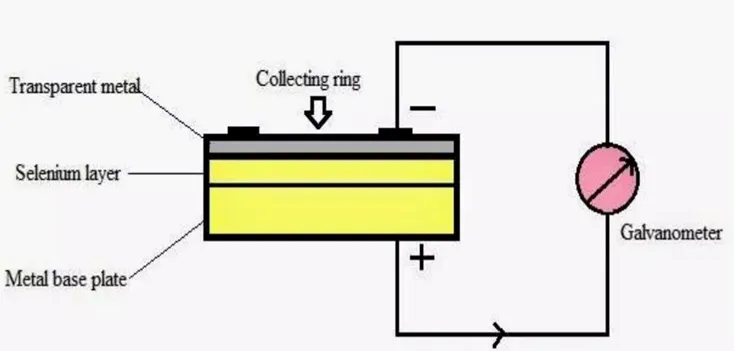
The measurement and detection of radiation in the visible spectrum is the main application for barrier layer cells. This cell has a maximum sensitivity of roughly 550 nm.
It is made up of a flat copper or iron electrode with a layer of semiconducting material, like selenium copper oxide, deposited on it. The second or collector electrode is a transparent metallic layer of lead, gold, or silver that is present on the semiconductor's surface.
The metal-selenium interface serves as a barrier to prevent electrons from passing through.
If the film is connected to the plate on the opposite side of the semiconducting layer via an external circuit and the resistance is very low, electrons from the oxide layer have enough energy to cross this barrier and move from semiconductor to metal film. The current generated by the flow of electrons can be measured with a galvanometer or microammeter. (Sudarshan and Sweta 2023, n.d.)
3.5. Readout system
Used for amplification of electric signal and alteration of DC to AC.
Generated electric signal is amplified and finally recorded in computerized system.
This is the main system which shows the process is completed or not by giving out the response/result in the form of spectrum, graph, numeric representation.
Without this we can do whole analysis but cannot get the result of report so to get the report of analysis this system is required.
It mainly includes a computer with proper software connected to the UV instrument and attached with printer.
4.Limitations and Challenges
Despite its versatility and widespread use, UV-Vis spectroscopy is not without limitations. Both theoretical and instrumental constraints can influence accuracy, reproducibility, and interpretive clarity. Understanding these challenges is critical for ensuring reliable analytical performance and appropriate application selection (Mandru et al., 2023; Sheikh Wajiha Shabbir & Shilpi Chauhan, 2024; Sudarshan and Sweta 2023, n.d.)
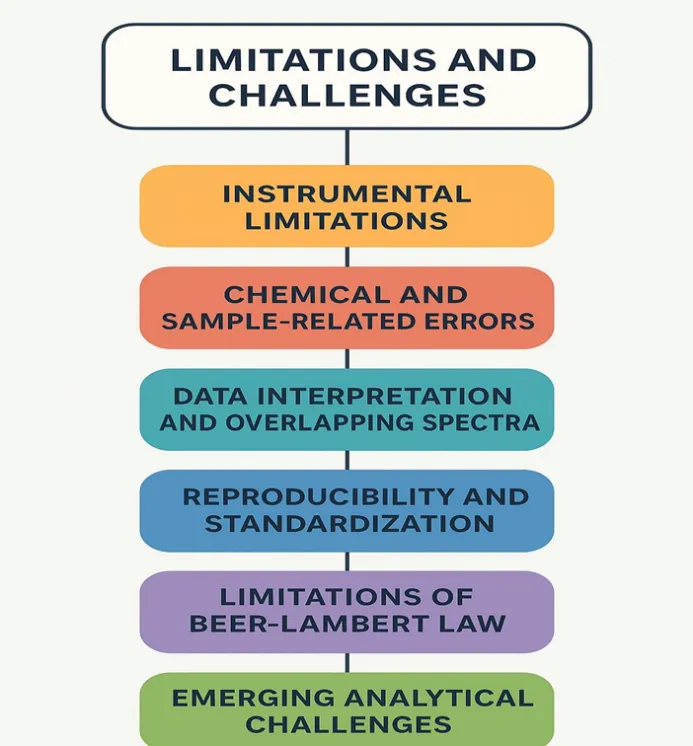
4.1. Instrumental Limitations
Instrumental imperfections are a primary source of analytical variability. Stray light, baseline drift, and detector noise can introduce significant errors, particularly at high absorbance levels (Mandru et al., 2023). Stray light—unwanted radiation that reaches the detector—reduces the apparent absorbance and limits linearity at higher concentrations (Azhar S. Alaboodi et al., 2025; Owen, n.d.). Calibration and regular maintenance are necessary to minimize such effects .Lamp instability is another concern, as the output of deuterium or tungsten sources may degrade over time, altering intensity and wavelength accuracy . Modern diode and LED sources alleviate this issue to some extent, but periodic validation remains essential (Primer-Uv-Vis-Basics-5980-1397en-Agilent, n.d.; Sudarshan and Sweta 2023, n.d.; Smith et al., 2015).
4.2. Chemical and Sample-Related Errors
Chemical interactions within the sample can also cause deviations from ideal behavior predicted by the Beer–Lambert law. For example, association, dissociation, or solvent–solute interactions may alter the effective concentration of absorbing species.Turbid or highly scattering samples lead to apparent absorbance changes unrelated to molecular absorption, reducing quantitative reliability (Owen, n.d.; Primer-Uv-Vis-Basics-5980-1397en-Agilent, n.d.; Sudarshan and Sweta 2023, n.d.).Moreover, pH and temperature variations can influence electronic transitions, shifting λ_max and affecting intensity . These factors are especially relevant in biochemical and environmental analyses where sample matrices are complex and variable.(Azhar S. Alaboodi et al., 2025; Sudarshan and Sweta 2023, n.d.; Upstone, 2000)
4.3. Data Interpretation and Overlapping Spectra
Another challenge lies in the interpretation of complex spectra. When multiple species Absorb in similar regions, spectral overlap complicates quantitative assessment (Primer-Uv-Vis-Basics-5980-1397en-Agilent, n.d.; Vogt et al., 2023). Traditional single-wavelength approaches may fail to resolve components accurately, Leading to cross-interference (Primer-Uv-Vis-Basics-5980-1397en-Agilent, n.d.; Sudarshan and Sweta 2023, n.d.). Although chemometric models can mitigate this issue,They require careful calibration and validation to ensure reliability (Primer-Uv-Vis-Basics-5980-1397en-Agilent, n.d.; Vogt et al., 2023).
4.4. Reproducibility and Standardization
Reproducibility remains a critical concern in UV-Vis analysis. Differences in instrument Calibration, cuvette quality, and environmental conditions can lead to interlaboratory Variability (Mandru et al., 2023; Smith et al., 2015). Standard reference materials such as potassium dichromate and Holmium oxide solutions are used to verify performance, yet inconsistency in calibration Frequency can affect long-term comparability (Primer-Uv-Vis-Basics-5980-1397en-Agilent, n.d.; Sudarshan and Sweta 2023, n.d.; Smith et al., 2015). Establishing standardized analytical Protocols is vital, particularly in regulatory and quality-control applications (Mandru et al., 2023; Upstone, 2000).
4.5. Limitations of Beer–Lambert Law
While the Beer–Lambert law provides the theoretical basis for UV-Vis analysis, its validity Assumes linearity between absorbance and concentration—an assumption that breaks Down at high solute concentrations or in non-ideal systems (Azhar S. Alaboodi et al., 2025; Mandru et al., 2023; Owen, n.d.). Deviations occur due to changes in refractive index, stray light, or chemical interactions that affect the molar Absorptivity coefficient (Azhar S. Alaboodi et al., 2025; Mandru et al., 2023; Owen, n.d.). Correcting for these deviations requires empirical Calibration and careful selection of concentration ranges (Azhar S. Alaboodi et al., 2025; Mandru et al., 2023).
4.6. Emerging Analytical Challenges
With the rapid expansion of nanomaterials and complex biological systems, UV-Vis Spectroscopy faces new interpretive challenges. The presence of broad or featureless Absorption bands in nanoparticles, polymers, or biological macromolecules complicates Peak assignment and quantitative interpretation (Picollo et al., 2019; Vogt et al., 2023). Furthermore, the growing use of Hybrid spectroscopic systems demands improved data integration and standardization across techniques (Sudarshan and Sweta 2023, n.d.; Vogt et al., 2023). Continued technological advancement will be essential to overcome these limitations and fully exploit the analytical potential of UV-Vis spectroscopy
CONCLUSION
UV-Visible spectroscopy remains one of the most fundamental and widely utilized analytical techniques in modern science. Its core principle – the measurement of light absorption by matter – continues to provide critical insights into molecular structure, concentration, and interactions. Over time, UV-Vis spectroscopy has evolved from a simple laboratory method to a sophisticated, high-precision analytical tool serving fields as diverse as pharmaceuticals, catalysis, clinical chemistry, environmental monitoring, and nanotechnology.
The technique’s enduring value lies in its versatility, simplicity, and adaptability. Continuous improvements in optical components, detector technology, and software integration have enhanced measurement accuracy and reproducibility . Despite certain limitations such as spectral overlap, deviations from the Beer-Lamberts law, and instrument related errors UV-Vis spectroscopy remains a cornerstone of both qualitative and quantitative analysis.
REFERENCES
Vogt, C., Wondergem, C. S., & Weckhuysen, B. M. (2023). Ultraviolet-Visible (UV-Vis) Spectroscopy. In I. E. Wachs & M. A. Bañares (Eds.), Springer Handbook of Advanced Catalyst Characterization (pp. 237–264). Springer International Publishing. https://doi.org/10.1007/978-3-031-07125-6_11


Shraddha Siraskar, Shreyash Somani, Khushi Singh, Pranjal Sonwane, Shubhangi Bichewar, Fundamental Properties Of UV-Visible Spectroscopy, Int. J. of Pharm. Sci., 2026, Vol 4, Issue 6, 148-158, https://doi.org/10.5281/zenodo.20485736
 10.5281/zenodo.20485736