

We use cookies to ensure our website works properly and to personalise your experience. Cookies policy
SSM College of Pharmacy, Affiliated to The Tamil Nadu Dr. M.G.R. Medical University, Tamil Nadu.
Background: Coronary Artery Disease continues to place a substantial burden on healthcare systems, yet the way it develops and presents can differ between men and women. These differences are often under-recognized in routine clinical practice and may influence both diagnosis and outcomes. Therefore, the present study was undertaken to explore how coronary artery disease varies between genders in terms of symptom profile, clinical findings, treatment approaches, and predicted short-term mortality using the GRACE risk score.Method: A prospective observational study was conducted at the Sudha Institute of Medical Science, Erode, from September 2025 to February 2026, involving 350 participants with equal representation of males and females who are diagnosed with coronary artery disease based on clinical presentation, Electrocardiogram and angiographic findings. Information regarding patient characteristics like clinical symptoms experienced, diagnostic techniques used, treatment given, and Global Registry of Acute Coronary Events risk scores was calculated and analysed to identify gender related differences in coronary artery disease patients.Result: Women more often presented with atypical symptoms, while men commonly had classical chest pain. Men showed clearer signs of acute myocardial injury, whereas women had less specific diagnostic changes. Interventional treatments were more frequent in men, while women were managed more conservatively or surgically. Global Registry of Acute Coronary Events risk score assessment indicated that women were more often in higher-risk categories (p = 0.03), suggesting a greater six-month mortality riskConclusion: The findings highlight meaningful gender-related differences in the presentation and progression of CAD. Although women often show less severe structural disease, their overall risk profile appears higher. Recognizing these distinctions is important for improving early detection, tailoring management strategies, and optimizing patient outcomes
Cardiovascular diseases (CVDs) are a group of conditions affecting the heart and blood arteries [1]. The Crude CV Mortality is expected to be rapidly rise by 73.4% demonstrating that the Ageing global populace will be an important driver of the CV burden [2]. Coronary artery disease (CAD) is a common cardiac illness that causes the major blood channels to constrict or get blocked. Plaque which is defined as a fatty substance formed by LDL Cholesterol deposition inside the intima, luminal narrowing that leads to myocardial ischemia which is the main cause of CAD [3].
Women frequently experience atypical symptoms of CAD, such as fatigue, dyspnea, dyspnea on exertion, sweating, epigastric pain and nausea, whereas men usually exhibit "classic" symptoms, such as chest discomfort, radiating pain. Stress and emotional variables could affect women with CAD more profoundly, perhaps initiating symptoms [4,5]. Evaluation of CAD in women is further restricted by lower accuracy of electrocardiographic response to exercise stress tests in women compared within men [6]. In women who are more likely to present with nonobstructive CAD, a condition that has a worse prognosis even though it is frequently written off as not important, imaging modalities for stress testing may be less than ideal [7].Furthermore, despite having a greater load of comorbidities and worse outcomes than males, women are less likely to obtain guideline-directed medical therapy, according to observational data [8].
The GRACE score incorporates eight independent prognostic variables including age, heart rate, systolic blood pressure, serum creatinine, Killip class, cardiac arrest at admission, ST-segment deviation, and elevated cardiac biomarkers [9]. GRACE risk score is distinct in that it predicts both short-term outcomes like in-hospital mortality, as well as long-term outcomes that extend to six months or longer. This is advantageous in that it guides the clinician in both acute care and discharge planning [10]. The current study provides a comprehensive gender-based analysis of the disease by simultaneously examining the presentation of the disease, diagnostic results, treatment practices, and risk stratification using the GRACE risk score in a real-world scenario. Also previously, the GRACE score was calculated by the retrospective data of the patients but the present study includes the real-world population in the hospital to calculated the mortality risk in CAD patients.
MATERIALS AND METHODS:
The prospective observational study was conducted in the Department of cardiology Sudha Hospital Erode, after obtaining approval from the Institutional Ethics Committee (ECR/948/Inst/TN/2018/RR-22). A specially designed data collection form was used to record patient demographics and drug therapy details. Patients who came to the hospital during the study period with coronary artery disease as diagnosis and satisfying all the inclusion criteria were selected for the study then Data from male and female patients were compared to evaluate differences in clinical presentation, diagnosis, treatment patterns and analyzed the probability of 6 months mortality risk using GRACE risk score.
Study Criteria:
Inclusion Criteria:
Exclusion Criteria:
Statistical Analysis:
Statistical analysis was performed using SPSS software. The Chi-Square test was applied to evaluate gender-based differences in clinical presentation, diagnosis, treatment patterns and six-month mortality risk as assessed by the GRACE risk score with a significance threshold of p<0.05. The chi- square goodness of fit test was utilized to identify the risk factor associated in male and female related to social history in males and menopausal status in females.
RESULTS
Table 1: Patient Demographics and Comorbidity Profile
|
Variables |
No. of male patients (n=175) |
Percentage (%) |
No. of female patients (n=175) |
Percentage (%) |
Chi square value |
p-value |
|
Age groups |
||||||
|
21-40 |
15 |
8.57 |
7 |
4 |
9.634 |
0.021 |
|
41-60 |
100 |
57.14 |
82 |
46.86 |
||
|
61-80 |
56 |
32.00 |
78 |
44.57 |
||
|
81-100 |
4 |
2.29 |
8 |
4.57 |
||
|
BMI Category |
||||||
|
Underweight |
2 |
1.14 |
5 |
2.86 |
12.605
|
0.005
|
|
Normal |
68 |
38.86 |
40 |
22.86 |
||
|
Overweight |
93 |
53.14 |
108 |
61.71 |
||
|
Obese |
12 |
6.86 |
22 |
12.57 |
||
|
Diabetes Mellitus |
26 |
14.86 |
27 |
15.43 |
12.787
|
0.4643 |
|
Hypertension |
19 |
10.86 |
21 |
12 |
||
|
CAD |
12 |
6.86 |
12 |
6.86 |
||
|
Thyroid |
1 |
0.57 |
2 |
1.14 |
||
|
Angina |
0 |
0 |
1 |
0.57 |
||
|
Bronchial asthma |
0 |
0 |
1 |
0.57 |
||
|
COPD |
1 |
0.57 |
1 |
0.57 |
||
|
Ca gall bladder |
0 |
0 |
1 |
0.57 |
||
|
Dyslipidemia |
0 |
0 |
1 |
0.57 |
||
|
CVA |
1 |
0.57 |
0 |
0 |
||
|
Psoriasis |
1 |
0.57 |
0 |
0 |
||
|
Ischemic heart disease |
1 |
0.57 |
0 |
0 |
||
|
More than 2 diseases |
65 |
37.14 |
143 |
44.57 |
||
|
Nil |
48 |
27.43 |
78 |
17.14 |
||
Table 2: Medical, Family and Social History of Patients
|
Variables |
No. of male patients (n=175) |
Percentage (%) |
No. of female patients (n=175) |
Percentage (%) |
Chi square value |
p-value |
|
Past medication history |
||||||
|
Disease on treatment |
82 |
46.86 |
91 |
52 |
5.440
|
0.065
|
|
Disease on irregular treatment |
45 |
25.71 |
54 |
30.86 |
||
|
Not on treatment |
48 |
27.43 |
30 |
17.14 |
||
|
Family history |
||||||
|
Father-DM |
1 |
0.57 |
1 |
0.57 |
9.026
|
0.2507
|
|
Father-HTN |
0 |
0 |
1 |
0.57 |
||
|
Father-MI |
0 |
0 |
3 |
1.71 |
||
|
Father-CAD |
0 |
0 |
1 |
0.57 |
||
|
Mother-CAD, DM |
1 |
0.57 |
0 |
0 |
||
|
Sibling-CAD |
2 |
1.14 |
0 |
0 |
||
|
Sibling-MI |
0 |
0 |
1 |
0.57 |
||
|
Nil |
171 |
97.71 |
168 |
96 |
||
|
Alcoholic but not smoker |
19 |
10.86 |
0 |
0 |
105.39
|
<0.001 |
|
Smoker but not alcoholic |
38 |
22.29 |
0 |
0 |
||
|
Smoking & Alcoholic |
23 |
13.14 |
0 |
0 |
||
|
Neither Alcoholic nor smoker |
94 |
53.71 |
175 |
100 |
||
Table 3: Menopausal Status and Clinical Presentation
|
Variables |
No. of male patients (n=175) |
Percentage (%) |
No. of female patients (n=175) |
Percentage (%) |
Chi square value |
p-value |
|
Menopaused |
- |
- |
129 |
73.71 |
147.39
|
<0.001 |
|
Premenopausal |
- |
- |
46 |
26.29 |
||
|
Nil |
- |
- |
0 |
0 |
||
|
Clinical Presentations |
||||||
|
Typical symptoms |
30 |
17.14 |
23 |
13.14 |
10.048 |
0.0065 |
|
Atypical symptoms |
16 |
9.14 |
37 |
21.14 |
||
|
Typical and Atypical symptoms |
129 |
73.71 |
115 |
65.71 |
||
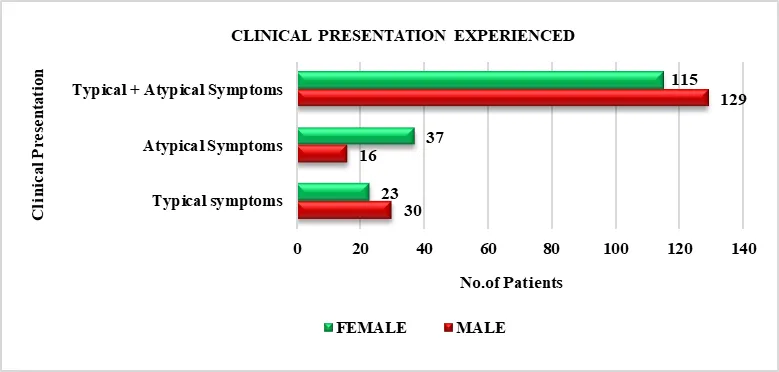
Figure 1: Clinical presentation experienced by the patients
Table 4: Distribution of Hypertension Stages
|
Variables |
No. of male patients (n=175) |
Percentage (%) |
No. of female patients (n=175) |
Percentage (%) |
Chi square value |
p-value |
|
Hypertension Stages |
||||||
|
<120mmHg (Normal) |
34 |
19.43 |
51 |
29.14 |
17.279 |
0.001 |
|
120-129 mmHg (Elevated) |
48 |
27.43 |
21 |
12 |
||
|
130-139 mmHg (Hypertension stage 1) |
43 |
24.57 |
37 |
21.14 |
||
|
≥140 mmHg (Hypertension stage 2) |
45 |
25.71 |
56 |
32 |
||
|
≥180 mmHg (Hypertensive crisis) |
5 |
2.86 |
10 |
5.71 |
||
Table 5: Lipid Parameters
|
Variables |
No. of male patients (n=175) |
Percentage (%) |
No. of female patients (n=175) |
Percentage (%) |
Chi square value |
p-value |
|
Serum total cholesterol level |
||||||
|
<200 mg/dl (Normal) |
123 |
70.29 |
97 |
55.43 |
8.9121 |
0.011 |
|
200-239 mg/dl (Borderline high) |
35 |
20 |
47 |
26.86 |
||
|
≥240 mg/dl (High) |
17 |
9.71 |
31 |
17.71 |
||
|
Serum HDL cholesterol level |
||||||
|
<40 mg/dl (men) & <50 mg/dl (women) -optimal |
114 |
65.14 |
143 |
81.71 |
23.531 |
<0.001 |
|
40-60mg/dl (men) & 50-60mg/dl (women) – borderline high |
59 |
33.71 |
23 |
13.14 |
||
|
>60mg/dl (both) – high |
2 |
1.14 |
9 |
5.14 |
||
|
<100mg/dl (optimal) |
61 |
34.86 |
55 |
31.43 |
2.5321
|
0.638 |
|
100-129mg/dl (near or above optimal) |
56 |
32 |
56 |
32 |
||
|
130-159mg/dl (borderline high) |
39 |
22.29 |
43 |
24.57 |
||
|
160-189mg/dl (high) |
14 |
8 |
11 |
6.29 |
||
|
≥190mg/dl (very high) |
5 |
2.86 |
10 |
5.71 |
||
|
Serum Triglycerides level |
||||||
|
<150 mg/dl (Normal) |
104 |
59.43 |
72 |
41.14 |
12.928 |
0.004 |
|
150-199 mg/dl (Border line high) |
22 |
12.57 |
40 |
22.86 |
||
|
200-499 mg/dl (High) |
46 |
26.29 |
58 |
33.14 |
||
|
≥500mg/dl (Very high) |
3 |
1.71 |
5 |
2.86 |
||
Table 6: Electrocardiographic Findings
|
Variables |
No. of male patients (n=175) |
Percentage (%) |
No. of female patients (n=175) |
Percentage (%) |
Chi square value |
p-value |
|
ECG patterns |
||||||
|
ST segment elevation |
54 |
30.86 |
36 |
20.57 |
10.334 |
0.035 |
|
ST segment depression |
22 |
12.57 |
35 |
20 |
||
|
Abnormal T waves/ inverted T wave |
15 |
8.57 |
8 |
4.57 |
||
|
ST segment deviation + T wave abnormality |
5 |
2.86 |
3 |
1.71 |
||
|
No ST segment deviation |
79 |
45.14 |
93 |
51.14 |
||
Table 7: Coronary Vessel Involvement and Interventional Procedures
|
Variables |
No. of male patients (n=175) |
Percentage (%) |
No. of female patients (n=175) |
Percentage (%) |
Chi square value |
p-value |
|
|
Type of vessel disease |
|||||||
|
Single vessel disease |
95 |
54.29 |
79 |
45.14 |
11.731 |
0.038 |
|
|
Double vessel disease |
35 |
20 |
42 |
24 |
|||
|
Triple vessel disease |
30 |
17.14 |
22 |
12.57 |
|||
|
Single vessel disease + Intermediate/ branch disease |
4 |
2.29 |
3 |
1.71 |
|||
|
Minimal CAD |
6 |
3.43 |
18 |
10.29 |
|||
|
Normal coronaries |
5 |
2.86 |
11 |
6.29 |
|||
|
Type of vessel involved |
|||||||
|
LAD |
66 |
37.71 |
58 |
33.14 |
14.297 |
0.046 |
|
|
LCX |
9 |
5.14 |
6 |
3.43 |
|||
|
RCA |
19 |
10.86 |
12 |
6.86 |
|||
|
LMCA |
0 |
0 |
1 |
0.57 |
|||
|
Ramus |
1 |
0.57 |
0 |
0 |
|||
|
More than 2 vessels |
39 |
22.29 |
46 |
26.29 |
|||
|
More than 3 vessels |
30 |
17.14 |
23 |
13.14 |
|||
|
Nil |
11 |
6.29 |
29 |
16.57 |
|||
|
PTCA |
121 |
69.14 |
89 |
50.86 |
14.857 |
0.005 |
|
|
CABG |
26 |
14.86 |
36 |
20.57 |
|||
|
Medical management |
27 |
15.43 |
49 |
28 |
|||
|
AVR+ CABG |
0 |
0 |
1 |
0.57 |
|||
|
PTCA + CABG |
1 |
0.57 |
0 |
0 |
|||
Table 8: Treatment Modalities Classification
|
Variables |
No. of male patients (n=175) |
Percentage (%) |
No. of female patients (n=175) |
Percentage (%) |
Chi square value |
p-value |
|
|
Treatment Pattern |
|||||||
|
Antiplatelets
|
168 |
96 |
161 |
92 |
15.926 |
0.0684 |
|
|
Anticoagulants
|
87 |
49.71 |
84 |
48 |
|||
|
Statins |
151 |
86.28 |
158 |
90.28 |
|||
|
Beta blockers |
114 |
65.14 |
108 |
61.71 |
|||
|
ACE inhibitors |
62 |
35.42 |
61 |
34.85 |
|||
|
ARBs |
16 |
9.14 |
30 |
17.14 |
|||
|
Nitrates |
15 |
8.57 |
10 |
5.71 |
|||
|
Calcium Channel blockers |
16 |
9.14 |
34 |
19.42 |
|||
|
Antianginal drugs
|
34 |
19.42 |
20 |
11.42 |
|||
|
Diuretics |
77 |
44 |
75 |
42.85 |
|||
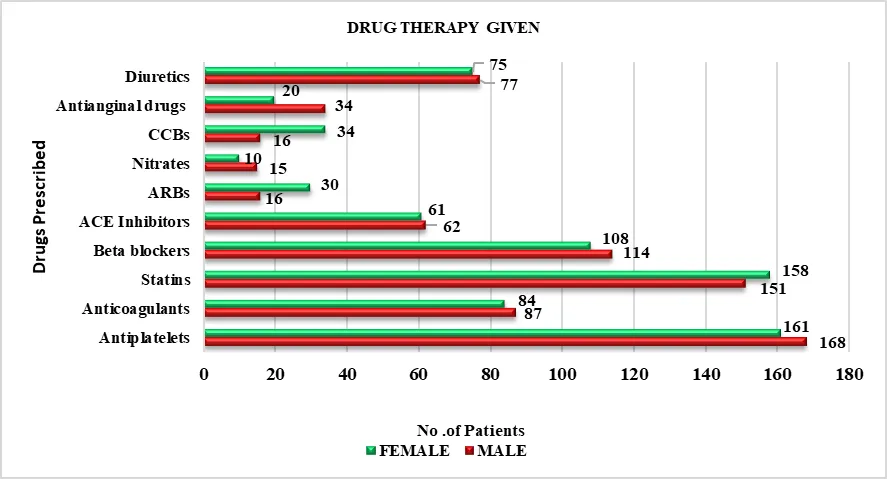
Figure 2: Comparison of treatment pattern between male and female coronary artery disease patients
Table 9: Prognostic Risk Assessment using GRACE Score
|
Variables |
No. of male patients (n=175) |
Percentage (%) |
No. of female patients (n=175) |
Percentage (%) |
Chi square value |
p-value |
||
|
GRACE score |
||||||||
|
≤ 88 (Low risk) |
103 |
58.86 |
77 |
44 |
10.322 |
0.005
|
||
|
89-118 (Intermediate risk) |
56 |
32 |
65 |
37.14 |
||||
|
≥ 119 (High risk) |
16 |
9.14 |
33 |
18.86 |
||||
|
Probability of death |
||||||||
|
< 3% (Low) |
103 |
58.86 |
77 |
44 |
13.876 |
0.003 |
||
|
3-8% (Intermediate) |
63 |
36 |
71 |
40.57 |
||||
|
9-20% (High) |
6 |
3.43 |
22 |
12.57 |
||||
|
>20-40% (Very high) |
3 |
1.71 |
5 |
2.86 |
||||
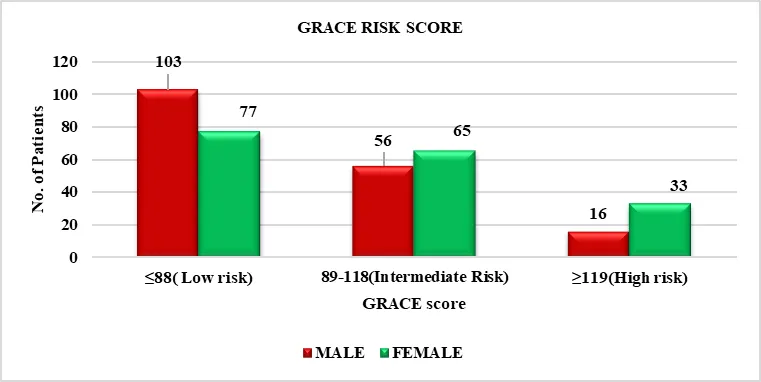
Figure 3: Gender-wise distribution of patients according to GRACE score categories
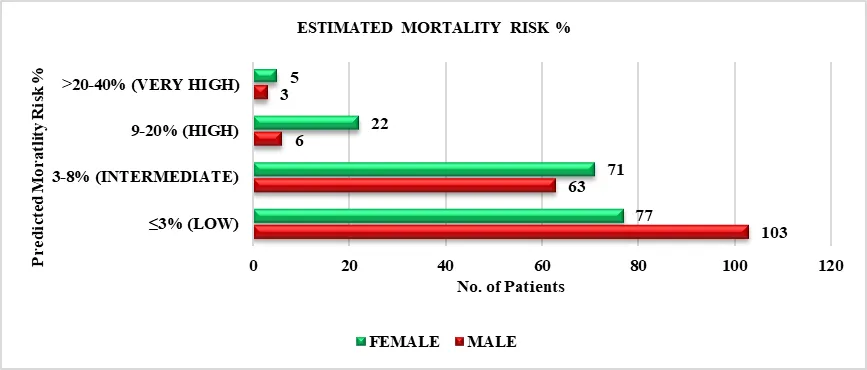
Figure 4: Gender-wise distribution of estimated probability of death from admission to 6 months based on GRACE risk stratification
DISCUSSSION
Coronary artery disease (CAD) is one of the leading causes of morbidity & mortality worldwide. In recent years, researchers have increasingly focused on how CAD differs between males and females in terms of risk factors, clinical presentation, diagnosis, treatment, and outcomes. These differences may be due to several factors, including hormonal influences, variations in cardiovascular risk profiles, and lifestyle or behavioral factors. Tools such as the GRACE (Global Registry of Acute Coronary Events) risk score are commonly used to estimate mortality risk and assist clinicians in making appropriate treatment decisions for patients with acute coronary syndromes.
CAD occurs earlier in men (41–60 years) and later in women (61–80 years), showing a significant age difference (p = 0.021). This delayed onset in women may be due to estrogen’s cardioprotective effects, consistent with findings by Sayed et al., (2022). BMI distribution differed significantly between sexes (p = 0.005), with females showing higher rates of overweight and obesity compared to males. Similar findings by Won-Jang Kim et al., (2024) reported higher BMI and associated hypertension in women, increasing cardiovascular risk. Co-morbid conditions showed no significant difference between sexes (p = 0.464), with diabetes and hypertension being most common in both groups. Similar findings by Dronker et al., (2022) also reported no significant sex-based differences despite slight variations in risk patterns
Past medication history showed no significant difference between sexes (p = 0.065), although females demonstrated slightly better treatment adherence. This contrasts with findings by Hend Mansoor et al., (2024), which reported higher nonadherence among women, increasing cardiovascular risk. Familial risk factors showed no significant difference between sexes (p = 0.2507), with most patients lacking a documented family history of CAD. This contrasts with Bagheri et al., (2025), which reported a strong association between family history and CAD severity (p < 0.001). Social risk factors showed a highly significant difference between sexes (p < 0.001), with smoking and alcohol use reported only among men. Similar findings by Taqiuddin et al., (2024) identified smoking as a strong risk factor for CAD (OR = 2.80).
Menopausal status showed a highly significant association with CAD (p < 0.001), with most female patients being postmenopausal. Similar findings by Ayesha Siddika et al., (2023) reported greater CAD severity in postmenopausal women. Clinical presentation differed significantly between sexes (p = 0.0065), with females more likely to present with atypical symptoms. Similar findings by Simran P. Sharma et al., (2022) reported more classical chest pain in men and atypical symptoms in women
Hypertension stages showed a significant gender difference (p = 0.001), with elevated BP more common in men, while severe stages were higher in females. Similar findings by Min-Sik Kim et al., (2022) reported increased BP in postmenopausal women, emphasizing the need for control.
Significant gender differences were observed in lipid profiles, with females showing higher total cholesterol (p = 0.011), lower HDL (p < 0.001), and higher triglycerides (p = 0.004), while LDL levels showed no significant difference (p = 0.638). Similar findings by Rashid Mir et al., (2022) support these variations in lipid patterns between genders
ECG abnormalities showed a significant gender difference (p = 0.035), with ST-segment elevation more common in males and ST-segment depression more frequent in females. Similar findings by Al-khlaiwi et al., (2025) also reported sex-based differences in ST-segment patterns
Angiographic patterns showed a significant gender difference (p = 0.038), with males having more single and triple vessel disease, while females more often had minimal or normal coronary findings. Similar results by Kim et al., (2022) reported higher obstructive CAD in males. Coronary vessel involvement showed a significant gender difference (p = 0.046), with LAD most commonly affected in both sexes; males had higher RCA and LCX involvement, while females showed more multivessel disease. These findings partly contrast with Al-khlaiwi et al., (2025), which reported no significant gender difference in LAD involvement. Revascularization strategies showed a significant gender difference (p = 0.005), with males more likely to undergo PTCA and females more often receiving CABG or conservative management. Similar findings by Wester et al., (2024) reported higher CABG rates in women and more graft use in men
Pharmacological treatment patterns showed no significant gender difference (p = 0.0684), with antiplatelets and statins commonly used in both sexes. This contrasts with Alhassan et al., (2025), which reported lower use of guideline-recommended therapies in women.
GRACE score distribution and estimated 6-month mortality risk showed significant gender differences (p = 0.005, p = 0.003), with females more often in intermediate and high-risk categories. Similar findings by Wenzl et al., (2022) reported higher mortality risk in women
CONCLUSION
This study demonstrates that significant gender differences exist in coronary artery disease (CAD). Males are more likely to develop CAD at a younger age with higher exposure to lifestyle risk factors, whereas females tend to present later in life with more metabolic risk factors and atypical symptoms. These differences may lead to delays in diagnosis in female patients. Additionally, females showed higher GRACE risk scores, indicating a greater risk of mortality and poorer prognosis compared to males. Overall, gender plays an important role in the clinical presentation, risk assessment, and outcomes of CAD. Therefore, early detection, gender-specific risk assessment, and appropriate management strategies are essential to improve outcomes, especially in female patients.
CONFLIT OF INTEREST: None
ACKNOWLEDGMENT:
I would like to express my sincere gratitude to Dr.N.Rajasekar,MD (Cardiologist) from the Cardiology department for his invaluable support and gratitude throughout this project. His expertise and encouragement have been instrumental in shaping our research.
ABBREVATIONS:CAD: Coronary Artery Disease; GRACE: Global Registry of Acute Coronary Events Risk Score; ECG: Electro Cardiogram; CAD: Cardiovascular Disease; CV: Cardiovascular; FAST-MI: French registry of Acute ST-elevation and non -ST-elevation Myocardial Infraction; BMI: Body Mass Index; COPD: Chronic Obstructive Pulmonary Disease; CVA: Cerebro Vascular Attack; DM: Diabetes Mellitus; MI: Myocardial Infraction; HTN: Hypertension; HDL: High Density Lipoprotein; LDL: Low Density Lipoprotein; LAD: Left Anterior Descending Artery; LCX: Left Circumflex Artery; LMCA: Left Main Coronary Artery; PTCA: Percutaneous Transluminal Coronary Angioplasty; CABG: Coronary Artery Bypass Graft; AVR: Aortic Valve Replacement
REFERENCES
A review of the literature. Eur Heart J Acute Cardiovasc Care 2021;10:413-22.
A review of the literature. Eur Heart J Acute Cardiovasc Care 2021;10:413-22.






Sharon Lawrence, Sonaa Dee Cyril Antony Cruze, Srisaran Arumugam, Suhel Ahamed Abdul Hameed, Subramaniyan Kannan, Sangameswaran Balakrishnan, Gender Based Comparison of Clinical Presentation, Evaluation, Treatment of Coronary Artery Disease and Risk Stratification using Global Registry of Acute Coronary Events Risk Score, Int. J. of Pharm. Sci., 2026, Vol 4, Issue 8, 211-222, https://doi.org/10.5281/zenodo.21768348
 10.5281/zenodo.21768348