

We use cookies to ensure our website works properly and to personalise your experience. Cookies policy
Department of pharmacy, krishna teja pharmacy college, tirupati, andhra pradesh, india.
Green analytical chemistry has gaining & increasing importance in pharmaceutical analysis because conventional analytical procedure may require large amount of organic solvents generate considerable chemical waste and consume significant resources and the development of sustainable analytical method is important for reducing environmental impact while maintaining accuracy, reliability and efficiency required for pharmaceutical analysis[1]. this review discusses the applications of the green analytical chemistry principles to commonly used pharmaceutical techniques with particular emphasis on HPLC,UPLC & spectroscopic methods sustainable strategies such as use of safer solvents reduction of solvents consumption miniaturization,[1] shorter analysis time reduce the sample preparation and waste minimization are discussed for the chromatographic methods the advantage of UPLC in terms of rapid analysis improved efficiency and lower solvent consumption are also highlighted spectroscopic techniques such as a UV- VISIBLE , FTIR, RAMAN and near IR spectroscopy are considerable as greener alternatives because of their potential for rapid analysis with the minimal sample preparation and reduced chemical consumption in addition green assessment tools such as an ANALYTICAL ECO SCALE, GAPI, AGREE are discussed for evaluating the environmental performance of analytical procedures the review also highlights the major challenges and future opportunities associated with implementing of green principles with the modern chromatographic and spectroscopic techniques can support the development of safer efficient economical and environmentally sustainable pharmaceutical analysis method[2]
Pharmaceutical analysis plays an important role in ensuring the quality, safety, purity and efficacy of pharmaceutical products and analytical techniques are widely used during the drug development manufacturing and quality control to identify and quantify API, impurities, excipients and degradation products among the different analytical techniques are available high Performance liquid Chromatography (HPLC), ultra performance liquid chromatography (UPLC) and spectroscopic methods such as an UV visible, infrared, and fluorescence spectroscopy are commonly used because of their good sensitivity, accuracy, selectivity and reliability all through these techniques are highly useful conventional analytical procedures can have an environmental impact large amounts of organic solvents and chemical reagents may be required, particularly in chromatographic analysis sample preparation can also involve several steps and the generate considerable amount of chemical waste in addition the use of hazardous solvent high energy consumption and disposal of laboratory waste can create environmental and safety concerns therefore there is an increasing need to develop analytical methods that provide reliable results while causing less harm to environment
Green analytical chemistry has developed in response to the need it focus on the reducing the environmental impact of analytical procedures while maintaining the acceptable analytical performance important consideration including reducing the solvent reagent consumption minimizing waste generation selecting safer chemicals reducing energy use and simplifying the analytical procedures in pharmaceutical analysis these principles can help laboratories develop methods that are not only reliable but also safe for economical and more environmental friendly HPLC is one of the most widely used techniques in pharmaceutical analysis. but conventional HPLC methods and may require significant volumes of organic solvents such as methanol and acetonitrile this can result in increased solvent waste and higher environmental and occupational risk.therefore different approaches have been investigated to make chromatographic analysis greener this includes reducing the flow rate and analysis time decreasing the volume of mobile phase, selecting less hazardous solvents optimizing chromatographic conditions and simplifying sample preparation.[2]
UPLC provide another useful approach for improving the sustainability of pharmaceutical analysis because UPLC uses smaller particle size columns and operates at high pressure it can provide faster separation and high efficiency with relatively lower solvent consumption
reduce the analysis time and solvent use can help decreases waste and improve the laboratory efficiency however the use of an UPLC alone does not necessarily make an analytical method green the complete analytical procedure including solvent selection, sample preparation, energy consumption and waste generation should also be considered.
spectroscopic techniques also have a considerable potential in green pharmaceutical analysis methods such as an UV visible, infrared and fluorescence spectroscopy can provide rapid analysis and may require smaller quantities of reagents and solvents then some conventional chromatographic procedures that use of direct analysis aqueous media reduced sample preparation and the smaller sample quantities can further improve their environmental performance however the overall greenness of A spectroscopic methods depends on the complete procedure rather than the analytical instrument alone
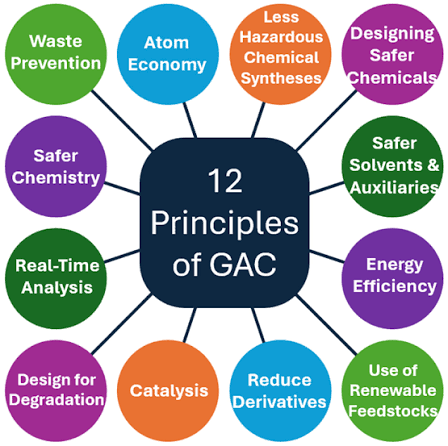
Figure 1: Principles of Green Analytical Chemistry
MATERIALS AND METHODS
2.1 literature search strategy
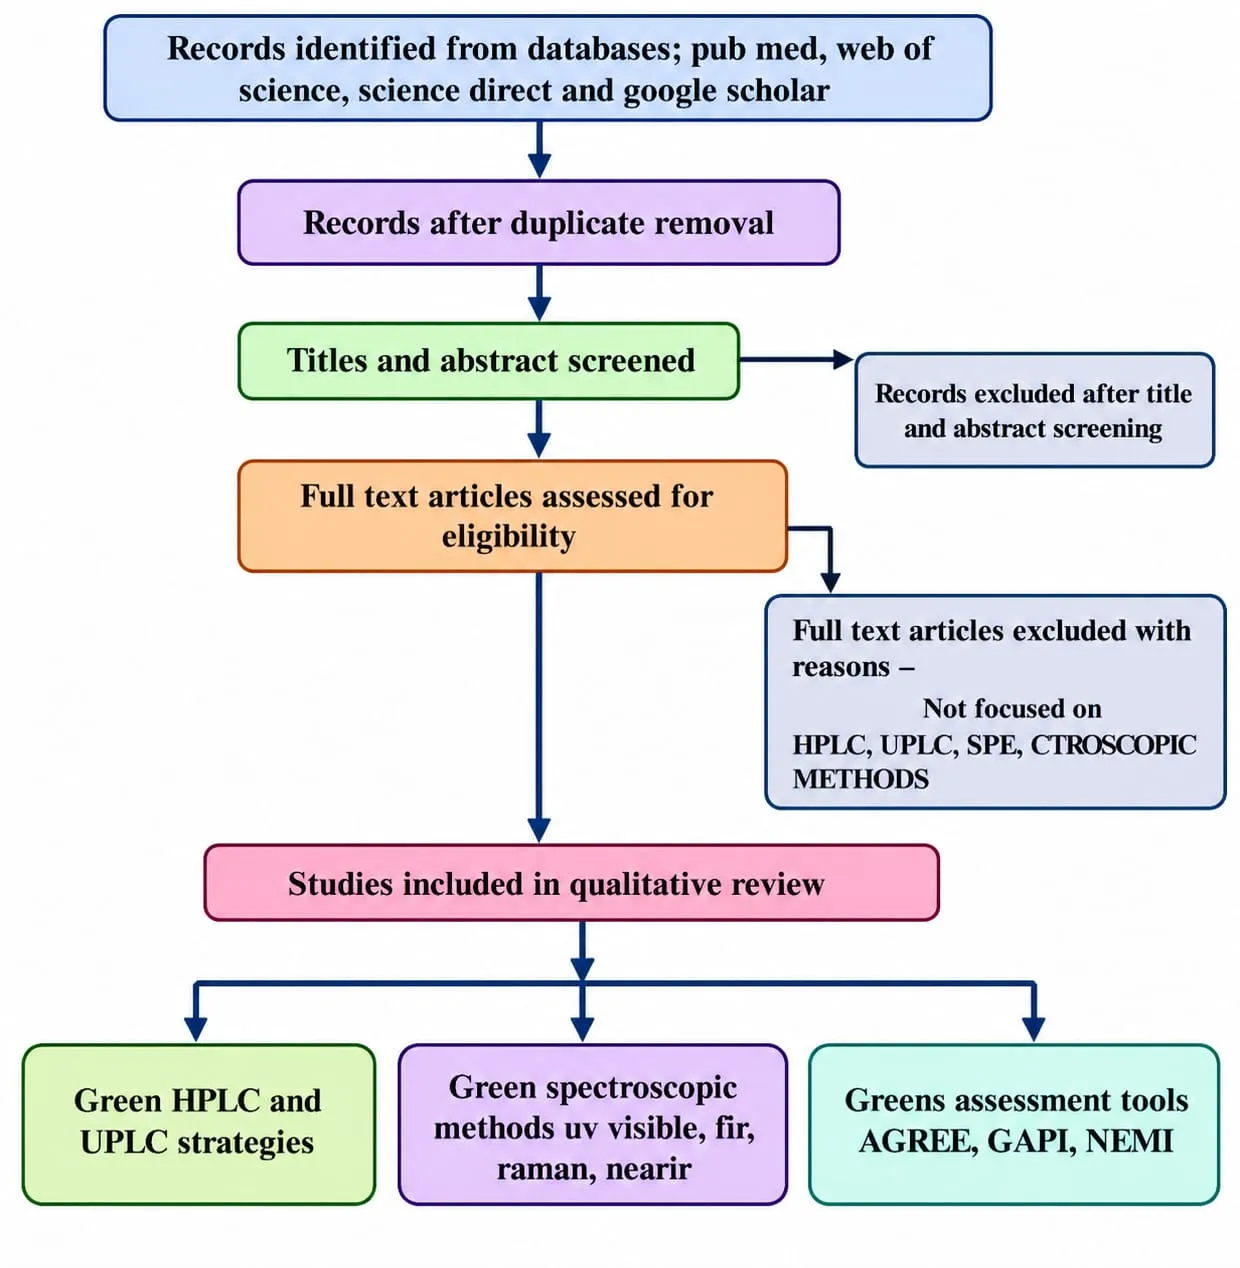
A systemic literature Search was carried out to identify studies on green analytical chemistry in pharmaceutical analysis with particular focus on sustainable HPLC, UPLC and spectroscopic methods. Pub Med, science Direct, Scopus, Web of Sciences and Google Scholar was searched for relevant publication the search focused on the green method development, safer solvents reduced solvent, and energy use, lower analytical waste miniaturization and sustainable chromatographic and spectroscopic techniques[4]
2.2 Selection of literature
Relevant articles were selected according to objectives of the review studies describing the development, optimization, validation or evaluation of pharmaceutical analysis methods with improved environmental performance were considered particular attention was given to HPLC, UPLC, UV VISIBLE and other spectroscopic methods the studies were considered relevant when they reported strategies such as reducing the organic solvent use, replacing the hazardous solvents, lowering the mobile phase volume, shortening analysis time, simplifying sample preparation, reducing waste or energy use using aqueous or preferable media are applying green analytical chemistry assessment tools[4]
2.3 Analytical techniques considered
The review mainly considered HPLC, UPLC and spectroscopic methods HPLC and UPLC attention was give to mobile phase composition, solvent type, flow rate, analysis time, column characteristics, detection, condition, sample preparation and solvent consumption for spectroscopic methods, solvent and reagent requirements were considered. Direct analysis aqueous media and simplified sample preparation were also examined as potential sustainability strategies[4]
2.4 Materials and Reagent considered
The reviewed studies commonly used pharmaceutical reference standards, marketed formulations, organic solvents, water, buffers and analytical reagents solvents such as methanol, acetonitrile, ethanol, water were considered according to their amount environmental characteristics and role in analytical procedures and greater emphasis was placed on safer alternatives aqueous systems and reduced solvent volumes rather than the simplify listing individual chemicals[4]
2.5 Information extracted from the literature
For each relevant method information was collected on the analytical techniques, analytical or pharmaceutical formulations, Sample preparation, solvents and reagents chromatography are spectroscopic conditions, analytical performance and sustainability characteristics parameters such as linearity, accuracy, precision, sensitivity, selectivity, robustness. solvent consumption, waste generation, energy requirements, analysis time and sample requirements were considered where reported clean assessment tools used in studies were also recorded[4]
2.6 Green Analytical Chemistry Assessment
The environmental performance of reported methods was considered using green analytical chemistry principles and were available, established tools such as an NEMI, ANALYTICAL ECO SCALE, GAPI, COMPLEX GAPI AND AGREE. These approaches provide a structured way to consider chemical hazardous, solvent and reagent use, waste energy, sample preparation and other environmental factors[4]
2.7 Comparison of Analytical methods
The selected methods were compared in terms of both analytical performance and sustainability, solvent consumption, hazardous chemicals use, waste generation and analysis time, energy requirement, sample preparation, cost and analytical reliability were considered the comparison focused on methods that provided a practical balance between the reliable pharmaceutical analysis and reduced environmental impact[4]
3. Literature Search, screening and study selection process
4. Green Solvents as mobile phase in HPLC
HPLC is an important analytical technique which is in a used in the pharmaceutical laboratories to identify and separate and quantify the drug substance, impurities and degradation products however the conventional HPLC requires or it consumes a large number of organic solvents particularly acetonitrile and methanol[2], their use can increase hazardous waste generation and create environmental and Occupational Safety concerns. One way to address these challenges is to select alternative mobile phase solvents that reduces the environmental impact without compromising analytical performance, ethanol, water, propylene carbonate and glycerol are potential candidates for consideration in green HPLC their suitable depends on solubility of the analytes, the nature of the stationary phase, the required separation and the operating conditions. The green organic solvents that are easily available and affordable and that produces the low waste generation to compare with the organic solvents such as like ethanol, water, propylene carbonate, glycerol and the major point was the chemical waste generated per year by HPLC instruments worldwide is approximately 34 million liters[5]
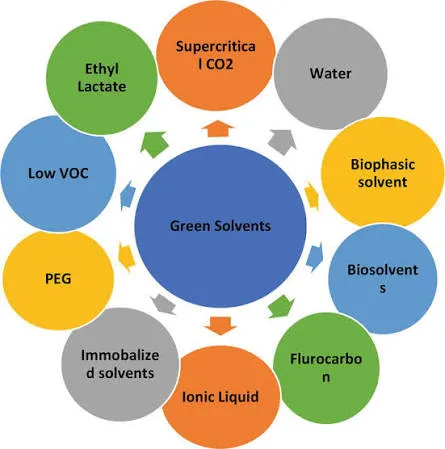
Figure 2: Green Solvents Used in Green Analytical Chemistry
4.1 Ethanol
Ethanol is a potential alternative to acetonitrile and methanol in the development of environmentally considerate HPLC methods. It can be combined with water in different proportions to adjust the elution strength of the mobile phase and achieve the required separation of pharmaceutical analysis because they can provide useful chromatographic performances while reducing the dependence on conventional organic solvents. Ethanol is an A biodegradable and has a relatively it is favourable environmental profile in several respects and appropriate optimization of the mobile phase consumption and flow rate can help reduce solvent consumption while maintaining acceptable separation efficacy[5]
4.2 water
Water is the one of the most accessible solvents for developing environmentally responsible analytical procedures it uses as a major component of the HPLC mobile phase can reduce the quantity of organic solvents it required during pharmaceutical analysis. Depending on the chemical properties of the drug substance water may be used alone under suitable chromatographic conditions are combined with a compatible organic modifier. However highly aqueous mobile phases are not suitable for every pharmaceutical compound or conventional stationary phase the poor analyte solubility and inadequate retention may also affect the separation, selecting a suitable and optimizing the mobile phase composition are therefore important when developing water rich HPLC methods[5]
4.3 propylene carbonate
Propylene carbonate is a cyclic carbonate solvent that has received attention as a possible alternative to conventional organic modifiers may be useful when developing methods intended to reduce the consumption of acetonitrile or other conventional solvents depending on the analytical requirements it can be investigated as a component of a mixed mobile phase rather than assumed to be a universal replacement. its relatively high viscosity may influence system pressure and chromatographic performance while it is visibility with other mobile phases components must also be considered and consequently its suitability should be established through the experimental evaluation of separation efficacy, solvent consumption, safety and environmental impact[5]
4.4 glycerol
Glycerol is another solvent of interest in development of greener analytical methods, its physiochemical properties make it worth investigating for selected chromatographic applications, all through It’s used in HPLC presents certain practical challenges. In particular its relatively high viscosity may increase column back pressure and influence the movement of analytes through the chromatographic systems these limitations can affect separation efficiency and analysis time if the method is not properly optimized therefore, these are all should be considered a potential alternative for appropriate applications rather than a direct substitute for acetonitrile or methanol in every HPLC procedure. Its overall environmental suitability must be evaluated alongside analytical performance and operational requirements[5]
5 green solvents used in UPLC
UPLC is widely used for the pharmaceutical analysis because it can provide efficient separations and short analysis time. However the solvents used in the mobile phase remain important factors in determining the environmental impact of A UPLC procedure. Conventional methods frequently use acetonitrile or methanol making the investigation of alternate solvents an important part of sustainable methods development. Ethanol water mixtures are potential alternatives because they may provide suitable separation while reducing reliance on conventional organic modifiers. Water rich mobile phases can also reduce the organic solvent consumption when the analytes and stationary phase are compatible with the selected conditions other solvents, including propylene carbonate may be considered for particular applications after evaluating their physiochemical properties however the small particles columns and high operating pressures used in the UPLC make solvent viscosity an important consideration alternative mobile phases must therefore be optimized to achieve acceptable resolution, analysis type, system pressure and reproducibility, the object for the solvent is not necessary the one with the lowest toxicity along its overall environmental impact and suitability for the analytical procedure must also be considered[6]
6. Green solvents used in the spectroscopic methods
Spectroscopic methods are widely applied in pharmaceutical analysis because they are provided relatively simple and rapid measurements of drug substance in bulk materials and pharmaceutical formulations and Nevertheless sample preparation may involve organic solvents that contribute to chemical based and environmental concerns. Selecting more sustainable solvents can help reduce these disadvantages while maintaining the quality of the analytical results. Water is useful option for spectroscopic analysis when the drug substance has an adequate aqueous solubility and remains stable during the sample preparation ethanol may be suitable when a different solvent is needed to dissolve the analyte aqueous ethanol fixtures can also be investigated when they provide the required solubility without interfering with the measurement. For ultraviolet visible spectroscopy, the solvent must have suitable optical properties at the selected wavelength because solvent absorption may interfere with the measurement. The compatibility of the solvent due to the drug substance and formulation matrix must also be established depending on the analytical technique, direct measurement or sample preparation procedure requiring little or no organic solvents may offer further environmental benefits The choice of solvent should therefore be guided by its environmental characteristics. It’s a suitability for measurement techniques and its ability to produce reliable and reproducible analytical results[7]
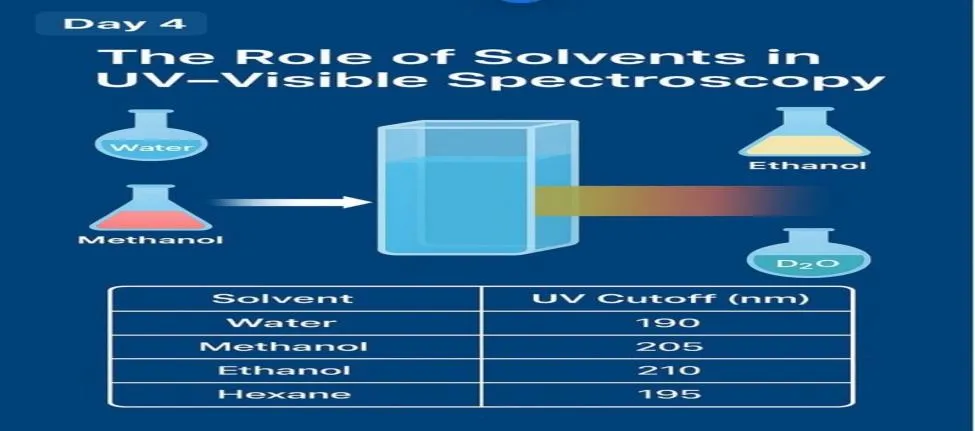
Figure 3: UV Spectroscopy in Spectroscopic Methods
7. various green analytical tools
7.1 National Environmental Method Index (NEMI)
The National Environmental Methods Index screening approach used to communicate selected environmental concerns associated with analytical methods. It was developed to make environmental information easier to interpret when choosing or comparing procedures rather than producing one overall numerical score, NEMI presents its finding through a simple four part pictogram the four sections traditionally address whether a method involves persistent, bio accumulate, and a toxic substances, hazardous chemicals, corrosion reagents, and waste generation. Each section is assessed against specified criteria, and the relevant part
of the pictogram is marketed when the criterion is met. These visual format allows readers to recognize potential concerns without the needing to interpret a complicated calculation[7] In pharmaceutical analysis. NEMI can be used as an initial check when comparing procedures for testing active pharmaceutical ingredients, excipient s are relevant substance, for example a researcher may review the solvents and reagents used in HPLC method and identify whether the procedure includes chemicals that raise particularly environmental or safety concerns the result can prompt a closer examination of a solvent choice, handling, and waste disposal NEMI is an useful because it is in a straightforward, relatively quick to apply and easy to display in a review article, it can help communicate selected environmental characteristics to readers who are not specialist in environmental assessment. It may also support early decisions During method development, before a more detailed evaluation is undertaken[8]
However, NEMI has a limited scope. Its pictogram does not fully describe solvent volume, energy consumption, instrument requirements, are every stage of sample preparation. Two methods may receive similar pictograms even through their total resource use differs substantially. Its criteria and thresholds also need to be applied consistently and reported transparently. for HPLC and UPLC, NEMI can help flag selected chemicals hazardous but it should not be used alone to conclude that one procedure is greener overall. For UV visible, FTIR, RAMAN methods, it can similarly provide a preliminary view of the chemicals used during sample preparation. The assessment should include pretreatment and waste streams where these are part of the actual method in a pharmaceutical review, NEMI Is best described as a preliminary screening tool rather than a complete sustainability metric. Its result should be interpreted alongside analytical performance. The amount of solvent and reagent used, and the practical purpose of the method. Researcher should cite the original NEMI source and explain any criteria or assumption used in their assessment[9]
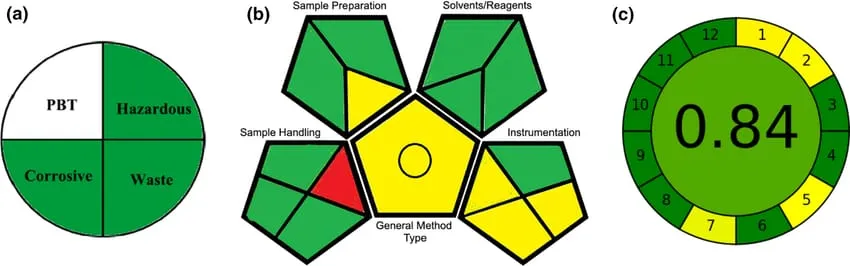
Figure 4: [Nemi] National Environment Method Index
7.2 Analytical echo scale (AEC)
The analytical echo scale, often abbreviated AES, is in a semi quantitative tool that estimates the greenness of an analytical procedure by assigning penalty points to selected environmental and safety concerns. The method starts from ideal reference value of 100 points. Penalties are then subtracted to reflect the burdens associated with the actual procedure The assessment commonly considers the types and quantities of chemicals used, their hazard classification, energy consumption, and waste related factors. The exact calculation depends on the published ECO SCALE framework and the information available for the method. The gender relationship is analytical echo scale score is equal to 100 – Total penalty points A higher score indicates that fewer penalty points were assigned under the chosen framework this makes the echo scale convenient for comparing related analytical procedures, Particularly when the Same criteria are applied to each method. It can also help identify which part of a processor contributes most strongly to the overall penalty in pharmaceutical analysis the ECHO SCALE may be applied to methods used for assay testing dissolution samples impurity analysis, or stability studies[10]. A conventional HPLC procedures that consumes large quantities of organic mobile phase may receive more solvent related penalties than an optimized procedure using less mobile phase, assuming the remaining assessment criteria are comparable The tool can also be used to examine sample preparation. A procedure involving multiple extraction steps, large reagent values, or hazardous derivatization Chemicals may accumulate more penalty points than a method requiring fewer chemicals. This can guide researchers toward practical changes such as smaller sample volumes, reduced extraction steps, or safer suitable reagents and important advantage of the echo scale is that it provides a numerical summary while retaining information about the reason for penalties. Unlike a purely Qualitative state that a method is green, a documented score gives readers a more structured basis for comparison. It is also relatively easy to report in tables alongside analytical performance data[8]
Nevertheless, the ECHO SCALE is not a direct measurement of the total environmental footprint The score depends on the penalty values and categories specified by the framework, And it may not capture every life cycle impact of chemicals or instrument. Results can be misleading if the quantities hazard information, or energy assumptions are incomplete or applied inconsistently for a fair HPLC, UPLC comparison, the analysts should use the actual flow rate, runtime, equilibration needs, and number of samples to estimate solvent consumption, A shorter run does not automatically grow lower overall impact if the method requires extension preparation are repeated injections. For spectroscopic procedures, solvent and reagent used during sample preparation must also be included in a review article, the ECHO SCALE should be presented as structured, penalty based assessment rather than a universal ranking system. Scores are most useful when the methods are so compatible analytical purposes and are assessed using the same version of the framework the original method paper and calculation details should be cited[11]
7.3 Green Analytical Procedure Index (GAPI)
The Green Analytical Processor Index is A visual tool developed to assess environmental aspects of an analytical procedure across the different stages it was designed to move beyond a narrow aspects of analytical procedure across its different stages. It was designed to move beyond a narrow focus on the final measurement and to encourage consideration of the workflow from the sample collection through the sample preparation and instrumental analysis to waste generation GAPI presents the assessment as a pictogram divided several sections. The sections represents the different features of the analytical processor, such as the nature of the sample, sample handling and preparation the chemicals used, the analytical techniques, and the waste produced. [7]
Color coding communicates the relative environmental concern associated with assessed future in the commonly used format, green indicates a more favourable situation, yellow represents an intermediate concern, and red identifies a less favourable feature. The pictogram therefore allows readers to see where a method performs well and where improvements may be needed.
The exact interpretation should follow the original GAPI methodology and its defined criteria. GAPI is particularly relevant to pharmaceutical analysis because sample preparation can make a substantial contribution to the environmental burden. A chromatographic method may use an efficient separation but still require liquid–liquid extraction, repeated filtration and large volumes of solvent before injection. Assessing only the chromatographic run would miss these additional demands.[8]
For HPLC and UPLC, GAPI can help compare the complete procedures, including sample pretreatment, mobile-phase use, instrumentation, and waste handling. An optimized, UPLC method may reduce solvent use or analysis time, but the pictogram should reflect the actual conditions and any additional preparation steps rather than assuming that UPLC is inherently greener.
The same whole-workflow approach can be applied to spectroscopic methods. Direct FTIR or Raman analysis may require little sample preparation in selected applications, whereas quantitative analysis of a complex formulation may require extraction or other pretreatment. UV–Visible methods may also require dilution, filtration, or separation to manage matrix interference. A major strength of GAPI is its ability to communicate several environmental characteristics in a single visual representation. It can be especially helpful in review articles, where readers need to compare the environmental profiles of multiple analytical procedures. The pictogram can also reveal that different methods have different strengths rather than identifying one method as best in every respect. However, GAPI is primarily a structured visual assessment and does not provide a single universal numerical measure of environmental impact.
The colours should not be treated as proof that a method is fully sustainable, nor should pictograms be compared without checking that the same criteria and assumptions were applied. For robust reporting, authors should describe the analytical workflow clearly and include the relevant details about sample preparation, chemical consumption, instrumentation, and waste. GAPI should be paired with analytical performance information and, where useful, a complementary metric such as AGREE or the Analytical Eco-Scale. The original GAPI publication should be cited. However, GAPI is primarily a structured visual assessment and does not provide a single universal numerical measure of environmental impact. The colours should not be treated as proof that a method is fully sustainable, nor should pictograms be compared without checking that the same criteria and assumptions were applied.
For robust reporting, authors should describe the analytical workflow clearly and include the relevant details about sample preparation, chemical consumption, instrumentation, and waste. GAPI should be paired with analytical performance information and, where useful, a complementary metric such as AGREE or the ANALYTICAL ECO SCALE. The original GAPI publications cited (11)
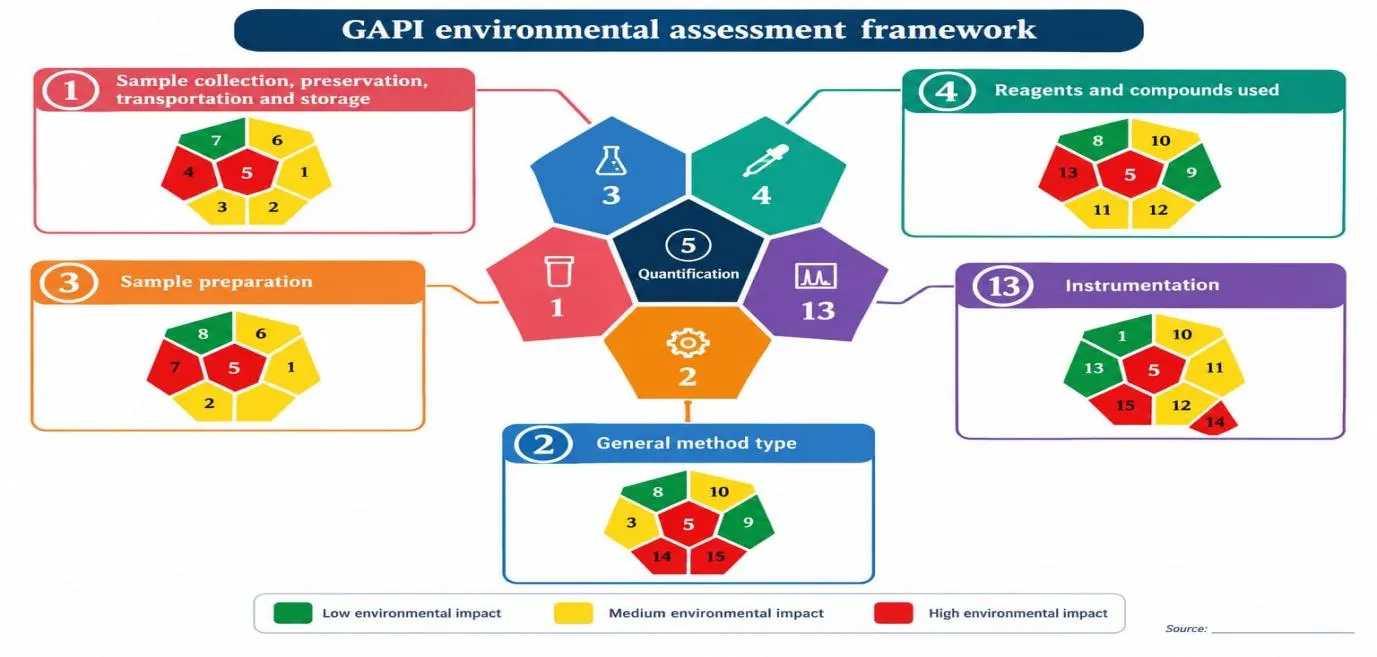
Figure 5: Green Analytical Procedure Index
7.4 ANALYTICAL GREENNESS METRIC (AGREE)
The Analytical Greenness metric, known as AGREE, is an assessment tool based on the 12 principles of green analytical chemistry. It was developed to translate these principles into a structured evaluation that can be applied to analytical procedures. AGREE presents the outcome as a circular pictogram accompanied by an overall score.
The 12 principles address different aspects of analytical sustainability, including reducing sample size, minimising waste, selecting safer chemicals, lowering energy requirements, simplifying procedures, and supporting automation where appropriate. Each principle contributes to the assessment according to the method's characteristics and the criteria defined by the AGREE framework.
The overall score ranges from 0 to 1. A higher score indicates closer alignment with the principles as evaluated by the tool. The circular pictogram also displays the individual principle-related results, which In pharmaceutical analysis, AGREE can be used to evaluate methods for active pharmaceutical ingredients, dosage forms, impurities, and degradation products.
For example, a researcher may compare two HPLC procedures by considering solvent consumption, sample size, waste, energy use, and the number of analytical steps. The result can support a more balanced discussion than solvent volume alone. AGREE is also applicable to UPLC, UV–Vis, FTIR, and Raman methods.
A spectroscopic method that permits direct measurement may score favorably for selected principles related to sample preparation and reagent use. However, the final assessment depends on the complete method, including any extraction, derivatization, calibration, or other steps needed to obtain reliable results. One strength of AGREE is that it uses a broad set of principles rather than focusing on a single environmental factor.
Its pictogram makes the result relatively easy to interpret and present in scientific publications. The individual sections can also help researchers explain why a method receives its particular score and where targeted improvements may be possible. AGREE should not, however, be interpreted as a direct measurement of every environmental impact.
The score is based on the information entered and the framework's assessment rules. Incomplete reporting or assumptions that differ between studies can affect the comparison. A high score also does not establish that a method is accurate, precise, selective, robust, or suitable for regulatory use. When comparing HPLC and UPLC, the researcher should use real operating data such as flow rate, run time, equilibration, sample preparation, and energy requirements where these are included in the assessment. Similarly, spectroscopy should not be assumed to be greener solely because it may use less solvent;
its complete workflow and analytical capability must be considered. In a review article, AGREE can be particularly useful for organizing comparisons across different analytical techniques. Authors should report the score, explain the principal factors influencing it, and cite the original AGREE publication. The metric should complement, rather than replace, validation and method performance data
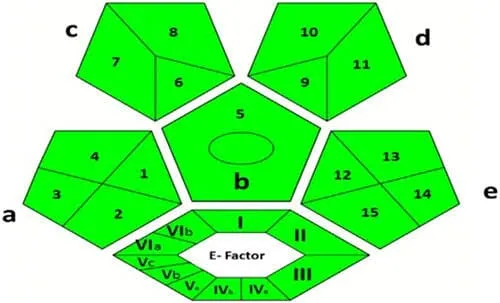
Figure 6: Analytical Greeness Metric
7.5 Blue Applicability Grade Index (BAGI)
The Blue Applicability Grade Index (BAGI) was developed to evaluate the practical applicability of analytical methods. It complements green assessment approaches by addressing a related but different question: how suitable is a method for practical implementation? Environmental sustainability is important, but an analytical procedure must also meet the operational needs of the laboratory and the purpose of the analysis.
BAGI uses a structured scoring approach and a pictorial representation to summarise selected practical characteristics of an analytical method. Depending on the method and the applicable framework, these characteristics may include sample throughput, analysis time, sample preparation, automation, the number of analytes, and instrumental or operational requirements. The index is commonly represented by a score on a scale from 25 to 100, with higher values indicating stronger applicability according to the BAGI criteria.
The score should be interpreted within the method's intended context and in accordance with the original calculation rules. It is not a direct measure of environmental impact. In pharmaceutical laboratories, practical applicability is important for routine quality control, stability testing, dissolution analysis, and batch-release testing.
A method may have an attractive environmental profile but be difficult to implement if it requires complex preparation, specialised equipment, low sample BAGI can help researchers describe these operational considerations. For example, a rapid spectroscopic method may be convenient for screening large numbers of samples, while a chromatographic method may be necessary when the analysis requires separation of the drug from impurities or degradation products.
BAGI can support the discussion of practical suitability, but it cannot establish that the two methods are analytically interchangeable. When comparing HPLC and UPLC, practical factors may include the time needed to prepare samples, instrument availability, analysis time, automation, and the number of samples that can be processed within a given period. UPLC may offer faster separations in suitable applications, but the actual benefit depends on method design, equipment, column conditions, and laboratory workflow. Spectroscopic procedures may also receive favourable applicability assessments when they allow rapid measurements or minimal sample handling. However, matrix interference, calibration requirements, sensitivity, and the need for confirmatory analysis can influence their practical value.
The intended use of the method must therefore be clearly stated. A key advantage of BAGI is that it draws attention to usability and implementation rather than allowing the discussion to focus exclusively on environmental characteristics. This is valuable in pharmaceutical research, where an analytical method must be practical as well as scientifically appropriate. The main limitation is that BAGI should not be presented as a substitute for a greenness metric such as AGREE, GAPI, or the Analytical Eco-Scale.
A high applicability score does not necessarily mean low solvent consumption, reduced toxicity, or minimal waste. Conversely, a highly green procedure may still have practical limitations. For an international review article, BAGI is best discussed as a complementary applicability tool. Authors should identify the exact criteria used, cite the original BAGI paper, and avoid comparing its score directly with scores from environmental assessment tools. Its results should be considered alongside validation throughput, cost, and environmental information
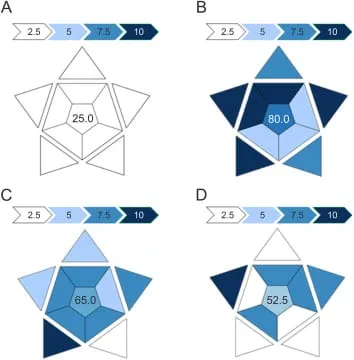
Figure 7: Blue Applicability Grade Index
7.6 Complementary Analytical Criteria Index (CACI)
The abbreviation CACI is used in some discussions of analytical-method evaluation, but its exact expansion and assessment framework must be verified against the specific publication being cited. It should not be presented as a universally established green analytical chemistry metric unless the original source clearly defines it and supports that description.[10]
If the CACI source intended for this review is a tool for evaluating the practicality or performance of analytical procedures, its role should be distinguished from tools that specifically assess environmental greenness. Analytical practicality, analytical performance, and environmental sustainability are related dimensions, but they are not interchangeable.
For pharmaceutical methods, practical evaluation may involve the amount of sample required, the number of preparation steps, analysis time, sensitivity, selectivity, portability, automation, and the suitability of the instrument for routine laboratory use. The exact criteria, however, must be taken from the original CACI publication rather than inferred from the acronym.
In an HPLC or UPLC application, such an assessment may be relevant when researchers need to discuss whether a procedure can be implemented reliably in a quality-control laboratory. Factors such as instrument availability, method complexity, sample throughput, and operator requirements may influence implementation, but they should only be attributed to CACI if they are explicitly part of its defined scoring system.
For spectroscopic methods, practical considerations may include measurement speed, sample handling, portability, calibration requirements, and the need for additional separation. These factors can help explain why a method is suitable for screening but not necessarily for confirmatory quantification or impurity profiling.
A method's practical advantages should always be interpreted alongside analytical performance. For example, a rapid UV–Vis procedure may be appropriate for a formulation with limited spectral interference, while HPLC may be needed when several components must be separated.
A practicality score alone cannot prove that one method can replace another. If the intended CACI tool provides a pictogram or numerical score, the review should describe the meaning of each component, the scale, and the rules used to calculate the result. The score should be reported only when the required input data are available and the calculation has been performed according to the original method.
The main challenge with discussing a less familiar or inconsistently named index is the risk of confusing it with another assessment framework. Therefore, confirm the full name, authors, publication year, and original journal article before including a detailed description or comparison table. Until that source has been confirmed,
CACI should be treated cautiously in the manuscript. It is safer to include only verified information and to state the scope of the tool precisely than to assign it criteria or advantages that may belong to a different metric. For a strong international review, provide the original citation and compare CACI with NEMI, the Analytical Eco-Scale, GAPI, AGREE,
BAGI only where the published criteria permit a meaningful comparison. Avoid directly comparing scores from different scales unless a validated basis for doing so has been established
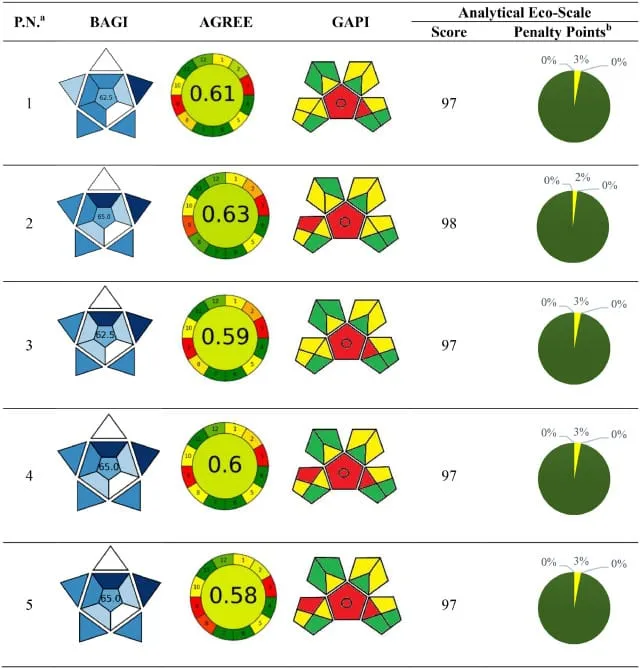
Figure 8: Comparison Table of Gapi/ Bagi/ Agreeand Aes
8.COMPARISON TABLE OF HPLC UPLC AND SPECTROSCOPIC METHODS;
| Feauters& parameters |
HPLC | UPLC | SPECTROSCOPIC METHODS |
|---|---|---|---|
| STATIONARY PHASE/PARTICLE SIZE | The stationary usually packed columns with particle size around 3-5 micro meters in the traditional HPLC systems | In UPLC uses very tiny particles which is less than or smaller than two micro meters inside the columns with the high pressure | In spectroscopic methods there is no need of stationary phase for direct UV measurements |
| OPERATING PRESSURE | In HPLC consist of a lower operating pressure than UPLC, HPLC traditional systems may operate up to roughly 6,000 PSI | UPLC systems are designed for high pressure these system operate around 15,000 PSI | In spectroscopic methods actually measure near atmospheric pressure in the cuvette, pressure parameter not needed |
| ANALYSIS TIME | HPLC can the several to ten minutes depending upon method and sample | UPLC is faster than HPLC method because highly efficient columns and flow | A UV visible can take few seconds two minutes for analysis |
| SOLVENT USE AND WASTE | HPLC require large organic solvent, it use substantially mobile phases volumes, with long runs with high flow | UPLC requires lesser to compare HPLC in the factors of organic solvent, waste and lower overall consumption | In spectroscopic methods it requires small volumes of aqueous but sample preparation and reagents can still generate waste |
| SELECTIVITY/ RESOLUTION |
HPLC provide separation of mixture components it depends upon performance on column chemistry and mobile phase | UPLC Is an ability to provide high efficiency and narrow peaks | It usually does not separate components but it determines concentration of the substance |
| THROUGHPUT | In HPLC the sample processing rate are throughput is moderate to high depends on sample preparation and runtime | In UPLC the sample processing rate is high because shorter run analysis | In spectroscopic methods the sample processing rate is very high for simple samples because readings are rapid |
| ENVIRONMENTAL PROFILE | HHPLC have a large solvent and waste button it produces high laboratory waste | UPLC is in a potentially greener than A comparable or I like two HPLC method UPLC genuinely reduce solvent waste generation | Here favorable for the direct measurement in the terms of environment profile |
| GREEN ASSESMENT TOOLS | In HPLC the green assessment tools for evaluation such as GIPI,AGREE ,NEMI | In UPLC also same tools were used for the evaluation criteria | In spectroscopic methods the tools used such as RGB,analytical eco scale,NEMI,GAPI etc |
RESULTS AND DISCUSSION
As seen throughout the literature reviewed, several factors must be considered when determining the environmental impact of an analytical method used within the pharmaceutical industry. These include solvent usage, chemical hazards, analysis time, energy usage and waste production. HPLC provides reliable separation and accurate results however traditional techniques can involve large volumes of organic solvents. UPLC can provide a reduction in analysis time and solvent volume, if operated under optimal conditions. UV-Vis spectroscopy can provide a simpler approach. If the analyte can be selectively quantified with minimal sample preparation then this technique will be useful. Green analytical methods can be used to provide insight into different areas of the environmental impact. The National Environmental Methods Index (NEMI), Analytical Eco-Scale (AES), Green Analytical Procedure Index (GAPI), Analytical GREEnness (AGREE) and Blue Applicability Grade Index (BAGI) are all useful tools. AES is a penalty point system which will take into consideration factors such as chemical hazards, energy usage and waste production. GAPI takes a visual approach to determine the environmental impact of each step of the analytical process. AGREE will determine how green a method is using the twelve principles of green analytical chemistry. NEMI will highlight certain environmental hazards and BAGI will consider how applicable the method is. Throughout the literature reviewed it was suggested that the use of appropriate solvents, optimisation of mobile phase composition and reducing any unnecessary analysis time can improve the sustainability of chromatography based methods. Artificial intelligence could be used to assist in choosing suitable starting conditions for the analysis but optimisation and validation of the method is still important for accurate results. Overall it has been found that it is important to have a balance between accuracy, safety and practicality when choosing sustainable analytical methods.
10.FUTURE RECOMMENDATIONS
In future research, methods should be developed for pharmaceutical analysis using accurate, cost-effective and eco-friendly methods. Safer solvents should be used wherever possible, for example ethanol and water. This will help to limit the negative impact on the environment caused by traditional HPLC and UPLC methods. Techniques should be researched to reduce solvent usage, decrease analysis time, reduce waste and decrease energy usage without compromising analytical accuracy. Spectroscopy (UV-Visible) could be further researched to provide an alternative method of analysis. Green evaluation tools should be used where appropriate, such as NEMI, Analytical Eco-scale, GAPI, AGREE and BAGI. These provide an accurate way to understand the environmental impact and appropriateness of analytical methods. In future research, AI could be looked into further to determine optimum conditions for experimentation, improve methods and then be tested in the lab. More research would be required to compare these techniques under the same conditions to ensure they are delivering a positive environmental impact. Overall, by considering greener solvents, efficient instrumentation, accurate evaluation methods and sustainable lab techniques, pharmaceutical analysis can become a safer, cost-effective and environmentally friendly process.
CONCLUSION
The concept of green analytical chemistry has become an essential part of pharmaceutical analysis. This review has discussed the various ways in which green analytical chemistry can be used in HPLC, UPLC, and spectroscopic analytical techniques. All of these techniques are utilised in pharmaceuticals, and the environmental impact of each one will be dependent on the type of solvent used, quantity of chemicals used, energy required, sample preparation and waste generated.
HPLC is still considered a useful analytical technique for separating and quantifying pharmaceutical compounds with good accuracy and reliability. However, the use of organic solvents and chemical waste may cause some concern. UPLC can provide quicker analysis times and less solvent use when operating under suitable conditions. This may increase the efficiency of the lab. However, whether HPLC or UPLC should be used will depend on the type of sample, analytical needs and environmental impact.
Spectroscopic techniques can be used in green pharmaceutical analysis. They may use less solvent and simple sample preparation. UV-visible spectrophotometry can be a suitable option for pharmaceutical compounds containing suitable absorption properties. It will depend on the properties of the drug, the presence of interfering substances and sensitivity/selectivity required. Therefore, the best choice of analytical techniques will depend on the purpose.
Various different tools can aid in the evaluation of the environmental impact and suitability of analytical techniques. NEMI highlights certain environmental hazards that could be caused. The Analytical Eco-Scale takes into account penalty points based on things such as chemical hazards, energy and waste. GAPI gives a visual guide using colour coding to show the environmental impacts of the different stages of the analysis. AGREE looks at methods against the twelve principles of green analytical chemistry. BAGI gives further information on the practicality of an analytical technique. By using these tools effectively, researchers can make better decisions.
Moving forward, the future developments should focus on using safer solvents, less sample preparation, less chemicals used and efficient analytical conditions. Research should also be carried out into using artificial intelligence in method development. Any conditions should be tested in practice. The comparison between analytical techniques should consider the environmental impact along with the quality of the analysis to ensure there is no compromise on reliability.
Overall this review shows that using greener analytical techniques in pharmaceuticals will depend on the instrument chosen and the way the analysis is set up. By combining suitable analytical techniques, safe chemicals, suitable green analytical tools and efficient lab techniques, the environmental impact can be minimised whilst meeting the pharmaceutical quality standards. Continuing to develop and use green analytical techniques can help create a more sustainable approach to pharmaceutical research, analysis and quality control.
12.ACKNOWLEDGEMENT
I would like to thank Dr. A. Kiran Kumar for his valuable guidance, encouragement, support and suggestions for this review article titled "Green Analytical Chemistry in Pharmaceutical Analysis: Sustained Strategies for HPLC and UPLC and Spectroscopic Methods". His knowledge and experience helped me to understand the subject well and this work was improved by his valuable suggestions. With his motivation and suggestions, I explored the basic principles of green analytical chemistry and its application in pharmaceutical analysis.
I would like to thank the Department of Pharmacy, Krishna Teja Pharmacy College, Tirupati for providing the required academic support, learning and facilities for completing this review article. I would also like to thank the faculty members of Department of Pharmacy for giving me encouragement, suggestions and support.
I would also like to thank authors and researchers who have provided me with information by publishing their research articles, reviews etc., which helped me to understand more about the sustainable analytical techniques, green solvents, chromatography and spectroscopy methods and various tools used for the analysis of greenness in analytical chemistry.
Lastly, I would like to thank my parents and family members for their constant encouragement, patience, understanding and support. I would also like to thank everyone who has directly or indirectly contributed towards completing this review article.
REFERENCES


V. Maneesh, Dr. A. Kiran Kumar, A. Shyam Kumar, Green Analytical Chemistry in Pharmaceutical Analysis; Sustainable Strategies for HPLC and UPLC and Spectroscopic Methods, Int. J. of Pharm. Sci., 2026, Vol 4, Issue 11, 3092-3108. https://doi.org/10.5281/zenodo.24360169
 10.5281/zenodo.24360169