

We use cookies to ensure our website works properly and to personalise your experience. Cookies policy
Principal K. M. Kundnani College of Pharmacy Cuffe Parade, Mumbai
A simple, accurate, precise and rapid reversed-phase high performance liquid chromatographic (RP-HPLC) method has been developed and subsequently validated for the estimation of Exemestane pure. The proposed method is based on the estimation of drug by reversed-phase mode using BDS HYPERSIL C18 (4.6mmø×250mm) analytical column. The optimised mobile phase consisted of Acetonitrile: Methanol: 65:35 v/v. Flow rate was kept at 1 ml/min. The estimation was carried out at detection wavelength of 246 nm. Drug Exemestane was well resolved and retained at 3.66 minutes. The method was statistically validated as per ICH guideline for analytical method validation. The validated method was used for estimation of Exemestane from bulk.
A large number of cases every year report uncontrolled cell growth and are diagnosed with cancer. Among females, breast cancer is the most common type of malignancy and is one of the major causes of their death1. The number of breast cancer cases is still increasing every year so; the disease has become a chief concern for health sciences. Development in genomics, proteomics and biomedical research has enabled scientists to unveil the receptors, mediators and signaling pathways involved in breast cancer pathogenesis. Breast cancer is mainly divided in four major molecular classes depending on the expression of hormone receptor (HR) and human epidermal growth factor receptor (HER) i) luminal A (HR+/HER2−); ii) luminal B (HR+/HER2+); iii) HER2+and (iv) triple-negative (TNBC). 60 to 80 % of cases represent the luminal type of breast cancer which over expresses hormone receptors, namely estrogen receptor and progesterone receptor2. This hormone-dependent positive breast cancer is assigned as the predominant one, requiring estrogen synthesis for its progression[3]. Thus reducing the level of estrogen remains valuable target for breast cancer treatment in both pre-menopausal and post-menopausal women. Reducing the effects of estrogen can be mediated by agents that blocks estrogen at the receptor level with inhibitors of estrogen biosynthesis, such as aromatase inhibitors[4-5]. Exemestane (EXE) is an orally active irreversible lipophilic steroidal aromatase inhibitor used for the therapy of metastatic postmenopausal breast cancer[6], EXE ( Figure 1) is chemically 6-methylenandrosta-1, 4-diene-3, 17-dione (C20H24O2; 296.403 g/mol), an irreversible aromatase inhibitor, is employed for the therapy of hormone-dependent breast cancer [7-8].
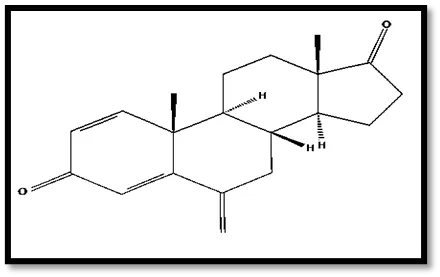
Figure 1. Chemical structures of Exemestane.
Various force degradation study and simultaneous estimation study was available but simple and RP-HPLC method was not available for estimation of amount of drug release from novel drug delivery system[9-12].The objective of the present work is to develop and validate new analytical method for estimation of Exemestane in bulk with good accuracy, simplicity, precision and economy over other chromatographic methods and which can be used for routine analysis.
Materials And Methods
Materials and Reagents:
Pure drug of Exemestane was kindly gifted sample. HPLC grade Methanol and Acetonitrile were purchased from SD Fine Chemicals, Mumbai.
Instrument:
JASCO double beam UV/Visible Spectrophotometer (Model V-630) with spectral bandwidth of 1 nm and 10 mm a matched quartz cell was used for scanning drug spectrogram. The HPLC system used was An Jasco Extrema Agilent 1200 series equipped with variable wavelength detector. The chromatogram was recorded using EZChrom software. All weighing were done on electronic balance (Model Shimadzu), Ultrasonicator model were used.
Chromatographic conditions:
Acetonitrile: Methanol in the ratio 65:35 v/v was used as mobile phase and was filtered before use through 0.45μm membrane filter. A constant flow of 1.0ml/min was maintained throughout the analysis. Detection was carried out using UV detector at 246 nm.
Experimental
Analytical Method Development
Preparation of Standard Stock and Working Solution:
100 mg Exemestane was accurately weighed and transferred into 100 ml volumetric flask separately and volume was made up to 100 ml with methanol. Working solution was prepared from standard solution. 1ml from each of stock solutions were pipetted out and transferred to 10ml volumetric flask and volume was made up to the mark with mobile phase.
Selection of Detection Wavelength:
UV absorption spectrum for 10 ppm solution of Exemestane was generated by scanning over the range of 200-400 nm and the spectrums were recorded to get λmax of analyte in Mobile Phase.
Analytical Method Validation:
Performance characteristics of analytical HPLC method were statistically validated as per ICH guideline for analytical method [13] by means of the following parameters.
Table 1: Analytical Method Validation: Parameters and their determination
|
Parameter |
Method / Procedure followed |
|
|
Specificity |
As per ICH, Specificity should be carried out to ensure identity of an analyte. To determine specificity chromatograms were obtained for blank and Exemestane individually. |
|
|
Accuracy
|
Accuracy was established across the specified range of analytical procedure by adding known added quantities of analyte to the synthetic mixture of drug product components and to the dosage form. As per ICH, Accuracy should be assessed using a minimum of 9 determinations over a minimum of three concentration levels covering the specified range i.e. 3 concentrations levels in triplicate. (e.g., 3 concentrations/ 3 replicates each) Accuracy of the method is reported as percent recovery of known added amount of analyte in sample. The percent recovery was calculated by performing recovery studies in triplicates of three concentration levels viz. 80%, 100%, 120% of 10ppm solution of synthetic mixture of Exemestane. |
|
|
Precision |
Precision was carried out at two levels. |
|
|
Repeatability |
Intermediate Precision |
|
|
Repeatability was assessed by using minimum of 9 determinations covering the specified range for the procedure (e.g., 3 concentrations/ 3 replicates each) |
Intermediate Precision was established to study the effects of random events i.e. days, on the precision of the analytical procedure. Intraday and interday precision studies were performed by taking 9 determinations of 3 concentrations/3 replicates each, at 3 times in a same day and on 3 different days, respectively. |
|
|
Precision is reported as standard deviation and relative standard deviation (coefficient of variation) for each type of precision investigated. |
||
|
Detection Limit and Quantification Limit
|
Detection limit and quantification limit is determined based on the standard deviation of the response and the slope.
σ = Standard deviation of response estimated based on the calibration curve. S = Slope of the calibration curve. |
|
|
Linearity
|
A linear relationship was evaluated across the range of 2 to 30 mg for drug namely Exemestane. As per ICH, for the establishment of linearity, a minimum of 5 concentrations are recommended. Linearity is reported by the value of the correlation coefficient, y-intercept, and slope of the regression line along with a plot of the data. Robustness Robustness was evaluated for proving the reliability of an analytical method |
|
|
Robustness
|
Robustness was evaluated for proving the reliability of an analytical method with respect to deliberate variations in method parameters. To establish robustness of analytical method following factors were studied 1. Influence of variations of pH in a mobile phase 2. Influence of variations in mobile phase composition 3. Temperature 4. Flow rate |
|
Results And Discussion
Analytical Method Development
Selection of Wavelength:
UV absorption spectra for 10 ppm solution of Exemestane individually given maximum absorption (Figure 2) at 246 nm was selected as a detection wavelength for chromatographic determination of Exemestane.
Figure 2. UV absorption spectra of Exemestane.
Optimization of Chromatographic Conditions:
According to the literature survey, it was observed that the drug Exemestan was well retained on C18 column respectively. Thus, in order to get optimum resolution simultaneously C18 column was selected. Many preliminary trials were carried out for selection of mobile phase; some are tabulated in table 2.
Table 2: Optimization trials for mobile phase composition
|
Mobile phase components |
Compositions |
|
ACN :Water |
(60:40) |
|
ACN : Methanol : Water |
(70:20:10) |
|
Methanol : Water |
(60:40), (70:30) |
|
ACN : Methanol |
(50:50) |
Different flow rate in the range of 0.6 to 1.0 ml/min and different injection volumes in the range of 20 μl to 100 μl were tried. Optimized mobile phase selected was composed of Acetonitrile: Methanol (65:35). Optimized chromatographic conditions are tabulated in table 3.
Table 3: Optimized chromatographic conditions
|
Mobile Phase |
Acetonitrile: Methanol |
|
Ratio |
65:35 |
|
pH of mobile phase |
- |
|
Stationary Phase |
C18 |
|
Flow Rate |
1 ml/min |
|
Detection Wavelength |
246 nm |
|
Injection Volume |
20 µl |
Chromatogram obtained using these optimized chromatographic conditions showed that drug namely Exemestane was well resolved and retained at 3.5 minutes. Chromatogram of Exemestane is shown in Figure 2.
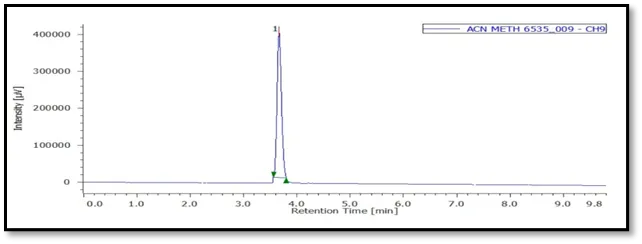
Figure 3: Standard chromatogram of Exemestane (10ppm)
Validation Parameters:
1. Specificity
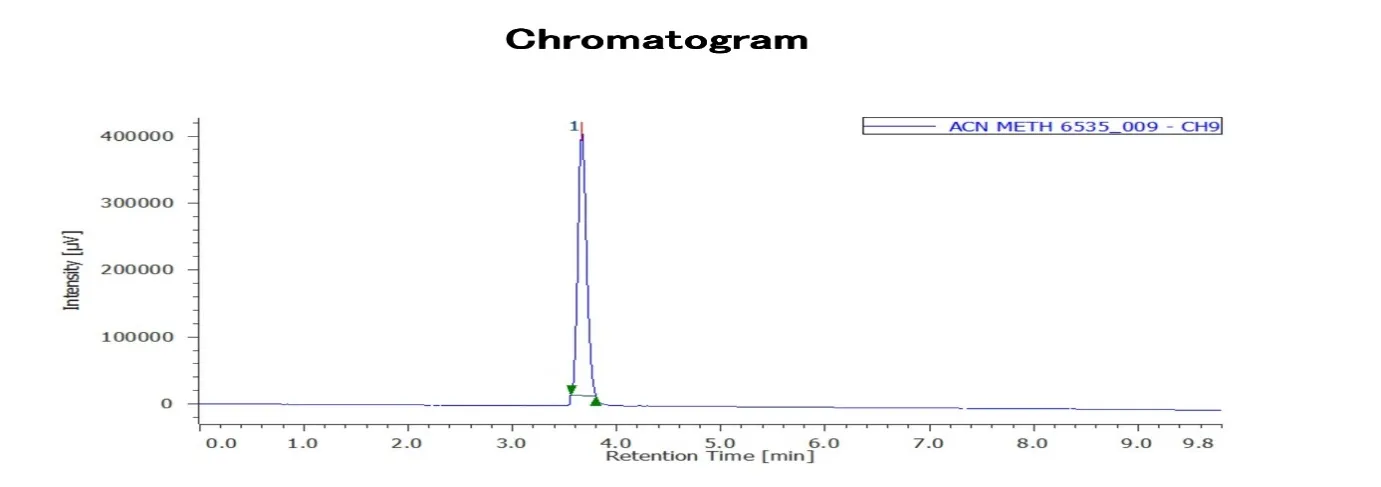
Separate chromatograms were obtained for blank, Exemestane individually to ensure the identity of analyte under study namely, the chromatograms of blank, Exemestane individually shown in figure 4.
|
|
|
|
Figure 4: An overlay of chromatograms of blank and exemestane individually
2. Linearity
Seven serial dilutions of Exemestane were prepared using a standard stock solution and dilution were made with mobile phase. [Acetonitrile: Phosphate Buffer (pH 4.5) (70:30)]. Responses were recorded as peak area. The peak areas were plotted against concentrations to obtain the calibration curve. Exemestane was found linear in the range of 2-30 ppm. The linearity plot of Exemestane is given in figure 5. The values of correlation coefficient, y intercept and slope of regression line are shown in table 4.
Table 4: Linear regression data for calibration curves
|
Parameter |
Range |
R2 |
y- intercept |
Slope |
|
Results |
10-50µg/mL |
0.999 |
4255.3 |
25636 |
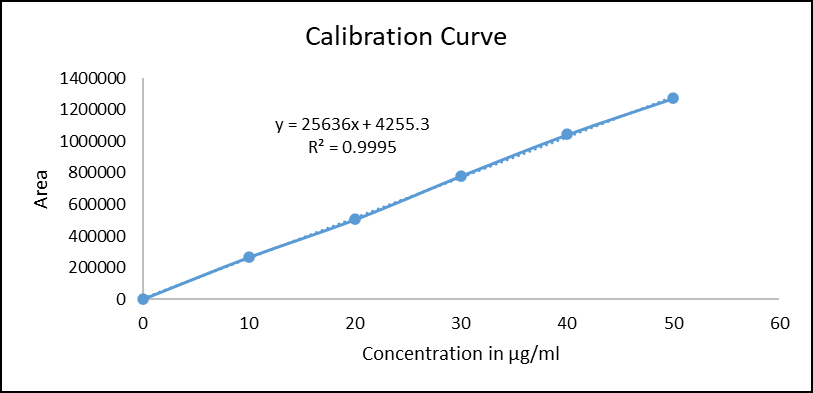
Figure 5: Calibration curve of Exemestane
3. Limit of Detection and limit of Quantization:
Values for detection limit and quantification limit were determined based on the standard deviation of the response and the slope of regression line. The calculated values of limit of detection and limit of quantitation for Exemestane are shown in table 5.
|
Parameters |
Result |
|
LOD |
0.201685 µg/ml |
|
LOQ |
0.632165 µg/ml |
Table 5: LOD and LOQ of Exemestane
4. Accuracy:
Accuracy of the method is reported as percent recovery of known added amount of analyte in sample. The percent recovery was calculated by performing recovery studies in triplicates of three concentration levels viz. 80%, 100%, 120% of 10 ppm solution of synthetic mixture of Exemestane. Results are tabulated in table 6.
|
Drug |
Exemestane |
||
|
Level of percentage recovery (%) |
80 |
100 |
120 |
|
Amount present in extract (µg/mL) |
20 |
20 |
20 |
|
Amount added (µg/mL) |
16 |
20 |
24 |
|
Total amount (µg/mL) |
36 |
40 |
44 |
|
% recovery |
98.33 |
100.36 |
100.48 |
|
% RSD |
0.41 |
0.97 |
0.18 |
|
Inference |
Acceptable recovery hence accurate |
||
Table 6: Recovery studies
5. Precision:
The results of intraday and interday precision studies are tabulated in table 7 and 8 respectively. Percent RSD values for both intraday and interday precision were found within acceptable limit.
|
Sr No. |
Sample |
Area |
Theoretical plate |
Tailing factor |
Retention time |
|
1 |
10 |
1263977 |
7611 |
1.218 |
3.673 |
|
2 |
20 |
1269204 |
7652 |
1.183 |
3.677 |
|
3 |
30 |
1276482 |
7576 |
1.174 |
3.68 |
|
4 |
40 |
1268820 |
7646 |
1.16 |
3.68 |
|
5 |
50 |
1271409 |
7623 |
1.162 |
3.677 |
|
6 |
60 |
1276708 |
7614 |
1.173 |
3.677 |
|
Mean |
1271100.00 |
7620.33 |
1.18 |
3.68 |
|
|
SD |
4899.82 |
27.43 |
0.02 |
0.00 |
|
|
%RSD |
0.39 |
0.36 |
1.80 |
0.07 |
|
|
Inference |
Acceptable % RSD, hence precise |
||||
Table 7: Inter-Day Precision Data
|
Sr No. |
Sample |
Area |
Theoretical plate |
Tailing factor |
Retention time |
|
1 |
10 |
1263977 |
7611 |
1.218 |
3.673 |
|
2 |
20 |
1269204 |
7652 |
1.183 |
3.677 |
|
3 |
30 |
1276482 |
7576 |
1.174 |
3.68 |
|
4 |
40 |
1268820 |
7646 |
1.16 |
3.68 |
|
5 |
50 |
1271409 |
7623 |
1.162 |
3.677 |
|
6 |
60 |
1276708 |
7614 |
1.173 |
3.677 |
|
Mean |
1271100.00 |
7620.33 |
1.18 |
3.68 |
|
|
SD |
4899.82 |
27.43 |
0.02 |
0.00 |
|
|
%RSD |
0.39 |
0.36 |
1.80 |
0.07 |
|
|
Inference |
Acceptable % RSD, hence precise |
||||
Table 8: Intra-Day Precision Data
6. Robustness:
To determine robustness of analytical HPLC method changes observed in retention time and response were recorded. Method was found to be reliable and robust as method performance (retention time and response) is not much affected by deliberate variations in mobile phase composition and its pH, column temperature and flow rate. The results obtained are tabulated in table 9.
|
Sr No. |
1 |
2 |
3 |
MEAN |
SD |
%RSD |
||
|
FLOW RATE |
0.6 ml/min |
AREA |
854699 |
863891 |
867987 |
862192 |
6804.91 |
0.79 |
|
RT |
4.883 |
4.867 |
4.867 |
5 |
0.01 |
0.19 |
||
|
NTP |
8395 |
8327 |
8259 |
8327 |
68.00 |
0.82 |
||
|
1 ml/min |
AREA |
524197 |
523552 |
523469 |
523739 |
398.52 |
0.08 |
|
|
RT |
2.953 |
2.95 |
2.937 |
3 |
0.01 |
0.29 |
||
|
NTP |
7173 |
7023 |
7071 |
7089 |
76.60 |
1.08 |
||
|
TEMP |
20°C |
AREA |
706499 |
700791 |
708805 |
705365 |
4125.59 |
0.58 |
|
RT |
3.72 |
3.723 |
3.723 |
4 |
0.00 |
0.05 |
||
|
NTP |
7287 |
7312 |
7321 |
7307 |
17.62 |
0.24 |
||
|
30°C |
AREA |
690390 |
669353 |
692576 |
684106 |
12823.43 |
1.87 |
|
|
RT |
3.707 |
3.633 |
3.63 |
4 |
0.04 |
1.19 |
||
|
NTP |
7450 |
7700 |
7609 |
7586 |
126.53 |
1.67 |
||
|
WAVELENTH |
263nm |
AREA |
673181 |
685501 |
672753 |
677145 |
7239.67 |
1.07 |
|
RT |
3.647 |
3.677 |
3.677 |
4 |
0.02 |
0.47 |
||
|
NTP |
7669 |
7461 |
7494 |
7541 |
111.79 |
1.48 |
||
|
267nm |
AREA |
701973 |
693345 |
686466 |
693928 |
7769.92 |
1.12 |
|
|
RT |
3.673 |
3.673 |
3.67 |
4 |
0.00 |
0.05 |
||
|
NTP |
7427 |
7416 |
7386 |
7410 |
21.22 |
0.29 |
||
Table 9: Robustness result
CONCLUSIONS:
The developed RP-HPLC method has been statistically validated by ICH guidelines and it is found to be specific, accurate, precise and robust. Validation studies indicated that the proposed method is suitable for the estimation of exemestane in bulk and in pharmaceutical formulation. The method can be conveniently adopted for routine analysis of the formulations containing exemestane.
REFERENCES

Priyanka Mohite*, Nalini Kurup, Hplc Method Development and Validation for Estimation of Exemestane from Bulk, Int. J. of Pharm. Sci., 2026, Vol 4, Issue 5, 8332-8340. https://doi.org/10.5281/zenodo.20475936
 10.5281/zenodo.20475936