

We use cookies to ensure our website works properly and to personalise your experience. Cookies policy
Department of Pharmaceutical Quality Assurance, Channabasweshwar Pharmacy College, Kava Road, Basweshwar Chowk, Latur, 413512
A Simple, specific, accurate and precise RP-HPLC method for the determination of Lasmiditan in API and pharmaceutical dosage form by using QBD technique. Chromatogram was run through Sunfire C18 Column (250mm x 4.6 mm, 5?). Mobile phase containing 0.1% Ortho phosphoric acid: Acetonitrile taken in the ratio 60:40 was pumped through column at a flow rate of 0.98ml/min. temperature was maintained at 30°C. Optimized wavelength selected was 254 nm. Retention time of Lasmiditan was found to be 2.363 min. %RSD of the Lasmiditan were and found to be 0.3. %RSD of Method precision of Lasmiditan was found to be 0.5. %Recovery was obtained as 99.87% for Lasmiditan. LOD, LOQ values obtained from regression equation of Lasmiditan were 0.1, 0.32. Regression equation of Lasmiditan is y = 16896x + 3290.4. Retention times were decreased and that run time was decreased, so the method developed was simple and economical that can be adopted in regular Quality control test in Industries.
Migraine is one of the most common neurological disease(1). Migraine presents with severe, intermittent attacks of headache associated with nausea, vomiting, phonophobia and photophobia(2). It is treated by nonspecific analgesics, like NSAIDS and specific drugs like triptans and ergot derivatives (3). The triptans have the risk of life-threatening cardiovascular side effects because of their activation of 5 HT1Breceptor (4,5). Lasmiditan is a newer oral 5-hydroxy tryptamine receptor agonist with high selectivity and affinity for 5HT1F receptor(6) without any serious adverse effects on cardiovascular system due to its low affinity for 5HT1B receptors(7). Lasmiditan is a centrally penetrating, non-vasoconstrictive drug which inhibits Trigeminal vascular nociception Lasmiditan is an anti-migraine drug chemically known as 2,4,6-Trifluoro-N-[6-[(1-methyl-4-piperidinyl)carbonyl]-2-pyridinyl]benzamide(8).
Analytical Quality by Design (AQbD) is a systematic approach to design the methods that start with defining the separation goals and target method profile. The main AQbD focus areas are comprehension of method parameters and controls, founded on reliable science and quality risk management(9-12). Along with other elements including process parameters, material attributes, equipment operating conditions, in-process controls, and finished product specifications, a QbD is also a crucial component of the product development control plan(13,14). Regulatory agencies do not define any specific process of AQbD, however, a parallel approach can be drawn based on product QbD e.g., Quality target product profile (QTPP) can be inferred as Quality target method profile (QTMP), CQA can be interpreted as critical quality attributes such as tailing factor, the resolution between adjacent peaks, and plate count, etc. Design space can be called method operable design range (MODR) (15).
2. EXPERIMENTAL WORK
2.1. Instruments and software
On an HPLC Water HPLC 2965 system outfitted with a UV–Vis detector, quaternary pump, vacuum degasser, column oven, and Design Expert (13.0.0) Module Empower 3, chromatographic studies were carried out. Using 1.0cm quartz cuvettes and UV-Probe software, spectrophotometric measurements were carried out on a dual beam path spectrophotometer (Microprocessors UV -Vis- 228 single Beam. Sunfire C18 Column, (4.1 x 250mm, 5.0µm) column was used for chromatographic separation. pH measurements were made with a pH meter (Eutech instruments pH tutor, pH meter India) equipped with a glass electrode, Hot air oven (REMI Scientific), Vortex meter (REMI Scientific)
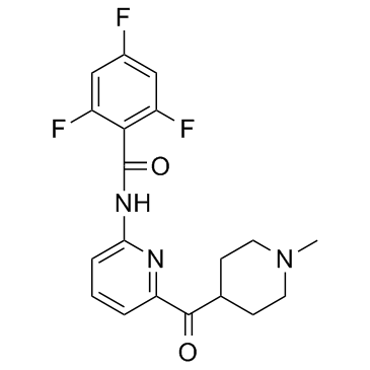
Fig.no.1 Chemical structure 0f Lasmiditan
2,4,6-trifluoro-N-[6-(1-methylpiperidine-4-carbonyl)pyridin-2-yl]benzamide
Table no.1 The chemical properties of Lasmiditan
|
Parameter |
Details |
|
CAS Number |
439239-90-4 |
|
Molecular Weight |
377.367 g/mol |
|
Molecular Formula |
C??H??F?N?O? |
|
Appearance |
White, crystalline powder |
|
Physical State |
Solid |
|
Solubility |
Sparingly soluble in water, slightly soluble in ethanol, and soluble in methanol |
|
pK Value |
12.23 |
2.2. Materials and reagents
Pure Lasmiditan API gift sample was from Spectrum pharma lab (Hyderabad). Hydrochloric acid AR grade (HCL) and sodium hydroxide AR grade (NAOH) were obtained from rankem, India. Hydrogen Peroxide (H2O2) was purchased from Qauligens. Acetic acid AR grade was purchased from Fisher scientific, India and S.D. Finechem Ltd. Respectively. Potassium dihydrogen orthophosphate and ortho phosphoric acid were obtained from S.D. Fine chem Ltd and Merck India Pvt Ltd. Respectively. HPLC grade Acetonitrile (ACN) was purchased from Fischer scientific. HPLC grade water used throughout analysis was obtained from the Merck milli-Q water purification unit.
2.3. Solutions
Preparation of 0.1% Ortho phosphoric acid buffer
1ML of Ortho phosphoric acid solution in a 1000ml of volumetric flask add about 100ml of milli-Q water and final volume make up to 1000 ml with milli-Q water.
Preparation of Standard stock solutions: Accurately weighed 25mg of Lasmiditan transferred to 50ml volumetric flask. 3/4 th of diluents was added to the flask and sonicated for 10 minutes. Flask was made up with diluents and labeled as Standard stock solution. (500µg/ml of Lasmiditan)
Preparation of Standard working solution (100% solution): 1ml from each stock solution was pipetted out and taken into a 10ml volumetric flask and made up with diluent. (50µg/ml of Lasmiditan).
2.4. Determination of λmax
The sample solution has been prepared and scanned inside the UV vicinity of 400-200 nm and the spectrum showed the maximum absorbance at 254 nm.
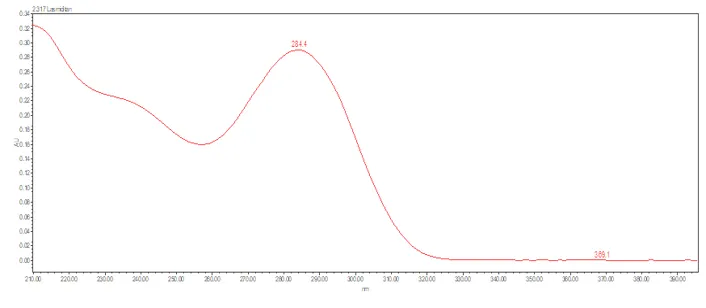
Fig.no.2 UV Spectrum of Lasmiditan
2.5. Development of method
The chromatographic conditions were optimized to obtain good peak parameters such as a good peak shape, the lowest tailing factor, a short retention time, and a high theoretical plate number. Initially, mobile phases consisting of various buffer systems were investigated, but the required system compatibility characteristics could not be achieved. Different types (X-Terra C18 (250×4.6 mm×5μm), Extend C18 (250 ×4.6 mm, 5μm), Synergy Hydro C18 (250× 4.6 mm×4μm) and Luna C18 (250×4.6mm×5μm) and different lengths of columns (X-Terra C18 (150× 4.6 mm ,5μm), Extend C18 (150×4.6mm, 5μm), Synergy Hydro C18 (150×4.6 mm, 4μm) and Luna C18 (150×4.6mm,5μm) were tested but showed poor system compatibility parameters. Good peak parameters were obtained using an Sunfire C18 Column, (4.1 x 250mm, 5.0µm) column.
Different ratios of water/methanol, water/ acetonitrile, and 0.01N KH2PO4/acetonitrile mixtures were tested as mobile phases. Initially, acetonitrile and 0.1% OPA (60/40, V/V) were used as mobile phase, which resulted in a very long analysis time. Under these conditions, the sample solution was injected to detect both impurities that may interfere with the analyte peak and the presence of drug matrix components that may remain longer on the column under the specified conditions. Furthermore, the sample solutions were injected sequentially into the system with an analysis time of 10 min and it was observed that no impurities were carried over from one analysis to the next. Therefore, the analysis time was set to 10 min. Furthermore, the column temperature was chosen as 30°C due to its many advantages such as high column efficiency, low column pressure favorable peak shape, and cost-effectiveness.
The spectral pattern of Lasmiditan was comprehensively investigated using different solvents (ultrapure water, ethanol, methanol) for spectrophotometric analysis. Since the standard solutions of Lasmiditan have maximum absorbance at 254 nm wavelength, the absorbance values of the standard and sample solutions were measured at this wavelength.
2.5 Development by QbD Approach
The method was optimized using central composite design (CCD). The initial trials are needed to optimize the final method. Organic concentration, Flow rate and column temperature were needed to be optimized. So, CCD was used to optimize these parameters which were varied over three level (high, mid and low). different ranges of four parameters ranging from 55-65%, Aqueous solvent, column temperature 27°C and 33°C and 0.9-1.1ml/min flow rate respectively were taken and counter and 3D surface plot showing the effect of each parameter on retention Time, theoretical plates and asymmetry (CQA) were generated. A desirability function applied to the optimized conditions to predict retention time, asymmetry, theoretical plates, and peak area.
Table no. 2. Design summary of CCD
|
Design Summary |
|||||
|
File version: DX 11.0.0 Study Type: Response surface Design Type: central composite design Design Model: Quadratic |
ATP: Robustness CQA: Retention time and Theoretical plates Runs: 20 |
||||
|
CMPs |
Unit |
Type |
Subtype |
Min. |
Max. |
|
column temperature |
0C |
Numeric |
Continuous |
25 |
35 |
|
Flow rate |
ml/min |
Numeric |
Continuous |
0.83 |
1.17 |
|
%Org ratio |
% |
Numeric |
Continuous |
51.6 |
68.4 |
Table no. 3. Central composite experimental design matrix with response
|
|
|
Factor 1 |
Factor 2 |
Factor 3 |
Response 1 |
Response 2 |
Response 3 |
|
Std |
Run |
A:FR |
B:MP |
C:TEMP |
RT |
NTP |
TF |
|
|
|
ml/min |
% |
0 C |
min |
num |
num |
|
1 |
17 |
0.9 |
55 |
27 |
2.904 |
5946 |
1.09 |
|
2 |
18 |
1.1 |
55 |
27 |
2.43 |
4850.5 |
1.08 |
|
3 |
14 |
0.9 |
65 |
27 |
2.854 |
5941.3 |
1.1 |
|
4 |
3 |
1.1 |
65 |
27 |
2.354 |
4691.7 |
1.1 |
|
5 |
12 |
0.9 |
55 |
33 |
2.387 |
4631.3 |
1.1 |
|
6 |
8 |
1.1 |
55 |
33 |
1.997 |
3724.1 |
1.04 |
|
7 |
6 |
0.9 |
65 |
33 |
2.351 |
4531.6 |
1.11 |
|
8 |
10 |
1.1 |
65 |
33 |
1.936 |
3652.2 |
1.05 |
|
9 |
13 |
0.831821 |
60 |
30 |
2.79 |
5802.8 |
1.11 |
|
10 |
1 |
1.16818 |
60 |
30 |
2.03 |
4076.5 |
1.06 |
|
11 |
7 |
1 |
51.591 |
30 |
2.476 |
4800.5 |
1.07 |
|
12 |
15 |
1 |
68.409 |
30 |
2.371 |
4712 |
1.09 |
|
13 |
11 |
1 |
60 |
24.9546 |
2.801 |
5820.7 |
1.1 |
|
14 |
19 |
1 |
60 |
35.0454 |
2.035 |
3677.6 |
1.07 |
|
15 |
16 |
1 |
60 |
30 |
2.439 |
5104.6 |
1.08 |
|
16 |
5 |
1 |
60 |
30 |
2.434 |
4944.5 |
1.08 |
|
17 |
9 |
1 |
60 |
30 |
2.423 |
5129.3 |
1.08 |
|
18 |
20 |
1 |
60 |
30 |
2.434 |
4883.1 |
1.08 |
|
19 |
2 |
1 |
60 |
30 |
2.391 |
5145.8 |
1.08 |
|
20 |
4 |
1 |
60 |
30 |
2.442 |
5162.2 |
1.07 |
Statistical Analysis and Final Optimization
The responses obtained after carrying out the above trial runs were fed back to Design Expert software and plots like 3D-response surface plots and Graph plots were plotted. These graphs demonstrated how important procedure factors affected the chosen quality criteria. The analysis of these plots was used to estimate which method parameter gave the most acceptable responses. Thus, the method's final critical method parameters and optimal chromatographic conditions were established in light of these observations. Additionally, the significance of each method parameter chosen for the study was determined using a statistical analysis tool like ANOVA for each response using the p-value (probability).
2.6 Validation of the Optimized Method:
According to ICH guidelines method validation can be defined as “Establishing documented evidence, which provides a high degree of assurance that a specific activity will consistently produce a desired result or product meeting its predetermined specifications and quality characteristics”.
Validation of analytical procedures was performed for Lasmiditan using the following parameters.
Specificity: The following solutions will be made and injected (peak purity double-checked) to show the accuracy of the procedure.
1. Blank (methanol 100% as a diluent)
2. Standard solution
3. Sample solution
4. Placebo treatments
Linearity: The method's linearity was examined at six distinct Lasmiditan concentrations ranging from 12.5µg/ml to 75µg/ml to produce the calibration curve, peak area was plotted on the x axis against concentration. The regression line equation and correlation coefficient values were computed.
Accuracy (% Recovery): The accuracy of the method was confirmed by a recovery study from marketed formulation at 3 levels of standard addition. The percentage recovery of Lasmiditan was found out.
Precision: The precision is reported in terms of relative standard deviation (RSD). There are three levels of precision: repeatability, reproducibility and intermediate precision. It takes place using a sample API.
• Repeatability (Intraday precision)
• Intermediate precision (Inter day precision)
Limits of Detection and Quantitation: Limits of detection (LOD) and limit of quantitation (LOQ) were determined from the signal-to-noise ratio. The detection limit was referred to as the lowest level of concentration resulting in a peak area of three times the baseline noise. The quantitation limit was referred to as the lowest possible concentration that provided a peak area with a signal-to-noise ratio higher than ten.
LOD = 3.3 × δ/S
LOQ = 10× δ/S
Robustness: To demonstrate the robustness of the procedure, the following optimized conditions were slightly varied.
2.7 Application of analytical methods to commercial formulations
Preparation of Sample stock solutions: 10 tablets were weighed and the average weight of each tablet was calculated, then the weight equivalent to 1 tablet was transferred into a 100ml volumetric flask, 50ml of diluents was added and sonicated for 25 min, further the volume was made up with diluent and filtered by HPLC filters (1000µg/ml of Lasmiditan)
Preparation of Sample working solution: 0.5ml of filtered sample stock solution was transferred to 10ml volumetric flask and made up with diluent. (50µg/ml of Lasmiditan)
3. RESULTS AND DISCUSSION
3.1. Determination of the wavelength
Standard solutions prepared using ultrapure water were scanned in a spectrophotometer device in the 200–400 nm wavelength range. The maximum absorption wavelength of Lasmiditan was determined as 254 nm.
3.2. Development of methods
The conditions of the developed analytical methods are given below. Sunfire C18 Column, (4.1 x 250mm, 5.0µm) at a constant temperature of 30? was used for separation in the chromatographic method. The mobile phase contained Acetonitrile and 0.1% OPA (60:40%v/v). At a flow rate of 0.98min/ml, isocratic elution was carried out and 254 nm was chosen for detection. Spectrophotometric method; the spectral pattern of Lasmiditan was extensively analyzed. To determine the wavelength at which Lasmiditan standard solutions maximally absorbed UV light, the standard solutions were scanned in the 200–400 nm wavelength range. A wavelength of 254 nm was selected for detection.
3.3 Statistical Analysis of Experimental Data by Design-expert Software:
In order to understand the results, contour plots and 3D plot were generated after processing all data using the Design Expert® software (Fig.3). It shows the two-dimensional contour plot as a function of Column temperature, Flow rate and organic ratio. Based on the color code, the working region can be easily identified. Retention time maps represent the value of the retention time, with warm “red” colors indicating larger retention time, cold “blue” colors lower and light green to yellow color represent intermediate retention time.
Table no. 4 ANNOVA for CCD
|
Source |
Sum of Squares |
Df |
Mean Square |
F-value |
p-value |
|
|
Model |
1.43 |
6 |
0.2385 |
690.01 |
< 0.0001 |
significant |
|
A-FR |
0.6844 |
1 |
0.6844 |
1980.11 |
< 0.0001 |
|
|
B-MP |
0.0117 |
1 |
0.0117 |
33.83 |
< 0.0001 |
|
|
C-Temp |
0.7308 |
1 |
0.7308 |
2114.57 |
< 0.0001 |
|
|
Residual |
0.0045 |
13 |
0.0003 |
|
|
|
|
Cor Total |
1.44 |
19 |
|
|
|
|
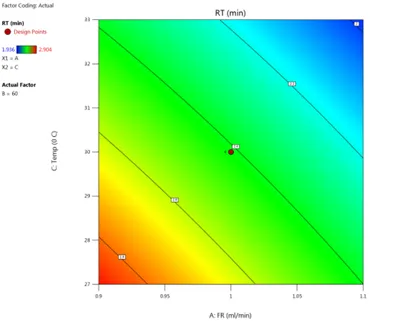
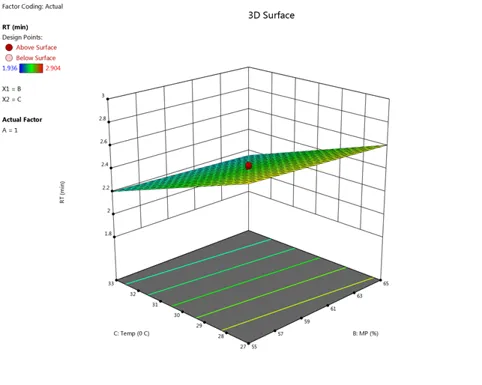
Fig.no.3 2D and 3D contour plots of retention time as a function of Column temperature, Flow rate and organic ratio.
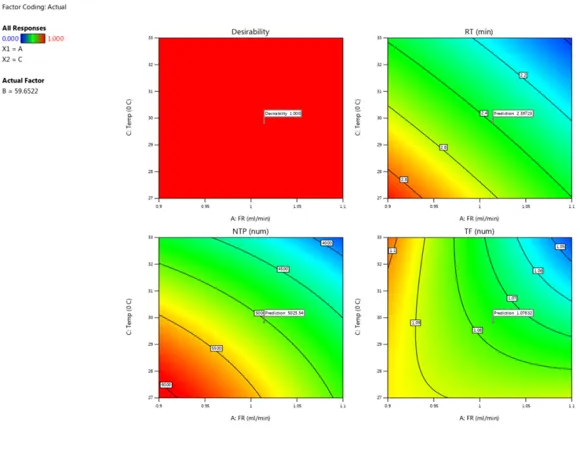
Fig.no.4 Overall desirability of final method
3.4 Method Validation
The analytical methods developed for the quantification of Lasmiditan in oral formulations were validated for “selectivity, system suitability, linearity, precision, sensitivity, robustness, and specificity” according to ICH Q2 (R1) guidelines. Standard, sample, and mobile phase solutions were injected into the chromatographic system to evaluate the selectivity of the chromatographic method.
Table no.5 final optimized HPLC chromatographic conditions
|
Parameters |
Results |
|
Mobile phase |
Acetronitrile : 0.1% OPA (60:40) |
|
Flow rate |
0.98ml/min |
|
Column |
SunFire C18 Column, 5 µm, 4.6 mm X 250 mm, |
|
Detector wavelength |
254 nm |
|
Column temperature |
300C |
|
Injection volume |
10µl |
|
Run time |
10 min |
|
Retention time |
2.363 |
|
Diluent |
Methanol: Water 50:50 %V/V |
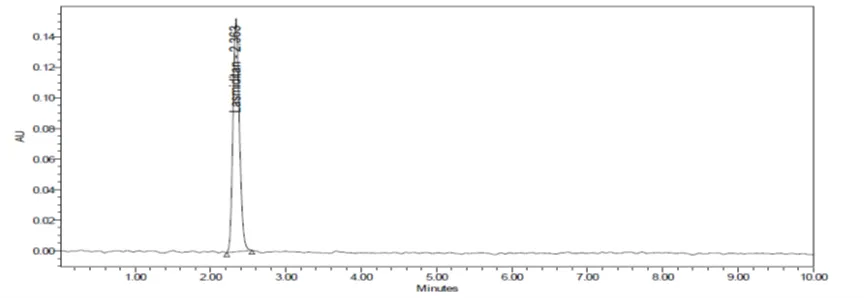
Fig.no.5 final optimized chromatogram
3.4.1 Linearity:
Six linear concentration of Lasmiditan (12.5-75µg/ml) were injected in a duplicate manner. Average areas were mentioned above and linearity equations obtained for Lasmiditan was y = 16896x + 4262. Correlation coefficient obtained was 0.999 and Linearity plot was shown in Fig 8.
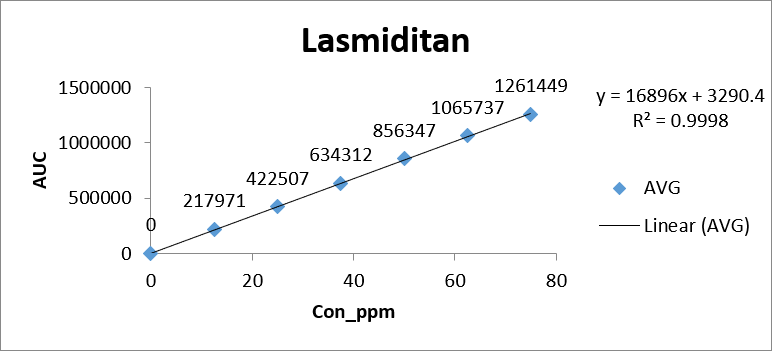
Fig.no.6 Linearity Plot
3.4.2. Precision:
Results of precision are shown in Table No. 5, and it shows a standard deviation of less than 2, which indicates that the proposed method is precise.
Table no.6 Precision Studies
|
Type |
Area |
Std. Dev |
% RSD |
|
Repeatability |
850422 |
4031.6 |
0.5 |
|
Intermediate precision |
845487 |
2948.6 |
0.3 |
|
Method precision |
851967 |
2634.8 |
0.3 |
3.4.3 Accuracy:
Three Concentrations of 50%, 100%, 150% are Injected in a triplicate manner and %Recovery was calculated as 99.87%.
Table no.7 Accuracy studies
|
% Level |
Amount Spiked (μg/mL) |
Amount recovered (μg/mL) |
% Recovery |
Mean % Recovery |
|
50% |
25 |
24.813 |
99.25 |
99.87% |
|
25 |
25.058 |
100.23 |
||
|
25 |
24.848 |
99.39 |
||
|
100% |
50 |
49.555 |
99.11 |
|
|
50 |
49.790 |
99.58 |
||
|
50 |
49.708 |
99.42 |
||
|
150% |
100 |
74.872 |
99.83 |
|
|
100 |
75.505 |
100.67 |
||
|
100 |
76.011 |
101.35 |
3.4.4 Specificity
It was tested for the interference of any degraded substance, and as shown in the chromatogram (Fig. no. 7,8,9) there is no other peak.
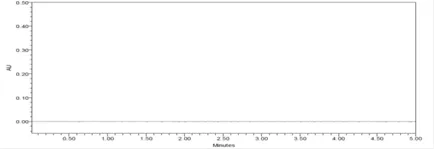
Fig.no.7 blank Chromatogram
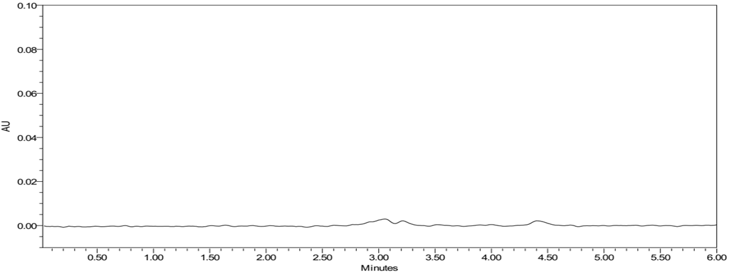
Fig.no.8 Placebo Chromatogram
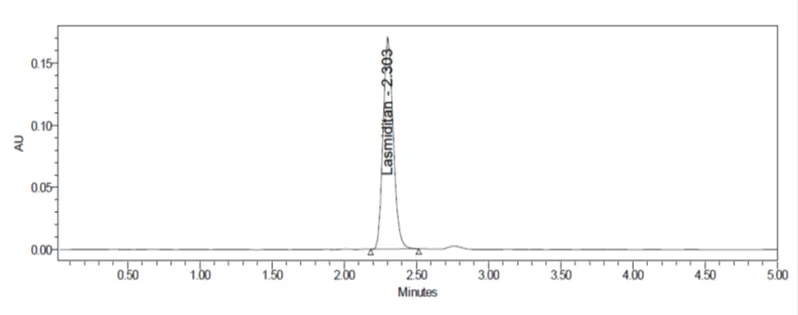
Fig.no.9 Standard chromatogram
3.4.5 Robustness
The results of robustness studies by varying mobile phase composition, flow rate and column temperature are shown in (Table no.8). RSD less than 2 indicated that the method is robust.
Table no.8 Robustness Studies
|
Parameter |
%RSD |
|
Flow Minus |
0.1 |
|
Flow Plus |
0.1 |
|
Mobile phase Minus |
0.1 |
|
Mobile phase Plus |
0.2 |
|
Temperature minus |
0.3 |
|
Temperature plus |
0.3 |
3.4.6. LOD :
Detection limit of the Lasmiditan in this method was found to be 0.1µg/ml.
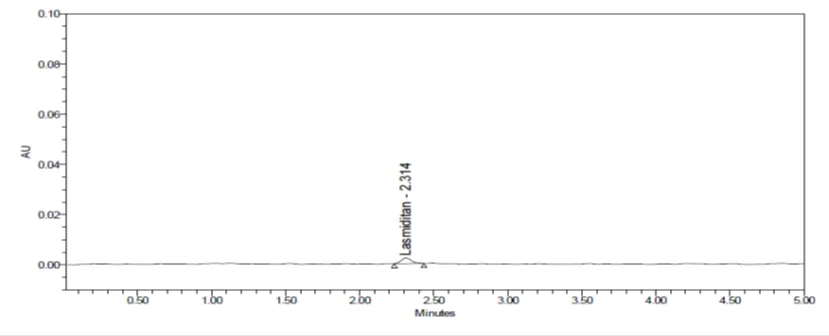
Fig.no.10 LOD Chromatogram of Lasmiditan
3.4.7. LOQ :
Quantification limit of the Lasmiditan this method was found to be 0.32µg/ml.
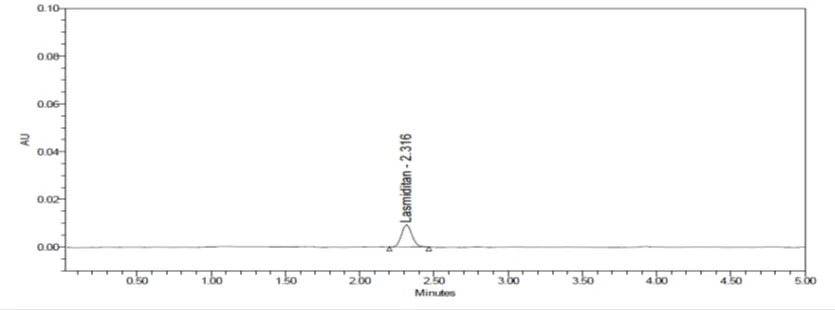
Fig.no.11 LOQ Chromatogram of Lasmiditan
3.5 ASSAY OF MARKETED FORMULATION
The results of the assay are shown in Table No.9. The percent RSD was 0.47 which is within limits.
Table no.9 Assay of Formulation
|
Sr.no. |
Standard area |
Sample area |
% assay |
|
1 |
855394 |
845477 |
99.0 |
|
2 |
851738 |
845223 |
99.0 |
|
3 |
847972 |
852477 |
99.9 |
|
4 |
850808 |
852608 |
99.9 |
|
5 |
854305 |
854672 |
100.1 |
|
6 |
851586 |
852072 |
99.8 |
|
Avg |
851967 |
850422 |
99.62 |
|
SD |
2634.8 |
4031.6 |
0.47 |
|
%RSD |
0.3 |
0.5 |
0.5 |
4. CONCLUSION
Lasmiditan is an antimigraine drug. In this study the three independent variables flow rate, column temperature and organic phase with three dependent factors such as number of theoretical plates, retention time and tailing factor were taken. The experimental design suggested MODR region for lasmiditan and considering that the HPLC method was developed. The developed HPLC method is specific, sensitive, precise, accurate and robust. The method is linear over a wide range, economical and utilizes a mobile phase which can be easily prepared. All these factors make this method suitable for the quantification of lasmiditan in bulk drugs and pharmaceutical dosage forms without any interference from degradants or excipients. This method can also be used for the regular quality control analysis of lasmiditan, Results which were obtained from the validation of the developed analytical method were within the limit as per ICH guidelines.
ACKNOWLEDGEMENT
The authors express their sincere gratitude to Channabasweshwar Pharmacy College (Degree), Kava Road, Basweshwar Chowk, Latur, for providing all the required facilities to accomplish the entitled work.
REFERENCES

Swami Jayashri, Koshidgewar Anushka, Implementation of QbD Strategy in RP-HPLC Method Development and Validation for Lasmiditan in Pharmaceutical Formulation, Int. J. of Pharm. Sci., 2026, Vol 4, Issue 6, 5801-5812. https://doi.org/10.5281/zenodo.20806021
 10.5281/zenodo.20806021