

We use cookies to ensure our website works properly and to personalise your experience. Cookies policy
Department of Pharmacology, Shantha College of Pharmacy, Peresandra, Chikkaballapur-562104, Karnataka, India.
Background: The blood–brain barrier (BBB) is a highly selective physiological interface that regulates the movement of substances between the systemic circulation and the central nervous system. Although this barrier protects the brain from potentially harmful compounds, it also creates a major challenge during the development of drugs intended to act within the central nervous system. Early prediction of BBB penetration can support compound prioritization and reduce the need for extensive experimental screening. Objective: The present study aimed to develop and compare machine-learning models for predicting BBB penetration using readily interpretable molecular descriptors. A secondary objective was to explore whether predicted BBB penetration was associated with the reporting of central nervous system-related adverse events in the FDA Adverse Event Reporting System (FAERS). Methods: A dataset containing 2,039 compounds with binary BBB classification labels and molecular descriptors was analyzed using Orange Data Mining software. Twelve molecular descriptors were used as predictive variables: molecular weight, LogP, hydrogen-bond donors, hydrogen-bond acceptors, rotatable bonds, heavy atom count, ring count, aromatic ring count, fraction Csp3, formal charge, Labute accessible surface area, and topological polar surface area. Feature ranking was performed using Information Gain. Logistic Regression, Random Forest, Support Vector Machine, and k-Nearest Neighbors classifiers were evaluated using 5-fold stratified cross-validation. Model performance was assessed using area under the receiver operating characteristic curve (AUC), accuracy, precision, recall, F1-score, and Matthew’s correlation coefficient (MCC). The Random Forest prediction output was subsequently linked with FAERS 2026 first-quarter drug and reaction files. Drug records were matched using normalized drug names and active ingredients, and CNS-related reactions were identified using a predefined keyword-based screening approach. The reporting odds ratio (ROR) was calculated to compare CNS-related adverse-event reporting between predicted BBB-positive and BBB-negative groups. Results: Hydrogen-bond donors showed the highest Information Gain value, followed by topological polar surface area and hydrogen-bond acceptors. Random Forest demonstrated the strongest overall cross-validation performance, with an AUC of 0.874, accuracy of 86.9%, F1-score of 0.863, precision of 0.863, recall of 0.869, and MCC of 0.613. The Random Forest prediction-output confusion matrix contained 297 true negatives, 182 false positives, 86 false negatives, and 1,474 true positives. In the exploratory FAERS analysis, 61,022 unique cases involving matched primary or secondary suspect drug records were evaluated. CNS-related adverse events were identified in 26.99% of cases involving predicted BBB-positive compounds and 18.54% of cases involving predicted BBB-negative compounds. The reporting odds ratio was 1.625, with a 95% confidence interval of 1.561-1.691. Conclusion: Molecular descriptors can provide useful information for preliminary BBB penetration prediction. Random Forest showed the best overall model performance and may be useful for computational compound prioritization. The FAERS analysis suggested higher reporting odds of CNS-related adverse events among cases involving predicted BBB-positive compounds. However, the pharmacovigilance findings are exploratory and should not be interpreted as evidence of causality or true adverse-event incidence. Further validation using independent datasets, standardized drug mapping, validated adverse-event terminology, and experimental BBB studies is required.
The blood–brain barrier (BBB) is a specialized physiological interface formed mainly by brain microvascular endothelial cells, tight junctions, pericytes, astrocytic end-feet, and associated cellular structures. It maintains the biochemical environment required for normal neuronal function while restricting the entry of potentially harmful substances into the central nervous system. This protective function is essential for brain homeostasis, but it also limits the delivery of many therapeutic molecules to the brain.[1]
The ability of a drug to cross the BBB is influenced by several physicochemical and structural properties, including molecular size, lipophilicity, hydrogen-bonding capacity, polar surface area, molecular flexibility, ionization, and interactions with influx and efflux transporters.[2] Although smaller and moderately lipophilic molecules may show better passive diffusion, BBB penetration cannot be predicted reliably using a single molecular property because active transport and efflux mechanisms may substantially affect the final distribution of a compound.
Experimental assessment of BBB permeability may involve in vitro cell-based models, artificial membrane assays, in vivo animal studies, or specialized brain-to-plasma distribution studies. These methods can provide valuable information, but they may be time-consuming, expensive, and unsuitable for screening very large numbers of compounds. Computational methods therefore provide a useful complementary approach for early-stage compound evaluation.
Quantitative structure–activity relationship and quantitative structure–property relationship methods have traditionally been used to associate molecular features with biological or physicochemical properties.[3] Machine-learning methods extend these approaches by identifying complex and nonlinear relationships among multiple molecular descriptors. Several public BBB datasets have been developed and used as benchmark datasets for molecular machine-learning studies.[4,5]
The BBBP dataset contains more than 2,000 compounds with binary BBB permeability labels. It has been widely used to evaluate computational approaches for BBB prediction. However, model performance may be influenced by the chemical composition of the dataset, class imbalance, similarity between training and test compounds, descriptor selection, and the absence of independent external validation.
In addition to predicting BBB penetration, computational BBB classification may be useful for exploratory pharmacovigilance research. Drugs capable of reaching the central nervous system may potentially produce neurological or psychiatric adverse effects. The FDA Adverse Event Reporting System, now being incorporated into the FDA Adverse Event Monitoring System, contains spontaneous reports of suspected adverse events associated with medical products. The quarterly files include demographic, drug, reaction, outcome, and report-source information. However, these reports do not establish causality, cannot be used to calculate adverse-event incidence, and may contain duplicate or incomplete information.[6]
The present study therefore had two related objectives:
2. MATERIALS AND METHODS
2.1 Study design
The study was performed in two stages. In the first stage, machine-learning models were developed and compared using molecular descriptors and binary BBB classification labels. In the second stage, the selected Random Forest prediction output was linked with FAERS data to explore the relationship between predicted BBB penetration and CNS-related adverse-event reporting.
The overall workflow consisted of dataset preparation, molecular descriptor selection, preprocessing, feature ranking, model development, cross-validation, compound-level prediction, FAERS drug-record matching, CNS-related adverse-event screening, and reporting odds ratio analysis.
2.2 BBBP dataset
A BBBP dataset containing 2,039 compounds was used for model development. Each compound was associated with a molecular structure and a binary BBB classification label.
The target variable was designated as BBB_Label and consisted of two classes:
The BBB labels were treated as dataset-derived classifications rather than absolute evidence of BBB penetration for every compound.
2.3 Molecular descriptors
Twelve molecular descriptors were used as predictive variables:
Table 1. Molecular descriptors used for BBB penetration prediction
|
No. |
Molecular Descriptor |
Description |
|
1 |
Molecular Weight |
Molecular size/mass |
|
2 |
LogP |
Lipophilicity |
|
3 |
HBD |
Hydrogen-bond donating capacity |
|
4 |
HBA |
Hydrogen-bond accepting capacity |
|
5 |
Rotatable Bonds |
Molecular flexibility |
|
6 |
Heavy Atom Count |
Number of non-hydrogen atoms |
|
7 |
Ring Count |
Total number of rings |
|
8 |
Aromatic Ring Count |
Number of aromatic rings |
|
9 |
Fraction Csp3 |
Fraction of sp3-hybridized carbon atoms |
|
10 |
Formal Charge |
Net formal charge |
|
11 |
Labute ASA |
Accessible surface area |
|
12 |
TPSA |
Topological polar surface area |
These descriptors represent different molecular characteristics related to size, lipophilicity, polarity, hydrogen-bonding capacity, molecular flexibility, and molecular structure.
2.4 Data Preprocessing
The dataset was imported into Orange Data Mining software. The molecular descriptors were used as explanatory variables, while BBB_Label was defined as the target variable.
The dataset was checked for the presence of the required target variable and molecular descriptor values before analysis. The preprocessing workflow was connected to the model-evaluation workflow so that preprocessing could be applied consistently during model evaluation.
2.5 Feature Ranking
Feature ranking was performed using the Information Gain criterion. Information Gain estimates how much information a descriptor provides about the target class. A higher Information Gain value indicates that the descriptor provides greater information for distinguishing between BBB− and BBB+ compounds within the analyzed dataset.
2.6 Machine-Learning Algorithms
Four supervised classification algorithms were evaluated:
2.6.1 Logistic Regression
Logistic Regression was used as a conventional linear classification model. It provides a baseline approach for binary classification and estimates the probability of belonging to a target class based on the predictor variables.
2.6.2 Random Forest
Random Forest is an ensemble learning method consisting of multiple decision trees. The ensemble approach allows nonlinear relationships between molecular descriptors and BBB classification to be modeled and can provide robust classification performance for heterogeneous molecular datasets.[7]
2.6.3 Support Vector Machine
Support Vector Machine (SVM) was used as a margin-based classifier capable of identifying decision boundaries between BBB− and BBB+ compounds.[8]
2.6.4 k-Nearest Neighbors
The k-Nearest Neighbors (kNN) algorithm classified compounds according to the characteristics of neighboring observations within the descriptor space.
2.7 Model Validation
The four models were evaluated using 5-fold stratified cross-validation. The dataset was divided into five subsets, with approximately four subsets used for model training and one subset used for validation in each iteration. Stratification was applied to maintain the distribution of BBB− and BBB+ classes across the folds.
The same validation procedure was used for all four models to support a direct comparison of their performance.
2.8 Model Performance Evaluation
The following performance measures were used:
The confusion matrix was used to determine:
The ROC curve was used to assess the ability of each model to discriminate between BBB− and BBB+ compounds. Calibration analysis was also performed to examine the relationship between predicted probabilities and observed classifications.[10]
2.9 Compound-level prediction
The Orange Predictions widget was used to generate compound-level predictions from all four classifiers. The Random Forest output included the predicted BBB class and predicted probabilities for the BBB− and BBB+ classes.
The Random Forest predictions were used for the subsequent FAERS analysis because Random Forest demonstrated the strongest overall cross-validation performance.
2.10 FAERS data source
FAERS/AEMS quarterly data for January–March 2026 were used for the exploratory pharmacovigilance analysis. The drug and reaction files were used in the present study.
The FAERS quarterly files contain raw case-report information, including drug information, reaction information, demographic information, outcome information, and report-source information. The files are spontaneous-reporting data and should be interpreted as a source for signal detection rather than as a source of confirmed causal relationships or incidence estimates.[6]
2.11 Drug-name matching
The compound names from the BBBP prediction dataset were normalized before matching. Normalization included conversion to lowercase, removal of punctuation and special characters, and removal of unnecessary spaces.
FAERS drug records were matched with BBBP compounds using normalized drug names and active ingredients. Because drug names may be reported using brand names, generic names, salts, combinations, abbreviations, or alternative spellings, the matching process was considered an exploratory name-based approach.
2.12 Selection of suspect-drug records
For the primary analysis, FAERS records in which the matched drug was listed as either a primary suspect drug or a secondary suspect drug were retained. Concomitant and interacting drug records were not included in the primary suspect-drug analysis.
2.13 Linking drug and reaction records
Drug and reaction records were linked using the available FAERS case identifiers. Repeated reaction terms belonging to the same case were consolidated for case-level analysis.
Each case was counted once within each BBB prediction group to reduce the effect of multiple reaction entries from the same report.
2.14 Identification of CNS-related adverse events
CNS-related adverse events were identified using a predefined keyword-based screening method. The screening terms included reaction terms associated with dizziness, headache, somnolence, sedation, confusion, delirium, seizure, convulsion, hallucination, tremor, ataxia, dyskinesia, vertigo, syncope, agitation, insomnia, memory disturbance, cognitive disturbance, loss of consciousness, coma, encephalopathy, paresthesia, hypoesthesia, anxiety, depression, suicidal ideation, psychosis, akathisia, extrapyramidal disorder, and neuropathy.
This keyword-based method was used for exploratory screening and was not considered equivalent to a fully validated MedDRA-based classification system.
2.15 Reporting odds ratio analysis[11,12]
|
|
CNS-related event |
No-CNS related event |
|
Predicted BBB+ |
a |
b |
|
Predicted BBB- |
c |
d |
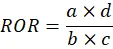
The reporting odds ratio was calculated using:
ROR=a×db×c
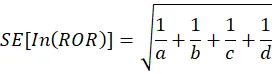
The standard error of the natural logarithm of the ROR was calculated as:
SE[InROR]=1a+1b+1c+1d
The 95% confidence interval was calculated as:
95%CI=eIn(ROR)±1.96×SE[InROR]

2.16 Software
The machine-learning workflow was developed using Orange Data Mining software. Data processing and statistical calculations for the FAERS analysis were performed using computational data-processing tools.[9]
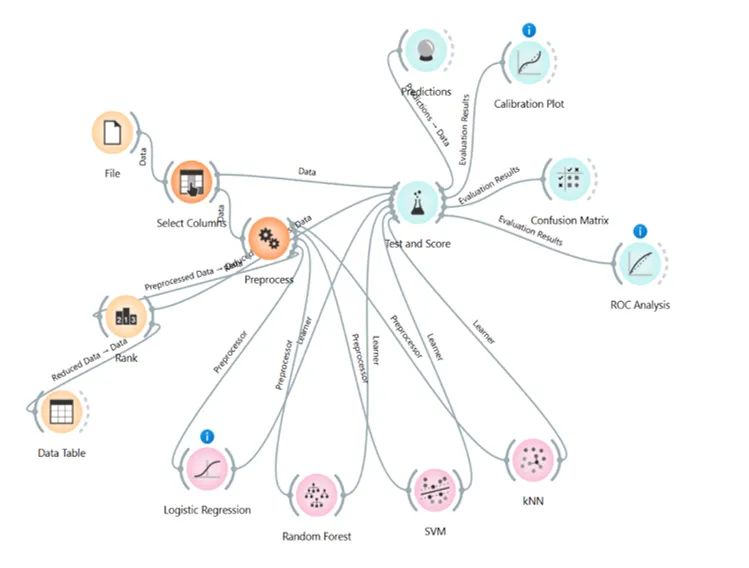
Figure 1. Machine-learning workflow for prediction of blood–brain barrier penetration using molecular descriptors in Orange Data Mining.
3. RESULTS
3.1 Molecular Descriptor Ranking
Information Gain analysis identified hydrogen-bond donors as the most informative descriptor, followed by topological polar surface area and hydrogen-bond acceptors.
Table 2. Information Gain ranking
|
Rank |
Descriptor |
Information gain |
|
1 |
HBD |
0.175 |
|
2 |
TPSA |
0.170 |
|
3 |
HBA |
0.106 |
|
4 |
Molecular Weight |
0.071 |
|
5 |
LogP |
0.070 |
|
6 |
Labute ASA |
0.053 |
|
7 |
Heavy Atom Count |
0.052 |
|
8 |
Rotatable Bonds |
0.027 |
|
9 |
Aromatic Ring Count |
0.008 |
|
10 |
Ring Count |
0.006 |
|
11 |
Fraction Csp3 |
0.005 |
|
12 |
Formal Charge |
0.002 |
Hydrogen-bond donors had the highest Information Gain value of 0.175, followed by topological polar surface area at 0.170 and hydrogen-bond acceptors at 0.106. Molecular weight and LogP showed moderate information contribution, whereas aromatic ring count, ring count, fraction Csp3, and formal charge showed relatively lower Information Gain values.
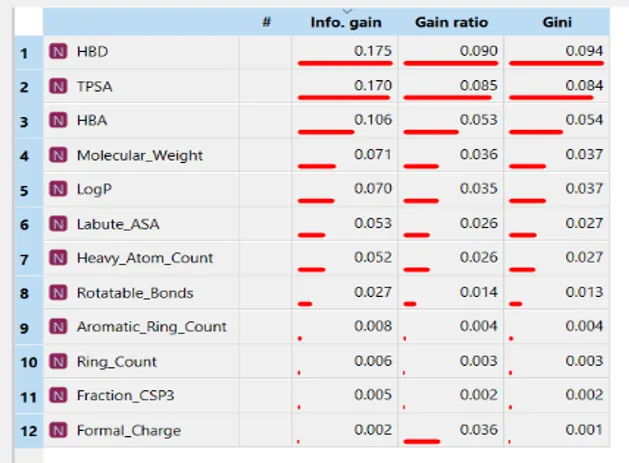
Figure 2. Information Gain ranking of molecular descriptors used for prediction of blood–brain barrier penetration.
3.2 Comparative Machine-Learning Performance
All four classifiers successfully generated BBB classification predictions.
Table 3. Comparative performance of machine-learning models
|
Model |
AUC |
Accuracy |
F1-score |
Precision |
Recall |
MCC |
|
Logistic Regression |
0.841 |
84.0% |
0.823 |
0.832 |
0.840 |
0.505 |
|
Random Forest |
0.874 |
86.9% |
0.863 |
0.863 |
0.869 |
0.613 |
|
SVM |
0.765 |
80.7% |
0.791 |
0.790 |
0.807 |
0.402 |
|
kNN |
0.787 |
81.9% |
0.807 |
0.806 |
0.819 |
0.449 |
Random Forest showed the highest performance across all reported evaluation measures. It achieved an AUC of 0.874 and an accuracy of 86.9%. Its F1-score and MCC were also higher than those of the other evaluated models.
3.3 Confusion Matrix of the Random Forest Model
The confusion matrix of Random Forest contained:
Table 4. Random Forest confusion matrix
|
Actual class |
Predicted BBB− |
Predicted BBB+ |
|
BBB− (0) |
297 |
182 |
|
BBB+ (1) |
86 |
1474 |
Thus:
The model correctly classified 1,771 of 2,039 compounds.
For the BBB+ class, the calculated sensitivity/recall was approximately 94.5%, while precision was approximately 89.0%. Specificity was approximately 62.0%.
These results indicate that the Random Forest model was particularly effective at identifying BBB-penetrating compounds, although some BBB− compounds were incorrectly classified as BBB+.
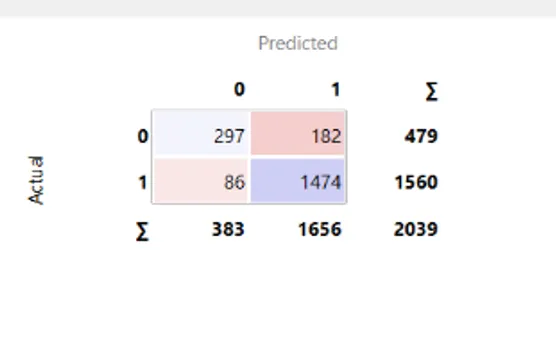
Figure 3. Confusion matrix of the Random Forest model for classification of BBB− and BBB+ compounds.
3.4 ROC Analysis
ROC analysis demonstrated that Random Forest had the highest AUC among the four classifiers.
The AUC ranking was:
The ROC analysis therefore supported the selection of Random Forest as the best-performing classifier
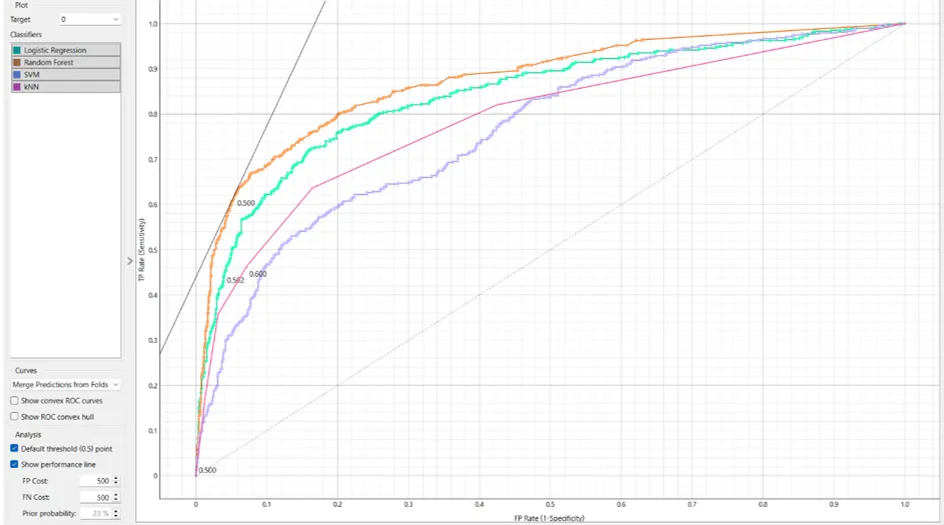
Figure 4. Receiver operating characteristic curves for Logistic Regression, Random Forest, Support Vector Machine, and k-Nearest Neighbors models.
3.5 Calibration Analysis
Calibration analysis was performed to examine the relationship between predicted probabilities and observed BBB classifications.
The calibration curves provided an additional assessment of the reliability of model-generated probabilities. The calibration results were interpreted together with discrimination and classification measures rather than being used as the sole criterion for model selection.
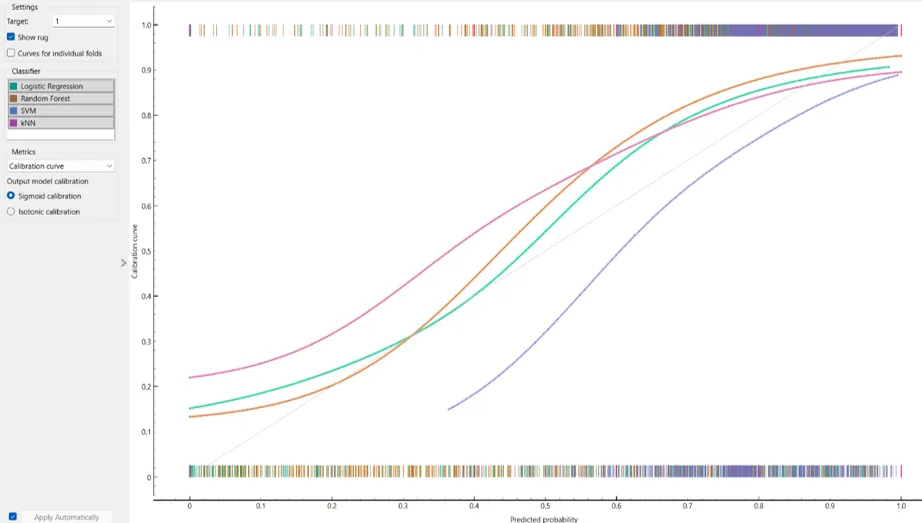
Figure 5. Calibration curves of the evaluated machine-learning models for BBB penetration prediction.
3.6 Compound-level prediction analysis
The Orange Predictions widget was used to generate individual compound-level predictions from Logistic Regression, Random Forest, SVM, and kNN.
The Random Forest output included the predicted BBB class and predicted probabilities for the BBB− and BBB+ classes. The final Random Forest prediction output contained 2,039 compounds. These predictions were used to divide the compounds into predicted BBB-positive and predicted BBB-negative groups for the exploratory FAERS analysis
3.7 FAERS drug-record matching
The matched BBBP prediction data were linked with the FAERS 2026 first-quarter drug records. After normalized matching of drug names and active ingredients, 402,999 FAERS drug records were identified.
Among the matched records, 192,759 records represented primary or secondary suspect drugs. These records corresponded to 61,022 unique FAERS cases after case-level consolidation.
Table 5. FAERS matching summary
|
Parameter |
Number |
|
Matched FAERS drug records |
402,999 |
|
Primary/secondary suspect drug records |
192,759 |
|
Unique cases after suspect-drug filtering |
61,022 |
|
Cases involving predicted BBB+ compounds |
48,014 |
|
Cases involving predicted BBB− compounds |
21,670 |
3.8 CNS-related adverse-event analysis
CNS-related reactions were identified using the predefined keyword-based screening approach. The analysis included neurological and psychiatric reaction terms such as dizziness, headache, somnolence, sedation, confusion, seizures, hallucination, tremor, vertigo, anxiety, depression, and neuropathy.
Table 6. CNS-related adverse-event reporting according to predicted BBB class
|
Predicted BBB group |
Total cases |
CNS-related cases |
Non-CNS cases |
CNS-related cases (%) |
|
Predicted BBB+ |
48,014 |
12,960 |
35,054 |
26.99 |
|
Predicted BBB- |
21,670 |
4,017 |
17,653 |
18.54 |
CNS-related adverse events were identified in 12,960 cases involving predicted BBB-positive compounds, corresponding to 26.99% of the group. In the predicted BBB-negative group, 4,017 cases contained CNS-related reactions, corresponding to 18.54%.
The proportion of CNS-related adverse-event reports was therefore higher in the predicted BBB-positive group than in the predicted BBB-negative group.
3.9 Reporting odds ratio
The reporting odds ratio for CNS-related adverse events was 1.625, with a 95% confidence interval of 1.561–1.691.
Table 7. Reporting odds ratio for CNS-related adverse events
|
Measure |
Value |
|
Reporting odds ratio |
1.625 |
|
Lower 95% confidence limit |
1.561 |
|
Upper 95% confidence limit |
1.691 |
|
Interpretation |
Higher reporting odds in the predicted BBB+ group |
The result suggests that CNS-related adverse events were reported approximately 1.62 times more frequently, in reporting-odds terms, among cases involving predicted BBB-positive compounds compared with predicted BBB-negative compounds.
4. DISCUSSION
The present study evaluated four machine-learning approaches for predicting BBB penetration using twelve molecular descriptors. The models were developed using a consistent preprocessing and 5-fold stratified cross-validation workflow in Orange Data Mining. Random Forest demonstrated the strongest overall performance, with the highest AUC, accuracy, F1-score, precision, recall, and MCC among the evaluated models.
The stronger performance of Random Forest may be related to its ability to model nonlinear relationships and interactions among molecular descriptors. BBB penetration is not controlled by a single molecular property. Instead, several properties, including molecular size, lipophilicity, polarity, hydrogen bonding, flexibility, ionization, and transporter interactions, may influence whether a compound reaches the central nervous system.
The descriptor-ranking analysis identified hydrogen-bond donors, topological polar surface area, and hydrogen-bond acceptors as the three highest-ranked descriptors. This finding is chemically reasonable because hydrogen bonding and molecular polarity can influence the ability of a compound to partition into biological membranes. Molecules with high polarity and extensive hydrogen-bonding capacity may show reduced passive diffusion across lipid-rich biological barriers.
However, the Information Gain ranking should not be interpreted as proof that these descriptors independently determine BBB penetration. The descriptors may be correlated with one another, and BBB transport may also depend on active influx, active efflux, plasma protein binding, ionization state, and tissue distribution. In addition, the BBBP labels may represent combined experimental outcomes rather than a single mechanistic transport process.
Random Forest showed a high recall for the BBB+ class in the prediction-output confusion matrix. This may be useful in an early screening setting where the objective is to avoid excluding compounds that could potentially reach the CNS. However, the specificity was lower than the sensitivity, indicating that some BBB− compounds were incorrectly classified as BBB+. Consequently, the model should be used as a prioritization tool rather than as definitive evidence of BBB penetration.
The model-performance results should also be interpreted in the context of the dataset. Public BBB datasets are valuable for benchmarking, but they may not fully represent the chemical diversity of compounds encountered in drug-discovery programs. Similar compounds may be present in both training and validation subsets, which can lead to optimistic estimates of performance. The use of an independent external dataset would provide a stronger assessment of model generalizability.
The secondary FAERS analysis explored whether predicted BBB penetration was associated with CNS-related adverse-event reporting. The proportion of CNS-related reports was higher among cases involving predicted BBB-positive compounds than among cases involving predicted BBB-negative compounds. The ROR of 1.625 further suggested an association between predicted BBB penetration and CNS-related adverse-event reporting.
One possible explanation is that compounds with a greater probability of reaching the CNS may have a higher opportunity to influence central neuronal pathways. Such compounds may therefore be more likely to be associated with adverse events involving sedation, dizziness, confusion, seizures, hallucinations, sleep disturbances, or other neurological and psychiatric symptoms. However, this explanation remains hypothetical and cannot be confirmed using the present analysis.
Several important limitations must be considered. First, FAERS is a spontaneous-reporting database. A report does not establish that the suspected product caused the event. The reported reaction may be related to the underlying disease, another medication, an interaction, or another clinical factor. FAERS data also cannot be used to calculate the incidence of adverse events because the database does not contain a reliable denominator representing the number of exposed patients.
Second, FAERS reports may be incomplete, duplicated, or affected by reporting stimulated by publicity. Reporting practices may differ according to the age of the product, severity of the event, country, clinical setting, and public awareness. The number of reports should therefore not be interpreted as the number of affected patients or as a direct measure of drug safety.
Third, the present analysis used normalized drug-name and active-ingredient matching. Although this approach allowed a large number of records to be linked, it may produce false-positive matches or fail to identify records reported under alternative names, combination products, salts, or spelling variations.
Fourth, CNS-related adverse events were identified using keyword-based screening. This method is transparent and practical for preliminary analysis, but it is less reliable than a validated MedDRA preferred-term or standardized medical-dictionary approach. Some keywords may be too broad, while other clinically relevant CNS terms may not be captured.
Fifth, the FAERS analysis did not adjust for important confounding factors such as age, sex, indication, dose, route of administration, treatment duration, disease severity, concomitant medicines, or the duration of drug exposure. These factors may influence both BBB classification and adverse-event reporting.
Finally, the FAERS analysis was based on predicted BBB classes rather than experimentally confirmed BBB permeability measurements. Misclassification by the machine-learning model may therefore influence the observed association. The ROR should be viewed as a hypothesis-generating result that requires replication in larger and independently processed datasets.
5. CONCLUSION
The present study developed and compared four machine-learning models for BBB penetration prediction using twelve molecular descriptors. Information Gain analysis identified hydrogen-bond donors, topological polar surface area, and hydrogen-bond acceptors as the most informative descriptors in the analyzed dataset.
Random Forest demonstrated the strongest overall cross-validation performance, with an AUC of 0.874, accuracy of 86.9%, F1-score of 0.863, precision of 0.863, recall of 0.869, and MCC of 0.613. The model was therefore selected for compound-level BBB prediction.
The predicted BBB classes were subsequently linked with FAERS data to explore the relationship between predicted BBB penetration and CNS-related adverse-event reporting. CNS-related adverse events were more frequently observed among cases involving predicted BBB-positive compounds, and the reporting odds ratio suggested higher reporting odds in this group.
The findings indicate that machine-learning-based BBB prediction may be useful for preliminary compound prioritization and exploratory CNS safety assessment. Nevertheless, the FAERS results do not establish causality or true adverse-event incidence. Further research should include external model validation, standardized drug-name mapping, validated MedDRA-based adverse-event classification, adjustment for confounding factors, replication using multiple FAERS quarters, and experimental confirmation of BBB permeability.
6. DATA AND SOFTWARE AVAILABILITY
The BBB molecular dataset used in this study contained 2,039 compounds with BBB classification labels and molecular descriptors. The machine-learning workflow was developed using Orange Data Mining software. The Orange workflow file and compound-level prediction output can be retained as supplementary material to support reproducibility.
The FAERS/AEMS quarterly data files are publicly available through the FDA website. The quarterly files are raw data extracts and require appropriate data-processing procedures before analysis.
7. DECLARATIONS
Ethics statement
The study used publicly available, de-identified FAERS/AEMS data and did not involve direct contact with human participants. No individually identifiable patient information was used.
Conflict of interest
The authors declare that they have no conflict of interest.
Funding
No external funding was received for this study.
REFERENCES




Mukthiyar Ahamed, Deeksha V, Vennela SV, Thanushree B, In Silico Prediction of Blood–Brain Barrier Penetration Using Molecular Descriptors and Machine Learning: An Exploratory Integration with FAERS Pharmacovigilance Data, Int. J. of Pharm. Sci., 2026, Vol 4, Issue 9, 1677-1690. https://doi.org/10.5281/zenodo.22742641
 10.5281/zenodo.22742641