

We use cookies to ensure our website works properly and to personalise your experience. Cookies policy
1Research Scholar of Rawatpura Sarkar Institute of Pharmacy, Jabalpur (M.P.
2Principal and Associate Professor of Rawatpura Sarkar Institute of Pharmacy, Jabalpur (M.P.
3Assistant Professor of Rawatpura Sarkar Institute of Pharmacy, Jabalpur (M.P.
4Lecturer Shri K.R. Pandav Institute of Pharmacy.
Collagenase (matrix metalloproteinase-1, MMP-1) and elastase drive the degradation of dermal collagen and elastin and are validated targets for anti-ageing cosmeceuticals. Moringa oleifera leaf extract inhibits both enzymes, but the contribution of its individual constituents has not been profiled on a common computational footing. We assembled a panel of twelve compounds ten M. oleifera leaf constituents (quercetin, kaempferol, gallic acid, chlorogenic acid, caffeic acid, ferulic acid, quinic acid, rutin, isoquercitrin, astragalin) and two reference inhibitors (EGCG, ascorbic acid) and evaluated them in a four-tier workflow: (i) RDKit-based physicochemical descriptors with Lipinski, Veber and BOILED-Egg-type classification; (ii) SMARTS-based pharmacophore feature analysis and Morgan-fingerprint similarity, combined into a pharmacophore–similarity score (PSS); (iii) structure-based molecular docking against collagenase (PDB 1CGL) and elastase (PDB 1U4G); and (iv) 100 ns all-atom molecular dynamics (GROMACS) of the top-ranked MMP-1 complexes against the EGCG reference. Seven of twelve compounds showed no Lipinski violations; the flavonol O-glycosides and EGCG were predicted to have low gastrointestinal absorption. Chlorogenic acid ranked first among native constituents by PSS (10.00) and was the best-scoring ligand at elastase (?8.93 kcal/mol), ahead of quercetin (?7.74 kcal/mol) and the ascorbic acid reference (?6.52 kcal/mol); vicenin-2 scored ?6.52 kcal/mol at collagenase against ?5.96 kcal/mol for EGCG. All four simulated complexes remained stable (backbone RMSD 0.21–0.27 nm, Rg ? 2.30 nm, SASA ? 200 nm2), with quercetin forming the most persistent hydrogen bonds.
Skin ageing is a combination of intrinsic (chronological) and extrinsic, largely UV-driven, processes that converge on progressive degradation of the dermal extracellular matrix, whose main structural components are type-I collagen and elastin [1–3]. UV-generated reactive oxygen species activate MAPK signalling and the transcription factor AP-1, which up-regulates MMP-1, MMP-3 and MMP-9 and suppresses TGF-β/Smad-dependent procollagen synthesis; recruited neutrophils additionally release elastase [4]. Because MMP-1 performs the rate-limiting cleavage of the collagen triple helix and elastin is not efficiently re-synthesised in adult skin, direct inhibition of collagenase and elastase is an attractive effector-level strategy that acts regardless of the upstream trigger.
Moringa oleifera Lam. (Moringaceae) leaves are rich in flavonol glycosides and aglycones (quercetin, kaempferol and their 3-O-glycosides), hydroxycinnamoyl-quinic acids (chlorogenic and neochlorogenic acids), flavone C-glycosides (vicenin-2) and glucosinolate-derived compounds [5–7]. Skin-relevant activities have been reported, including improved facial hydration and elasticity from a leaf-extract cream [8], extended lifespan and stress tolerance in Caenorhabditis elegans [9], and wound-healing activity of seed extract [10]; reviews note that direct anti-collagenase and anti-elastase evidence was sparse [11]. Xu et al. subsequently showed that ethanolic leaf extract inhibits collagenase (IC50 355.58 ± 17.11 µg/mL) and elastase (253.95 ± 10.30 µg/mL) and, using affinity ultrafiltration LC-MS and AutoDock Vina docking, identified 4-caffeoylquinic (chlorogenic) acid as the highest-affinity ligand [12].
That study, however, examined a small set of ligands and relied on docking alone. A broader comparison of the principal leaf constituents under a uniform, reproducible and open-source pipeline covering target-binding plausibility, dynamic stability of the bound complex, and oral/topical drug-likeness, which is strongly penalised by glycosylation has not been reported. Here we profile twelve compounds using descriptor-based ADMET filters [13–15], SMARTS-based pharmacophore analysis and fingerprint similarity; dock the leaf constituents and reference inhibitors against collagenase (PDB 1CGL) and elastase (PDB 1U4G) with AutoDock Vina 1.2.7 [16–18]; and carry the top-ranked ligands forward into 100 ns molecular dynamics simulations to test whether the docked complexes remain stable. The overall workflow is shown in Fig. 1.
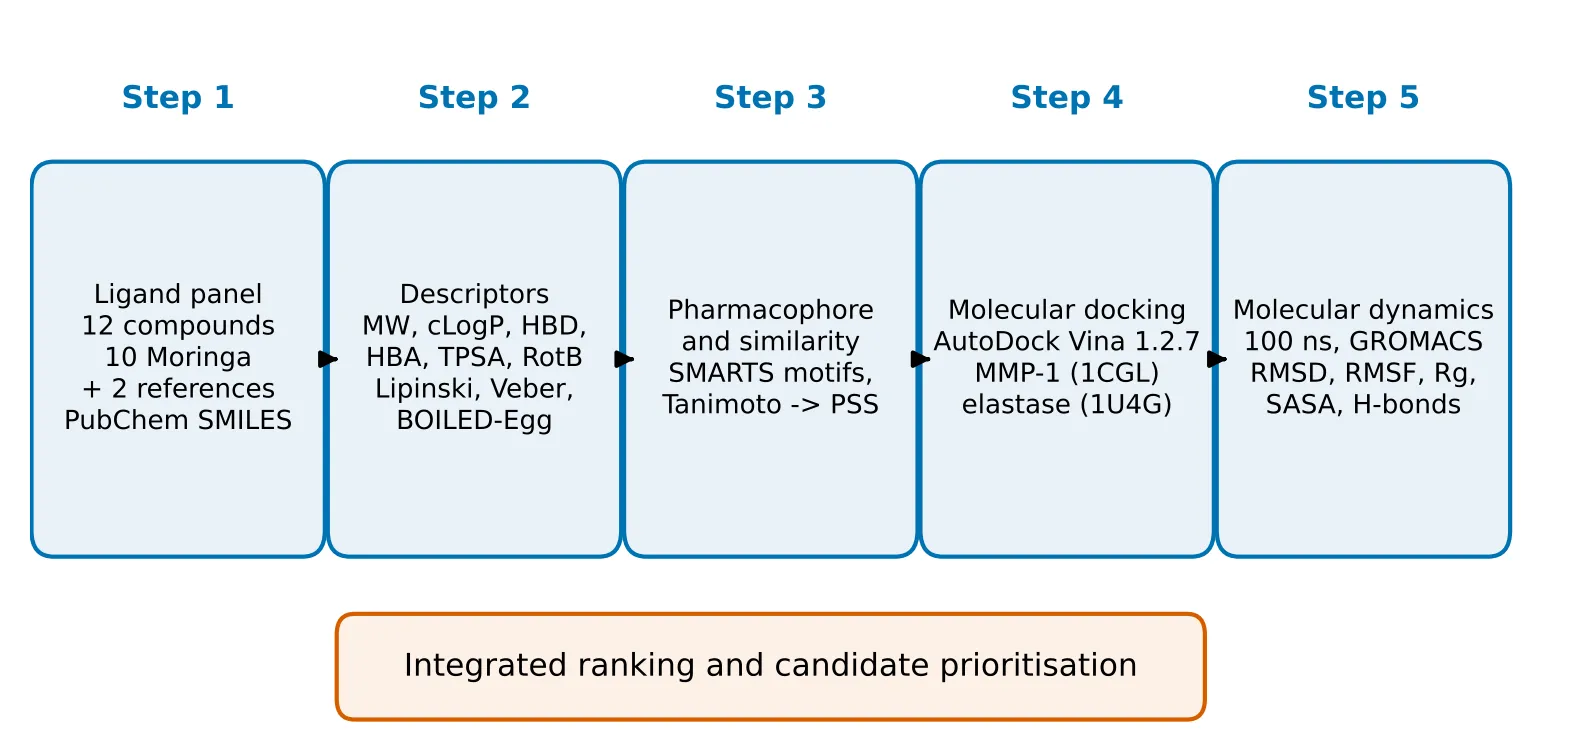
Figure 1: Overview of the Integrated in Silico Workflow We Adopted in This Study.
MATERIALS AND METHODS
2.1 Compound panel and structure preparation
Twelve compounds were selected (Table 1): ten constituents reported from M. oleifera leaves quercetin, kaempferol, gallic acid, chlorogenic acid (4-caffeoylquinic acid), caffeic acid, ferulic acid, quinic acid, rutin, isoquercitrin and astragalin and two reference compounds, epigallocatechin gallate (EGCG; collagenase) and ascorbic acid (elastase), which are not native Moringa constituents. Canonical SMILES were retrieved from PubChem [19], checked against molecular formula and weight, sanitised in RDKit, and are listed in Supplementary Table S1. Two-dimensional depictions were generated with RDKit (Fig. 2). For docking, 3D coordinates were generated from the verified SMILES with Open Babel [20], protonated at pH 7.4, minimised with the MMFF94 force field, assigned Gasteiger charges and converted to PDBQT format, leaving all non-amide, non-ring rotatable bonds free. The docked set comprised the leaf constituents chlorogenic acid and quercetin, the reported Moringa constituents vicenin-2 and N-fructosyl pyroglutamate, sucrose as a low-affinity sugar comparator, and the reference compounds ascorbic acid and EGCG.
Table 1: Compounds Screened in This Study.
| No. | Compound | Structural class | Role / source |
|---|---|---|---|
| 1 | Quercetin | Flavonol (aglycone) | Moringa leaf; aglycone of isoquercitrin and rutin |
| 2 | Kaempferol | Flavonol (aglycone) | Moringa leaf; aglycone of astragalin |
| 3 | Gallic acid | Simple phenolic acid | Moringa leaf, pods |
| 4 | Chlorogenic acid (4-caffeoylquinic acid) | Hydroxycinnamoyl-quinic acid ester | Moringa leaf; top ligand by affinity ultrafiltration [12] |
| 5 | Caffeic acid | Hydroxycinnamic acid | Moringa leaf; acyl donor of chlorogenic acid |
| 6 | Ferulic acid | Hydroxycinnamic acid | Moringa leaf, pods |
| 7 | Quinic acid | Cyclitol carboxylic acid | Moringa leaf; core of caffeoylquinic acids |
| 8 | Rutin (quercetin-3-O-rutinoside) | Flavonol O-glycoside | Moringa leaf |
| 9 | Isoquercitrin (quercetin-3-O-glucoside) | Flavonol O-glycoside | Moringa leaf |
| 10 | Astragalin (kaempferol-3-O-glucoside) | Flavonol O-glycoside | Moringa leaf |
| 11 | Ascorbic acid* | Sugar-acid lactone | Reference standard (elastase) |
| 12 | EGCG* | Flavan-3-ol gallate ester | Reference standard (collagenase) |
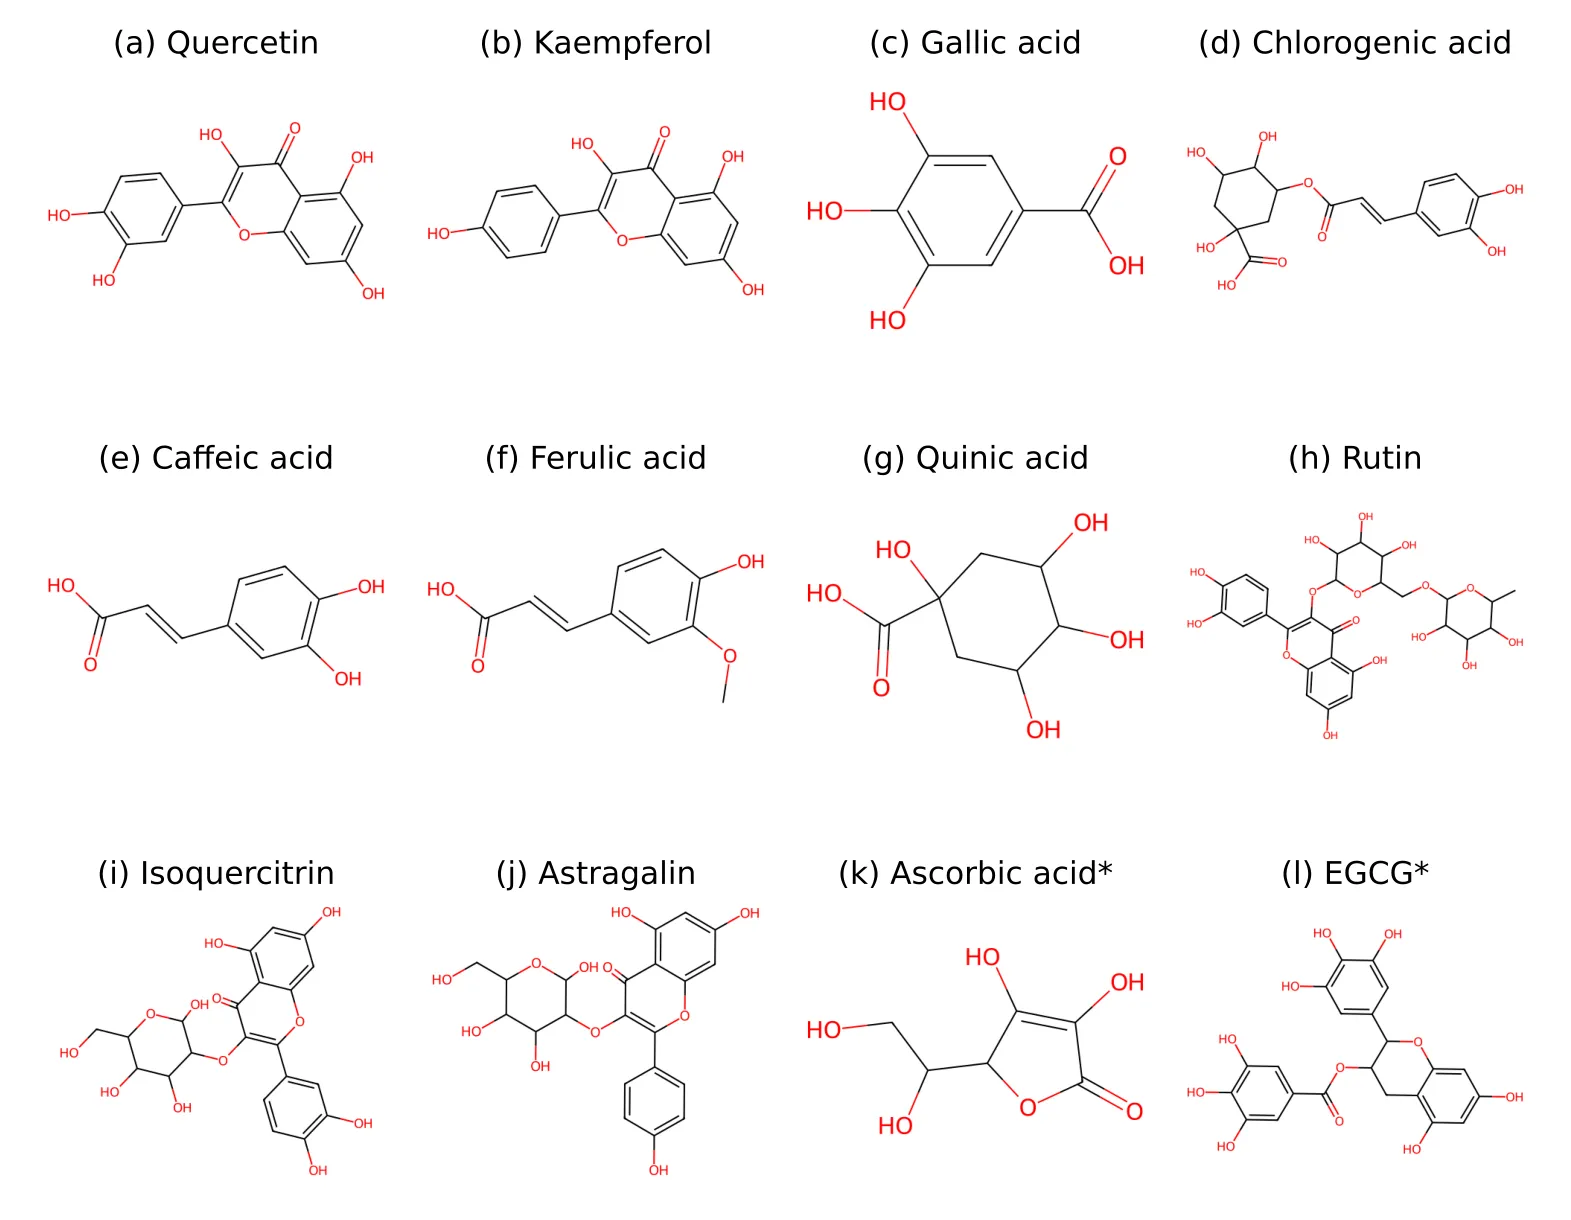
Figure 2: Two-dimensional Structures of the Twelve Screened Compounds: (A) Quercetin, (B) Kaempferol, (C) Gallic Acid, (D) Chlorogenic Acid, (E) Caffeic Acid, (F) Ferulic Acid, (G) Quinic Acid, (H) Rutin, (I) Isoquercitrin, (J) Astragalin, (K) Ascorbic Acid and (L) EGCG. Asterisks Denote Reference Standards.
2.2 Molecular descriptors and drug-likeness
Using RDKit, we computed molecular weight (MW), Wildman–Crippen cLogP, hydrogen-bond donors (HBD) and acceptors (HBA), topological polar surface area (TPSA), rotatable bonds and ring count. Lipinski violations were counted for MW > 500, cLogP > 5, HBD > 5 and HBA > 10 [13]; a compound was considered drug-like with ≤ 1 violation. Veber's criteria (TPSA ≤ 140 Å2, ≤ 10 rotatable bonds) were applied as a complementary filter [14]. Following the decision boundaries of the BOILED-Egg model [15,21], gastrointestinal (GI) absorption was predicted as high when TPSA ≤ 140 Å2, cLogP ≤ 5.88 and MW < 500, and blood–brain-barrier (BBB) permeation as likely when TPSA < 90 Å2, 0 < cLogP < 3 and MW < 450. The script is given in Supplementary Information.
2.3 Pharmacophore feature and fingerprint-similarity analysis
Four pharmacophoric features associated with collagenase/elastase engagement by polyphenols the catechol (ortho-dihydroxyphenyl) motif, the galloyl motif, a conjugated ester linkage and a free carboxylic acid together with the number of phenolic hydroxyl groups and a glycosidic-ring count (a bulk/permeability penalty) were identified by SMARTS substructure matching; methoxy oxygens were excluded from hydroxyl matches. Similarity of each compound to the two anchor actives, chlorogenic acid and EGCG, was computed as the Tanimoto coefficient of Morgan fingerprints (radius 2, 2048 bits). Feature and similarity terms were combined into an additive pharmacophore–similarity score (PSS), used solely as a relative ranking heuristic.
2.4 Molecular docking
Structure-based docking was performed with AutoDock Vina 1.2.7 [16,17] against the catalytic domain of human fibroblast collagenase (MMP-1; PDB 1CGL, 2.4 Å [18]) and elastase (PDB 1U4G), both retrieved from the RCSB Protein Data Bank [22]. Receptors were prepared by removing crystallographic waters, the co-crystallised inhibitor and non-essential heteroatoms, adding polar hydrogens and assigning Kollman charges; the catalytic zinc ion of MMP-1 was retained as the principal electrophilic anchor for hydroxamate- and catechol-type ligands. The search space was centred on the catalytic site of each enzyme. For each ligand–receptor pair the pose with the lowest predicted binding energy (most negative ΔG, kcal/mol) was retained. Binding energies were used to rank ligands within each enzyme and to select the complexes advanced to molecular dynamics. Scores from different enzymes were not compared directly, since the scoring function is not calibrated across receptors.
2.5 Molecular dynamics simulations
The top-ranked docked ligands chlorogenic acid and quercetin together with kaempferol, the non-catechol flavonol aglycone included as a structural comparator for quercetin (high drug-likeness), and the reference inhibitor EGCG were advanced to 100 ns MD as complexes with MMP-1 (PDB 1CGL), starting from their docked poses, using GROMACS 2024.4. The protein was parameterised with the CHARMM27 force field and ligand topologies were generated with SwissParam. Systems were solvated in TIP3P water and neutralised with Na+/Cl− at 0.15 M, energy-minimised, and equilibrated in NVT and NPT ensembles at 300 K and 1.01325 bar before unrestrained production runs under periodic boundary conditions. Trajectories were analysed for protein backbone RMSD, Cα RMSF, radius of gyration (Rg), solvent-accessible surface area (SASA) and protein–ligand hydrogen bonds using GROMACS tools, and visualised in VMD and Grace.
RESULTS AND DISCUSSION
3.1 Drug-likeness and predicted absorption
Table 2 and Fig. 3 summarise the descriptor profile. Seven of the twelve compounds (quercetin, kaempferol, gallic acid, caffeic acid, ferulic acid, quinic acid and ascorbic acid) had no Lipinski violations. Chlorogenic acid had a single violation (six hydrogen-bond donors) and a TPSA of 164.75 Å2, above the Veber limit, and was therefore predicted to have borderline-low GI absorption. The three flavonol O-glycosides and EGCG had two or more violations, driven by MW, HBD and HBA; rutin, the largest molecule (610.52 g/mol, TPSA 269.43 Å2), had three.
Table 2: RDKit-computed Descriptors, Lipinski Violations and Predicted GI Absorption.
| Compound | MW (g/mol) | cLogP | HBD | HBA | TPSA (Å2) | RotB | Rings | Lipinski violations | Predicted GI absorption |
|---|---|---|---|---|---|---|---|---|---|
| Quercetin | 302.24 | 1.99 | 5 | 7 | 131.36 | 1 | 3 | 0 | High |
| Kaempferol | 286.24 | 2.28 | 4 | 6 | 111.13 | 1 | 3 | 0 | High |
| Gallic acid | 170.12 | 0.50 | 4 | 4 | 97.99 | 1 | 1 | 0 | High |
| Chlorogenic acid | 354.31 | −0.65 | 6 | 8 | 164.75 | 4 | 2 | 1 | Low |
| Caffeic acid | 180.16 | 1.20 | 3 | 3 | 77.76 | 2 | 1 | 0 | High |
| Ferulic acid | 194.19 | 1.50 | 2 | 3 | 66.76 | 3 | 1 | 0 | High |
| Quinic acid | 192.17 | −2.32 | 5 | 5 | 118.22 | 1 | 1 | 0 | High |
| Rutin | 610.52 | −1.69 | 10 | 16 | 269.43 | 6 | 5 | 3 | Low |
| Isoquercitrin | 464.38 | −0.54 | 8 | 12 | 210.51 | 4 | 4 | 2 | Low |
| Astragalin | 448.38 | −0.24 | 7 | 11 | 190.28 | 4 | 4 | 2 | Low |
| Ascorbic acid* | 176.12 | −1.41 | 4 | 6 | 107.22 | 2 | 1 | 0 | High |
| EGCG* | 458.38 | 2.23 | 8 | 11 | 197.37 | 3 | 4 | 2 | Low |
MW, molecular weight; HBD/HBA, hydrogen-bond donors/acceptors; TPSA, topological polar surface area; RotB, rotatable bonds. *Reference standards.
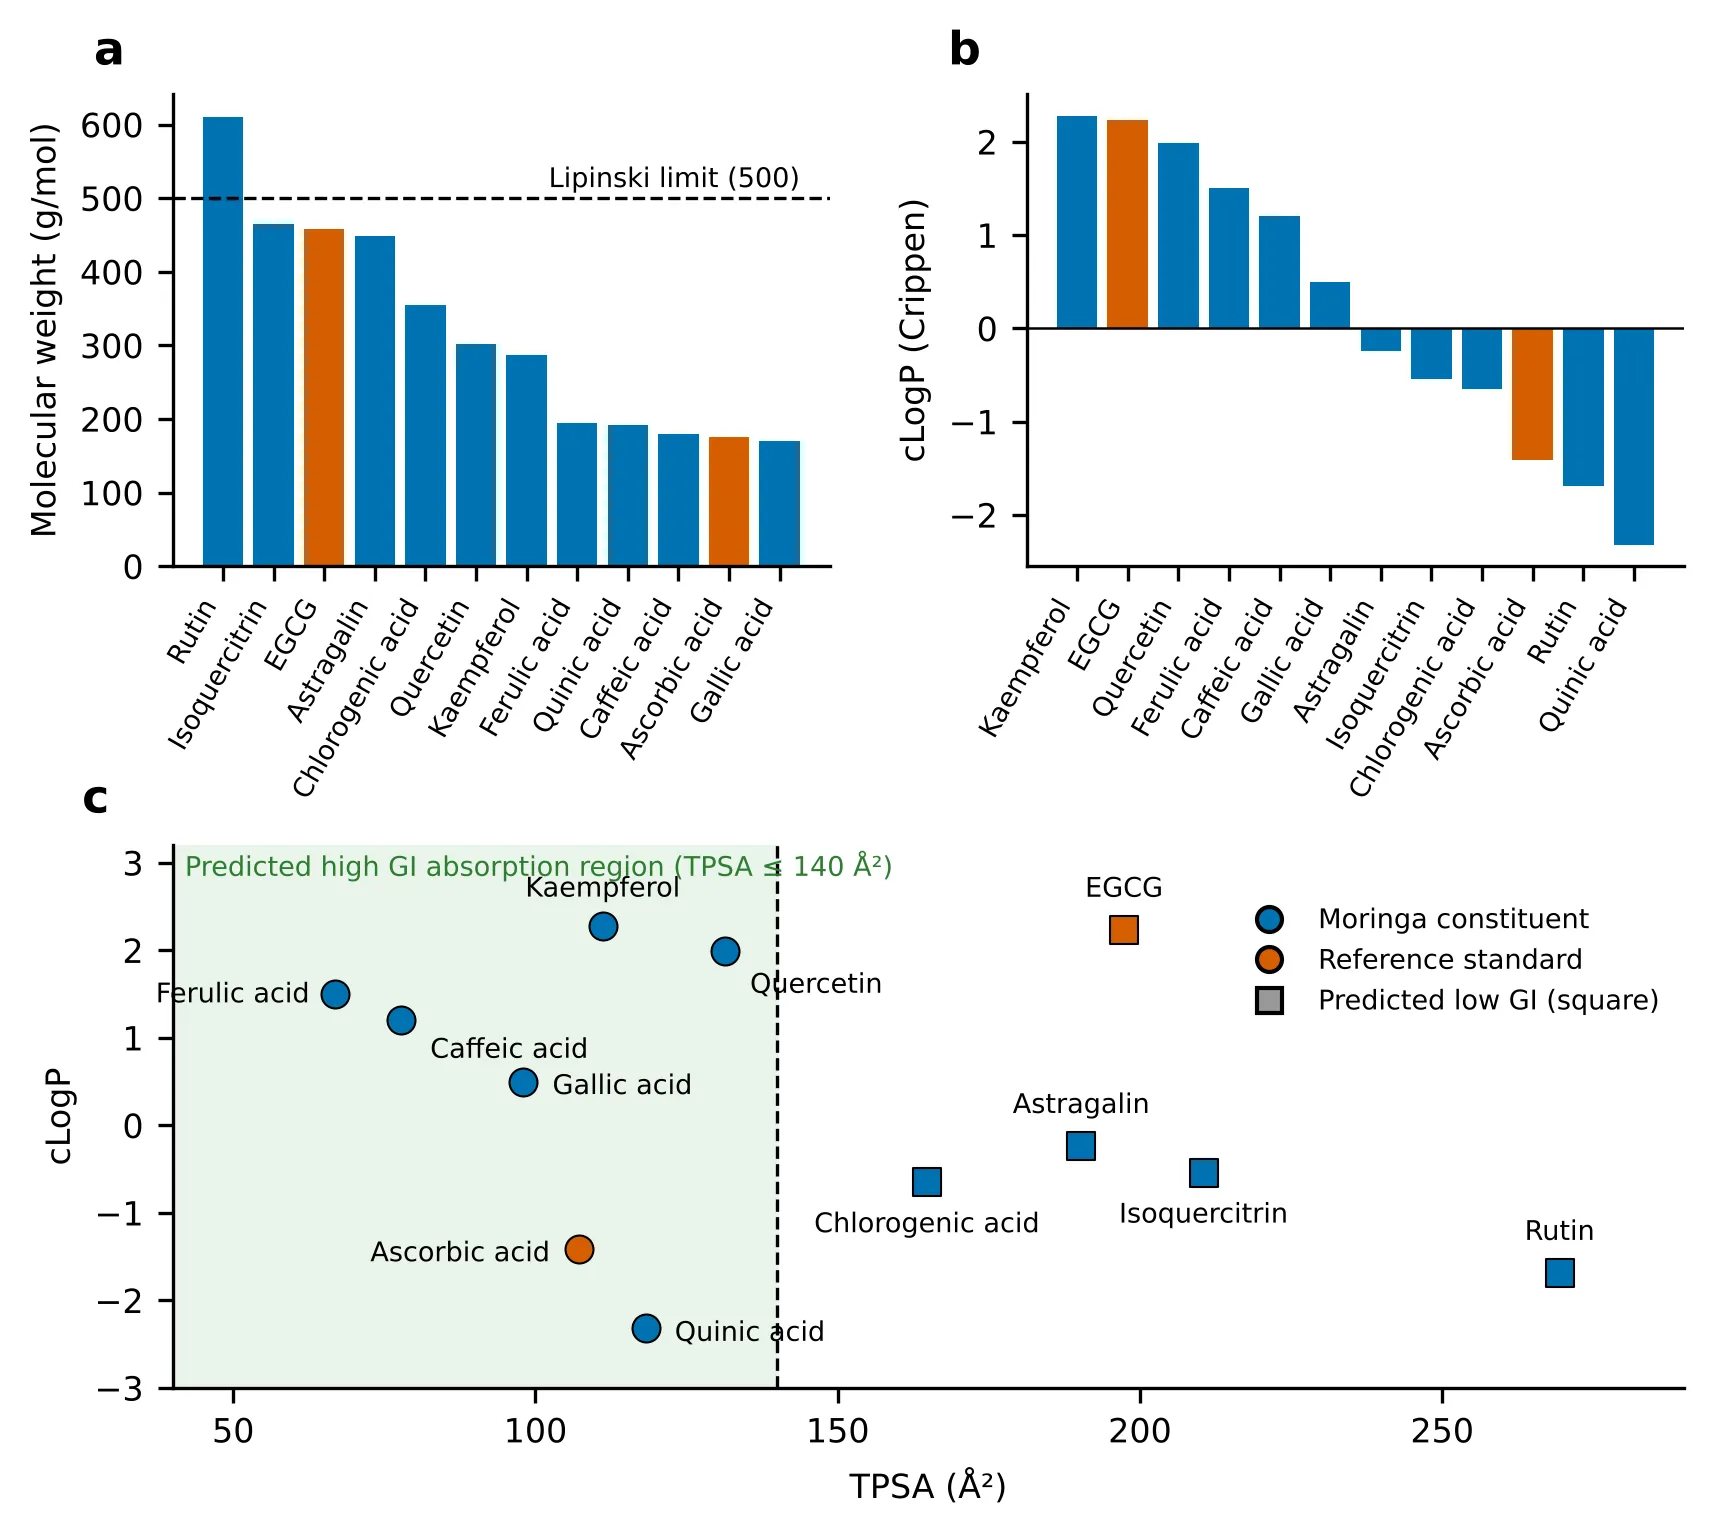
Figure 3: Physicochemical Profile of the Screened Compounds. (a) Molecular Weight and (B) cLogP, with Reference Standards in Orange. (C) TPSA–cLogP Map; the Dashed Line Marks the Veber Limit (TPSA ≤ 140 Å2) and the Shaded Region the Predicted high-GI-absorption Domain. Circles, Predicted High GI Absorption; Squares, Predicted Low GI Absorption.
Glycosylation sharply lowered lipophilicity within the flavonol series: the aglycones quercetin and kaempferol had positive cLogP (1.99 and 2.28), whereas isoquercitrin, astragalin and rutin were negative (−0.54, −0.24, −1.69), with TPSA rising from 111–131 to 190–269 Å2 (Fig. 3). Caffeic and ferulic acids were the only compounds predicted to cross the BBB (TPSA < 90 Å2, cLogP 1.2–1.5), which is of limited relevance for a skin-directed application. Because the same size and polarity constraints govern passive permeation across the stratum corneum [13,14], the glycosides are expected to be less suited to topical delivery unless formulated with permeation-enhancing or encapsulating strategies.
3.2 Pharmacophore features, similarity and ranking
Seven compounds (chlorogenic acid, EGCG, gallic acid, quercetin, isoquercitrin, caffeic acid and rutin) carried the catechol motif, and EGCG alone carried the galloyl motif (Table 3). Caffeic acid (Tanimoto 0.438) and quinic acid (0.391) were most similar to chlorogenic acid, consistent with their being its structural sub-fragments, whereas the flavonoid glycosides showed low similarity to both anchors (0.14–0.18) (Fig. 4a). Combining these terms gave the PSS ranking in Fig. 4b: after EGCG (13.50), chlorogenic acid (10.00), gallic acid (8.85) and quercetin (8.56) ranked highest among the compounds, while quinic acid (1.67) and ascorbic acid (0.91) ranked lowest. Rutin (6.49) was penalised for its two sugar rings despite having a catechol motif, and kaempferol (6.58) and astragalin (3.98) lost score through the absence of the B-ring catechol, in line with the structure–activity relationships of caffeoylquinic acids and flavonoids [23–25].
Table 3: Pharmacophore Features, Fingerprint Similarity to Anchor Actives and PSS Ranking.
| Compound | Phenolic OH | Catechol | Galloyl | Conj. ester | Free COOH | Glycosidic rings | Tc to CGA | Tc to EGCG | PSS | Rank |
|---|---|---|---|---|---|---|---|---|---|---|
| EGCG* | 8 | Yes | Yes | Yes | No | 0 | 0.176 | 1.000 | 13.50 | 1 |
| Chlorogenic acid | 2 | Yes | No | Yes | Yes | 0 | 1.000 | 0.176 | 10.00 | 2 |
| Gallic acid | 3 | Yes | Yes | No | Yes | 0 | 0.170 | 0.283 | 8.85 | 3 |
| Quercetin | 5 | Yes | No | No | No | 0 | 0.162 | 0.188 | 8.56 | 4 |
| Isoquercitrin | 4 | Yes | No | No | No | 1 | 0.179 | 0.157 | 7.54 | 5 |
| Caffeic acid | 2 | Yes | No | No | Yes | 0 | 0.438 | 0.138 | 6.81 | 6 |
| Kaempferol | 4 | No | No | No | No | 0 | 0.116 | 0.194 | 6.58 | 7 |
| Rutin | 4 | Yes | No | No | No | 2 | 0.165 | 0.144 | 6.49 | 8 |
| Astragalin | 3 | No | No | No | No | 1 | 0.141 | 0.160 | 3.98 | 9 |
| Ferulic acid | 1 | No | No | No | Yes | 0 | 0.339 | 0.143 | 3.02 | 10 |
| Quinic acid | 0 | No | No | No | Yes | 0 | 0.391 | 0.089 | 1.67 | 11 |
| Ascorbic acid* | 0 | No | No | Yes† | No | 1† | 0.077 | 0.136 | 0.91 | 12 |
CGA, chlorogenic acid; Tc, Tanimoto coefficient (Morgan, radius 2, 2048 bits). *Reference standards. †The lactone of ascorbic acid is matched by the cyclic-ester SMARTS pattern and counted as a ring-embedded oxygen; these are pattern artefacts rather than true ester or glycosidic features. PSS is a relative heuristic and is not a binding free energy.
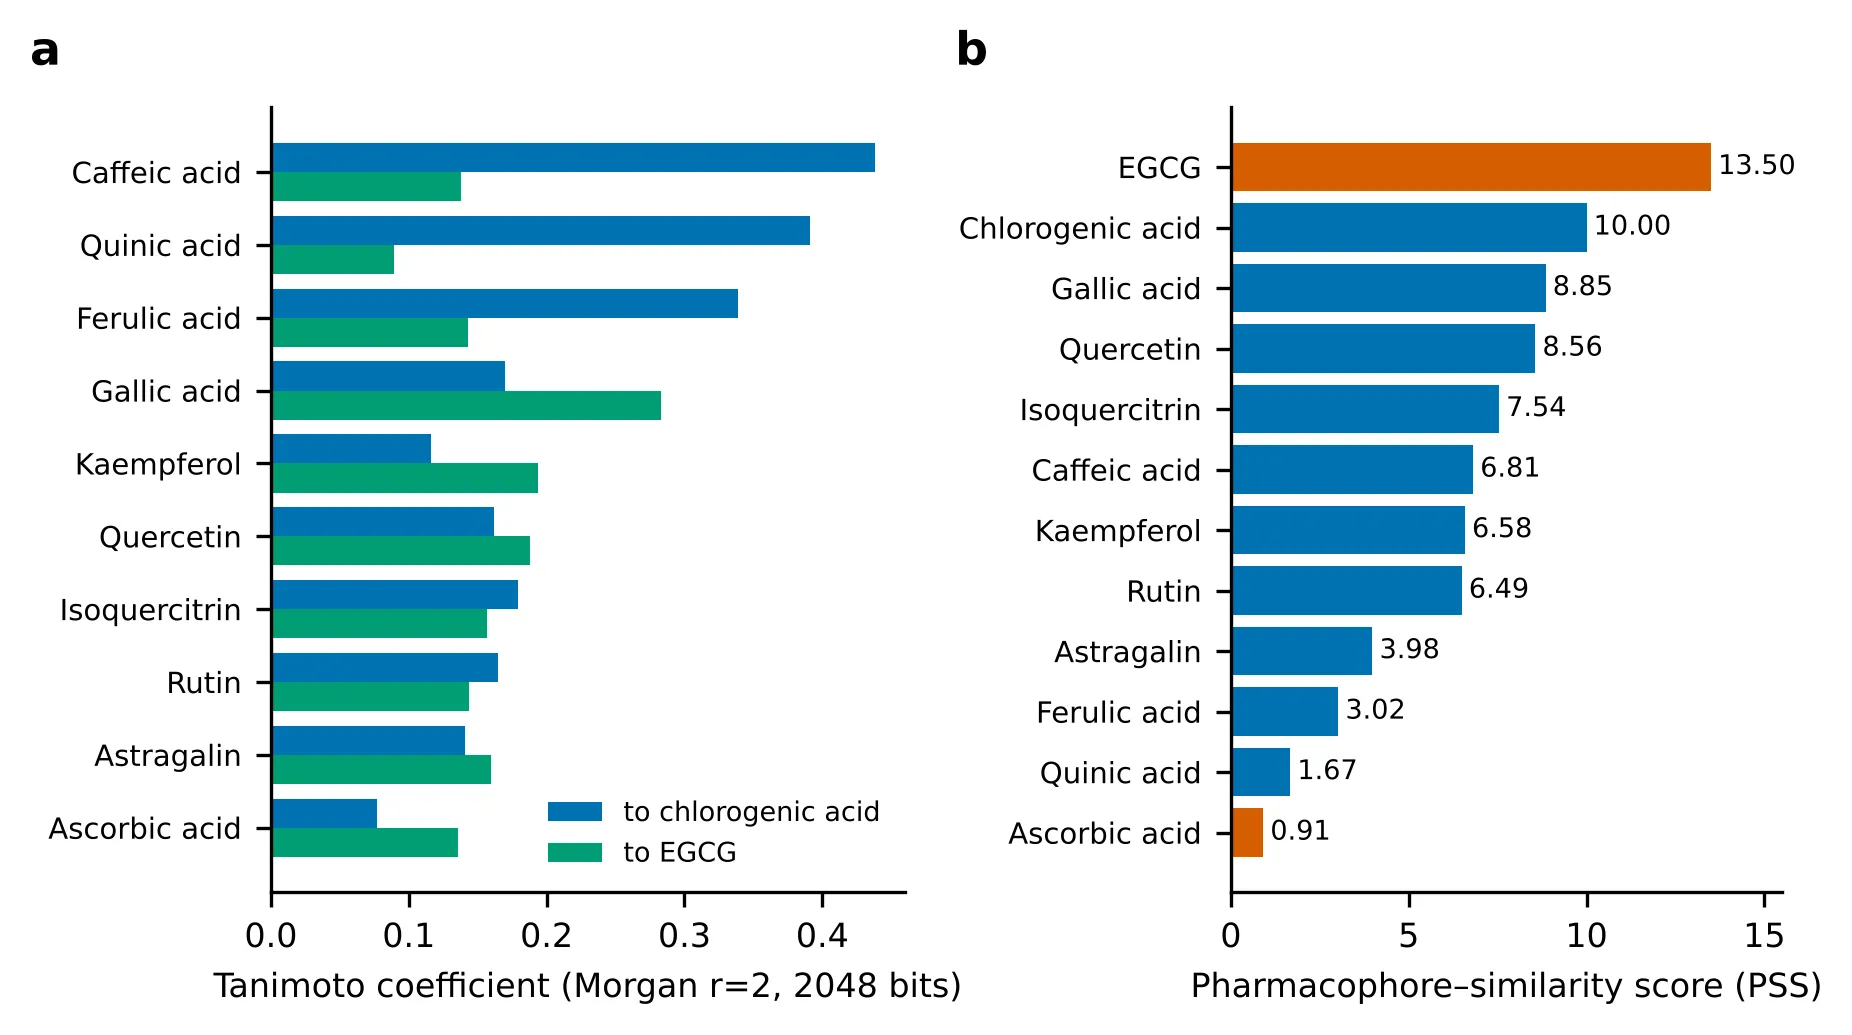
Figure 4: (A) Tanimoto Similarity of Each Compound to the Two Anchor Actives, Chlorogenic Acid (Blue) and EGCG (Green). (B) Pharmacophore–Similarity Score (PSS) Ranking; Reference Standards Are Shown in Orange. EGCG's Score Includes a Self-Similarity of 1.0 to Itself.
3.3 Molecular docking against collagenase and elastase
Docking scores obtained with AutoDock Vina 1.2.7 are given in Table 4 and Fig. 5. At elastase, chlorogenic acid was the best-scoring ligand (−8.93 kcal/mol), followed by quercetin (−7.74 kcal/mol); both scored more favourably than the reference ascorbic acid (−6.52 kcal/mol) by 2.41 and 1.22 kcal/mol, respectively. The C-glycoside vicenin-2 scored −5.80 kcal/mol, and the non-aromatic sugar comparator sucrose scored lowest (−3.01 kcal/mol), as expected for a ligand lacking the phenolic hydroxyl groups and aromatic rings that characterise the polyphenol actives. At collagenase, vicenin-2 scored −6.52 kcal/mol, slightly better than the reference EGCG (−5.96 kcal/mol), while N-fructosyl pyroglutamate scored −4.87 kcal/mol. The ranking of the polyphenols above the sugar-derived ligands in both enzymes is consistent with the pharmacophore analysis, in which the catechol-bearing, ester-containing chlorogenic acid and the catechol-bearing quercetin scored highest among the native constituents.
Table 4: Docking Scores (ΔG) of the Docked Ligands Against Collagenase and Elastase.
| Compound | Target (PDB) | ΔG (kcal/mol) |
|---|---|---|
| Chlorogenic acid (4-caffeoylquinic acid) | Elastase (1U4G) | −8.93 |
| Quercetin | Elastase (1U4G) | −7.74 |
| Ascorbic acid* | Elastase (1U4G) | −6.52 |
| Vicenin-2 | Elastase (1U4G) | −5.80 |
| Sucrose | Elastase (1U4G) | −3.01 |
| Vicenin-2 | Collagenase (1CGL) | −6.52 |
| EGCG* | Collagenase (1CGL) | −5.96 |
| N-Fructosyl pyroglutamate | Collagenase (1CGL) | −4.87 |
*Reference standards. More negative values indicate stronger predicted binding. Scores are comparable within, not between, enzymes.
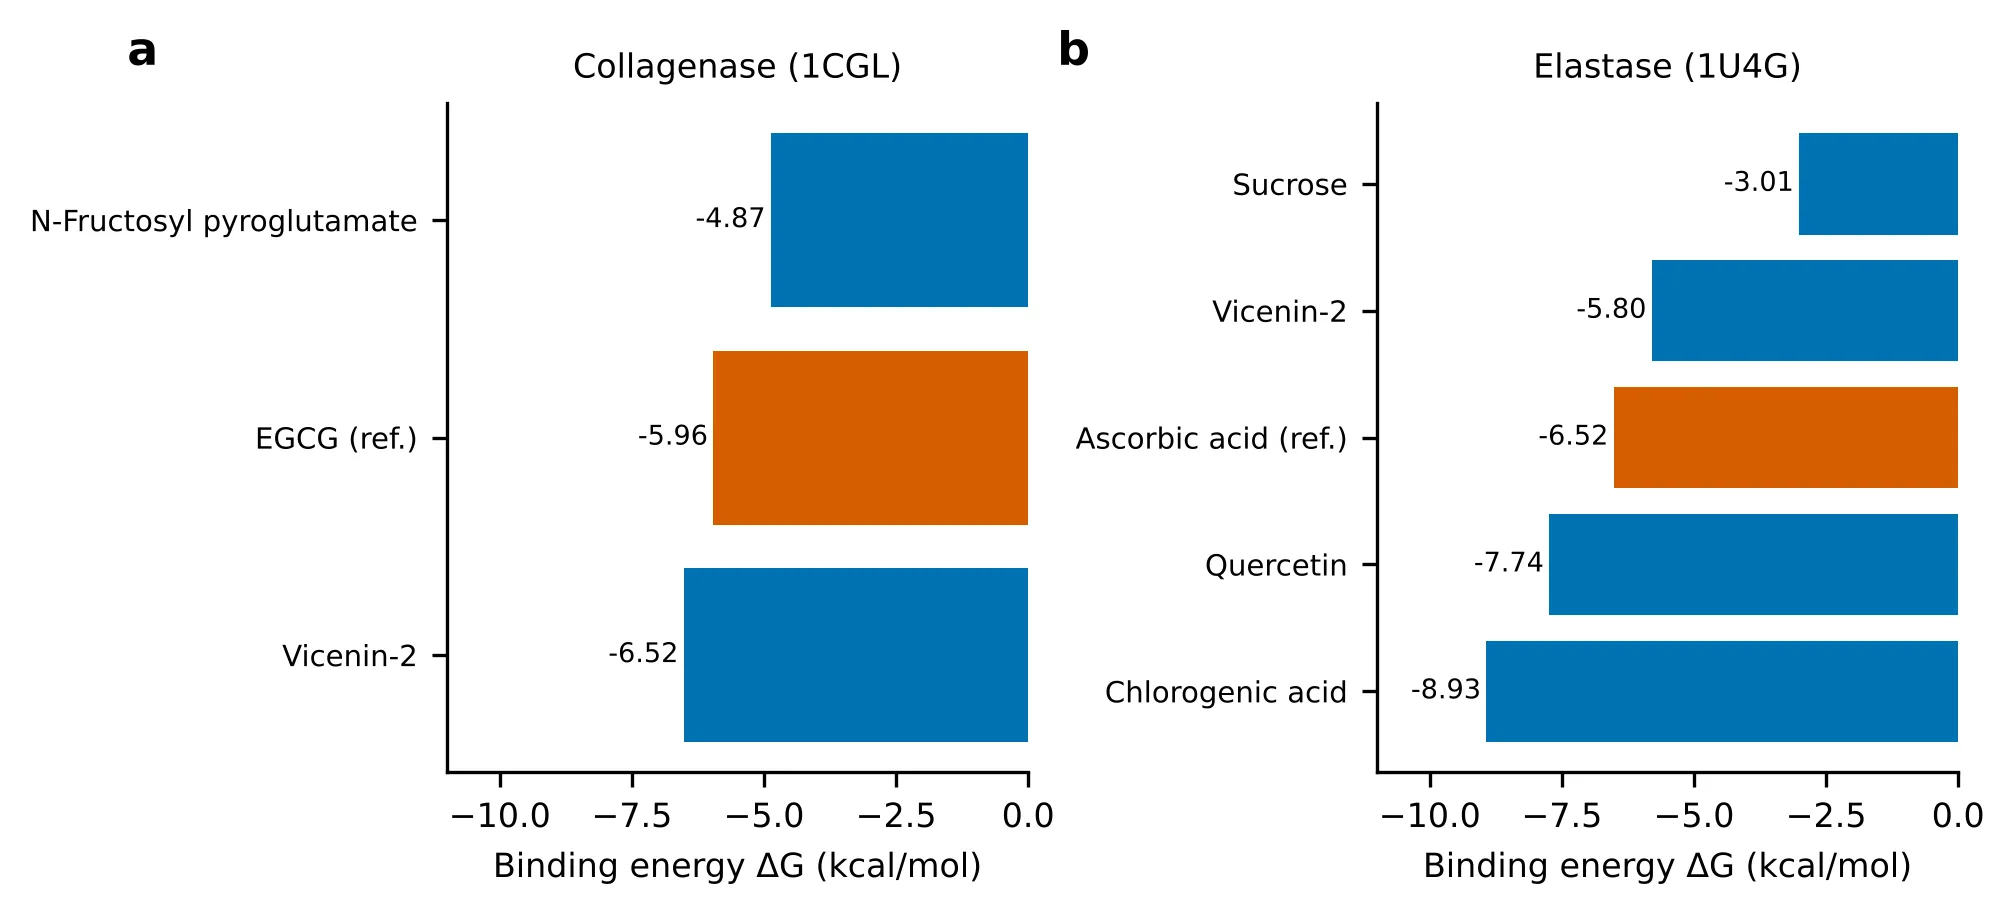
Figure 5: Docking Scores Against (a) Collagenase (1CGL) and (B) Elastase (1U4G). Orange Bars Denote the Reference Standards; More Negative Values Indicate Stronger Predicted Binding.
Differences of about 1 kcal/mol or less such as that between vicenin-2 and EGCG at collagenase are within the typical error of the Vina scoring function and should not be over-interpreted; the larger separations at elastase (chlorogenic acid and quercetin versus ascorbic acid, and the polyphenols versus sucrose) are more informative. Docking scores were obtained for a subset of the panel; for the constituents not docked (kaempferol, gallic, caffeic, ferulic and quinic acids, rutin, isoquercitrin and astragalin) the probable behaviour was reasoned from the pharmacophore data. Catechol-bearing flavonoids are expected to retain zinc-chelating and hydrogen-bonding capacity at the MMP-1 site, with the aglycone quercetin combining this with far better drug-likeness than its glycosides; kaempferol and astragalin lack the B-ring catechol and are expected to bind more weakly; caffeic and ferulic acids represent fragments of chlorogenic acid and may retain part of its contacts at lower affinity; and quinic acid, lacking an aromatic ring, should engage the sites weakest. These predictions remain to be tested by uniform docking and enzyme assays.
3.4 Consolidated prioritisation
Integrating drug-likeness (Table 2), the pharmacophore ranking (Table 3) and the docking scores (Table 4) gives the priority classification in Table 5. Chlorogenic acid and quercetin combine the strongest docking scores at elastase with high pharmacophore scores and acceptable-to-excellent drug-likeness, and gallic acid combines a high pharmacophore score with zero Lipinski violations; these three were classed as high priority. Rutin, despite a catechol motif, was ranked lowest because of three Lipinski violations and a TPSA of 269 Å2. The top-scoring ligands from this integrated ranking, together with kaempferol as a non-catechol comparator and EGCG as reference, were taken forward to molecular dynamics (Section 3.5).
Table 5: Consolidated Priority Classification of the Moringa Constituents.
| Compound | Lipinski violations | Predicted GI absorption | Target-engagement evidence | Priority |
|---|---|---|---|---|
| Chlorogenic acid | 1 | Low (borderline) | Docked: −8.93 kcal/mol (elastase) | High |
| Quercetin | 0 | High | Docked: −7.74 kcal/mol (elastase) | High |
| Gallic acid | 0 | High | Pharmacophore analogy (moderate); not docked | High |
| Kaempferol | 0 | High | Pharmacophore analogy (moderate); not docked | Moderate–High |
| Caffeic acid | 0 | High | Pharmacophore analogy (moderate) | Moderate–High |
| Ferulic acid | 0 | High | Pharmacophore analogy (moderate) | Moderate |
| Vicenin-2† | – | – | Docked: −6.52 (collagenase), −5.80 (elastase) kcal/mol | Moderate |
| Isoquercitrin | 2 | Low | Pharmacophore analogy (moderate) | Moderate |
| Astragalin | 2 | Low | Pharmacophore analogy (weak–moderate) | Low–Moderate |
| Quinic acid | 0 | High | Pharmacophore analogy (weak) | Low–Moderate |
| Rutin | 3 | Low | Pharmacophore analogy (moderate) | Low |
†Not descriptor-screened here; evaluated by docking only. Its molecular weight (≈593 Da) and di-C-glycosidic structure place it outside Lipinski/Veber compliance by analogy with the O-glycosides.
3.5 Molecular dynamics of MMP-1 complexes
To test whether the top-ranked docked ligands remain stably bound, the docked complexes of MMP-1 with chlorogenic acid, quercetin, kaempferol and the reference inhibitor EGCG were subjected to 100 ns molecular dynamics simulations (Fig. 6). Protein backbone RMSD rose from ≈ 0.1 to ≈ 0.2 nm within the first 2–5 ns, then plateaued in a narrow 0.21–0.27 nm band after ≈ 30 ns with no drift or unfolding in any system (Fig. 6a). Kaempferol gave the lowest values (≈ 0.21–0.23 nm), chlorogenic acid and EGCG overlapped (≈ 0.23–0.25 nm), and quercetin showed brief excursions to ≈ 0.26–0.27 nm near 30, 72 and 82 ns before returning to the common range. The inter-ligand differences (≤ 0.03 nm) are small compared with the thermal noise of a single trajectory and should be read as evidence of comparable stability rather than a ranking.
Cα fluctuations were low (mostly 0.05–0.10 nm) and peaks coincided in all four systems, at terminal regions and surface loops (maximum ≈ 0.30 nm), indicating that flexibility is intrinsic to the fold rather than induced by the ligands (Fig. 6b). Rg stayed at ≈ 2.30 nm (range 2.27–2.33 nm, ≈ 2 % variation), and SASA fluctuated around 200 nm2 (188–213 nm2) without systematic change (Fig. 6c,d), indicating that the enzyme remained compact and did not open or partially unfold. Intermolecular hydrogen bonds (Fig. 6e) were most persistent for quercetin (1–3 bonds, transient maxima of four, consistent with its catechol motif), followed by chlorogenic acid (up to 3–4) and kaempferol and EGCG (0–2, with frequent making and breaking). Together with the stable RMSD, this indicates that all four ligands remained associated with the enzyme throughout the trajectory.
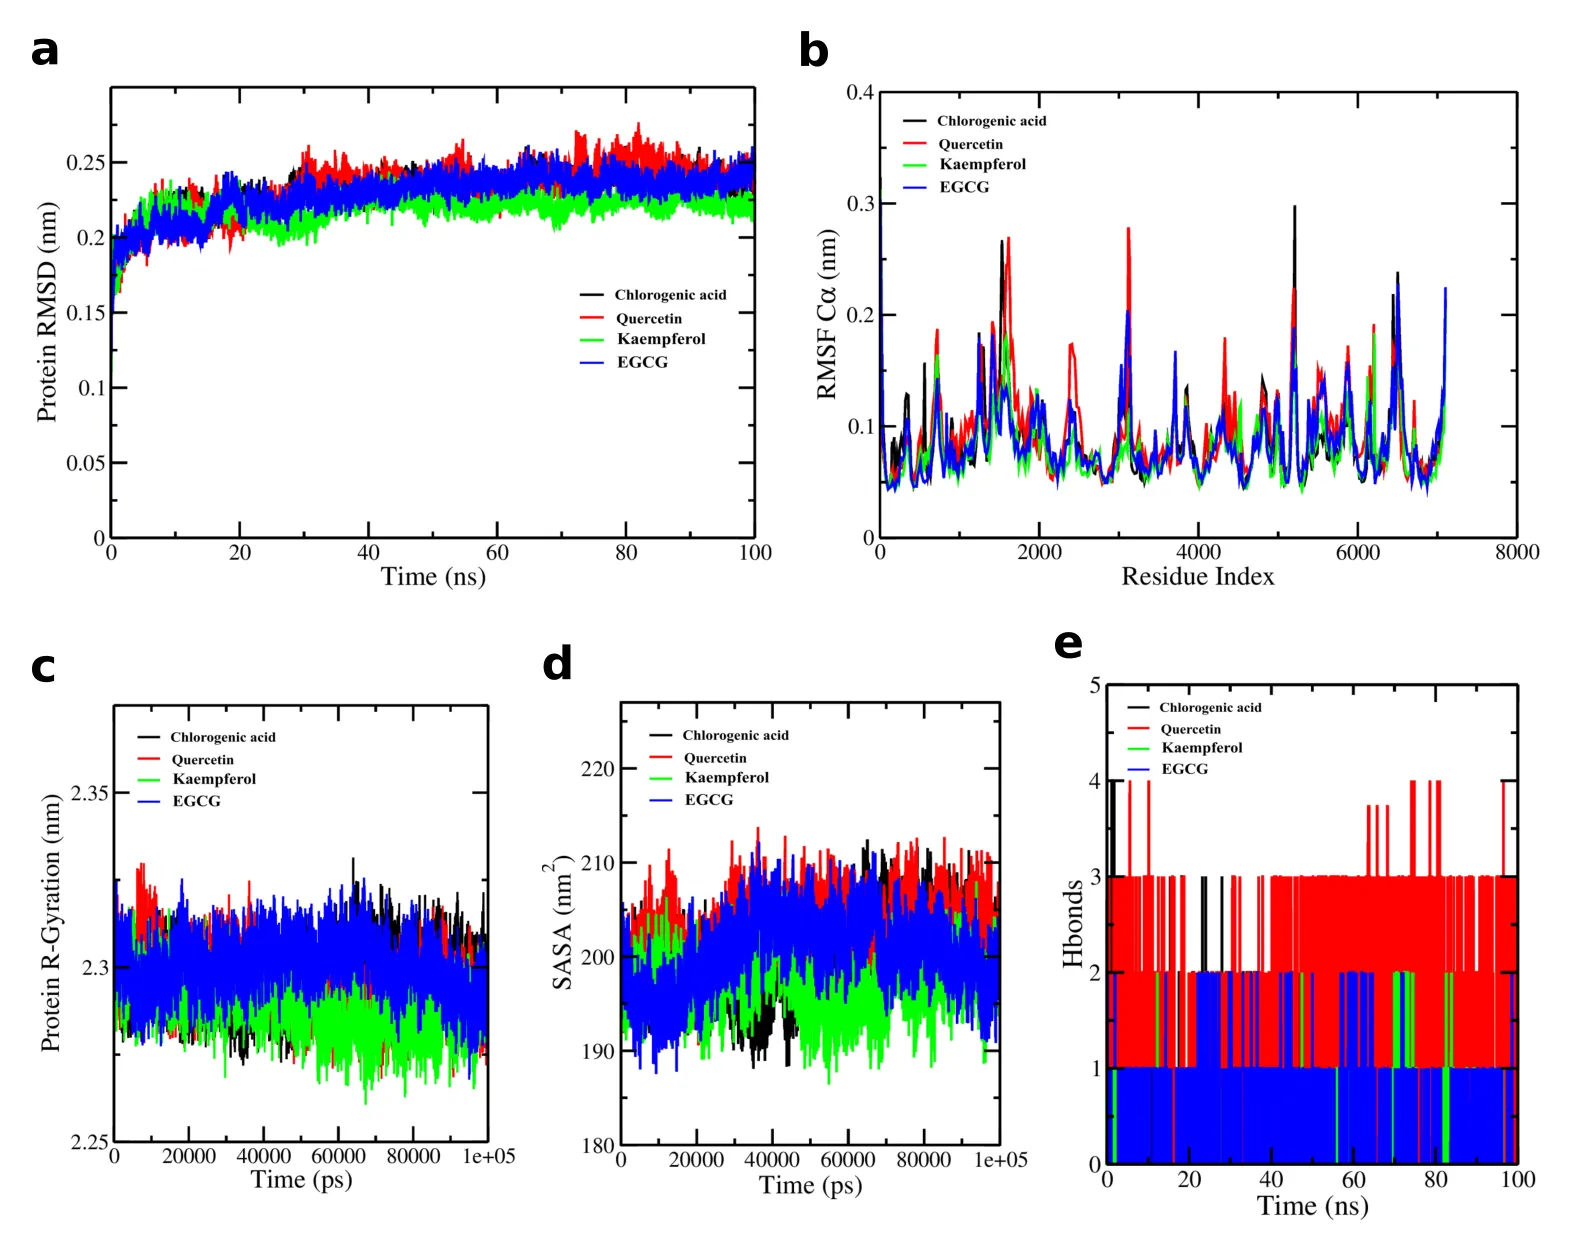
Figure 6: 100 Ns MD Analysis of MMP-1 (PDB 1CGL) Complexes with Chlorogenic Acid (Black), Quercetin (Red), Kaempferol (Green) and EGCG (Blue): (A) Protein Backbone RMSD, (B) Cα RMSF, (C) Radius of Gyration, (D) SASA and (E) Intermolecular Hydrogen Bonds.
3.6 Context among other botanical inhibitors
The leaf-extract potencies reported for M. oleifera are of the same order as those of other polyphenol-rich botanicals (Table 6): collagenase IC50 355.58 ± 17.11 µg/mL versus 416.3 ± 5.6 µg/mL for Eucalyptus camaldulensis bark, and elastase IC50 253.95 ± 10.30 µg/mL versus 343.3 ± 5.4 µg/mL for the same bark and 387.85 ± 8.78 µg/mL for Phyllanthus emblica [12,26,27]. The one-to-two-orders-of-magnitude gap to the single-compound references EGCG (69.16 µg/mL) and ascorbic acid (73.03 µg/mL) is typical of crude extracts, whose activity is distributed over several moderate-affinity constituents [28]. These reports used different assay conditions, so the comparison is indicative only.
Table 6: In Vitro Collagenase and Elastase Inhibition (IC50, Μg/ml) of M. oleifera Leaf Extract and Comparators from the Literature.
| Source | Collagenase IC50 | Elastase IC50 |
|---|---|---|
| M. oleifera leaf extract [12] | 355.58 ± 17.11 | 253.95 ± 10.30 |
| Eucalyptus camaldulensis bark [26] | 416.3 ± 5.6 | 343.3 ± 5.4 |
| Phyllanthus emblica [27] | – | 387.85 ± 8.78 |
| EGCG (reference) [12] | 69.16 ± 1.83 | – |
| Ascorbic acid (reference) [12] | – | 73.03 ± 5.17 |
CONCLUSIONS
A uniform, open-source four-tier workflow descriptor-based drug-likeness, pharmacophore–similarity ranking, molecular docking and 100 ns molecular dynamics indicates that chlorogenic acid, quercetin and gallic acid offer the best balance of predicted target engagement and drug-likeness among the M. oleifera leaf constituents for collagenase/elastase-directed anti-ageing applications, whereas the flavonol O-glycosides and EGCG are limited by poor predicted permeability and may need delivery systems. Chlorogenic acid and quercetin were the top-scoring natural ligands at elastase, surpassing the ascorbic acid reference; when carried into MD with MMP-1, the docked complexes of chlorogenic acid, quercetin and kaempferol were as stable as that of EGCG, with chlorogenic acid showing EGCG-like trajectories, quercetin the most persistent hydrogen bonds, and kaempferol the lowest RMSD. Priority next steps are uniform docking of the full panel against both enzymes, replicate simulations with free-energy calculations, enzyme-inhibition assays, and skin-permeation and formulation testing (e.g., antioxidant co-formulation or nanoencapsulation to protect catechol-bearing compounds from oxidation).
REFERENCES


Frank Deshmukh, Dr. Rohit Sahu, Ankita Mishra, Mahima Turkar, Integrated in Silico Profiling of Moringa Oleifera Leaf Constituents as Collagenase and Elastase Inhibitors: Drug-Likeness, Pharmacophore–Similarity Ranking and MD Simulation, Int. J. of Pharm. Sci., 2026, Vol 4, Issue 10, 4586-4597. https://doi.org/10.5281/zenodo.23728403
 10.5281/zenodo.23728403
Severity: 8192
Message: substr(): Passing null to parameter #1 ($string) of type string is deprecated
Filename: frontend/article.php
Line Number: 890