

We use cookies to ensure our website works properly and to personalise your experience. Cookies policy
KIET School of Pharmacy, Krishna Institute of Engineering and Technology (KIET), Ghaziabad, Delhi-NCR, Uttar Pradesh, India, 201206.
Caffeic acid, a derivative of hydroxycinnamic acid that occurs as phenolic compound in nature with potent antioxidant and anti-inflammatory properties, has limited therapeutic application due to its limited solubility in aqueous medium and stability. Formulation based on nano-approaches provides a promising strategy to combat these drawbacks by enhancing bioavailability and controlled release. In this research, caffeic acid nanoemulsions were optimized using a systematic approach involving variation of surfactant concentration, oil phase composition, and homogenization parameters. The optimized formulation exhibited a mean droplet size below 100 nm, narrow polydispersity index, and high encapsulation efficiency. Physicochemical characterization through transmission electron microscopy confirmed the stability and uniformity of the nanoemulsions, pH 5.9 and viscosity 9.5 cps. These findings suggest that nanoemulsion-based systems can significantly improve the pharmacological potential of caffeic acid, providing a versatile platform for future therapeutic applications.
Caffeic acid, a natural phytoconstituent derived from hydroxycinnamic acid and found in the bark of Eucalyptus globulus, Ilex paraguariensis, Melissa officinalis, and Baccharis genistelloide.
. It is a secondary metabolite found in coffee beans, propolis, fruits like strawberries, pears, and apples, and vegetables including potatoes, cabbage, cauliflower, carrots, and radish (Verma and Hansch, 2004). Hepatoprotective, anti-proliferative, anticarcinogenic, antidiabetic, and antiviral are few of its pharmacological potentials (Verma and Hansch, 2004).
Because of its antioxidant capabilities, it can be incorporated into a variety of skin care products and used as a photoprotective agent for skin. It lessens the oxidative stress brought on by free radicals by preventing the production of reactive oxygen species (ROS). It has poor stability when exposed to UV light and when oxygen is present. Its limited bioavailability and water solubility may restrict its application for oral delivery (Magnani et al., 2014). Caffeic acid was synthesized as nanoemulsions to increase its solubility, bioavailability, and specificity. This is a useful way to increase the solubility and bioavailability of medications that are poorly soluble in water.
The stable, thermodynamically isotropic dispersions known as nanoemulsions (NEs) are made up of oil, aqueous phase, surfactant, and co-surfactant. Since, a co-surfactant has been added, that’s why their interfacial tension is minimal (Khatri and Lohani, 2013). The lower droplet size inhibits droplet coalescence, aids in drug delivery, and avoid nanoemulsion precipitation. Through trapping in the core of the nanoemulsion droplets, they improve the solubility of medications with low aqueous solubility. In addition to improving poor solubility difficulties, they can target tumor cells. (Lopez and others, 2019).
NEs has the ability to penetrate through the skin area and they can increase the therapeutic efficacy of medicament, thus, lower down the chances of adverse reactions or toxicity. (Mahajan and Savale, 2016).
METHODOLOGY
Determination of λmax of drug in methanol
A stock solution was made by dissolving 50 mg of caffeic acid in 50 ml of methanol to obtain 1000 µg/ml in order to measure the drug's absorption maxima. 1 ml of this stock solution was diluted upto 10ml with methanol in order to obtain a concentration of 100µg/ml. The absorption maxima at 200-400 nm were recorded with the help of UV spectrophotometer by using methanol as a reference solution.
Preparation of calibration curve in methanol
A volumetric flask was used to create the dilutions from the stock solution. Using a UV spectrophotometer and methanol as a reference, the absorbance of these various dilutions was measured at 218 nm, and the standard calibration curve was plotted.
Solubility analysis
Dissolve 100 mg of caffeic acid in 5 ml of oil, co-surfactant, and surfactant in separate stoppered glass vials, the solubility of caffeic acid in different solvents was determined. To ensure adequate mixing and minimize particle size, vortex the mixture for 10 minutes and sonicate it for 5 minutes. To achieve equilibrium, mixtures were then maintained in a shaker bath at 37±1.0°C for 72 hours.
Screening of optimized ratio of oil, surfactant and co-surfactant
Oil, surfactant, and co-surfactant were chosen for formulation based on solubility analysis. The selected components were optimized by transparency screening by their ability to form emulsion.
Optimization of aqueous phase concentration
The concentration of the components (oil, surfactant, and co-surfactant) was determined and the o/w nanoemulsion region was obtained using the water titration method.
. The ratio of weight of surfactant to cosurfactant (Km) was varied as 1:1, and 2:1 and the ratio of oil: surfactant/ co-surfactant was varied as 1:9, 2:8, 3:7, 4:6, 5:5, 6:4, 7:3, 8:2, 9:1 respectively.
Then oil, surfactant and co-surfactant were weighed and vortexed for 3 min. Then, water was added dropwise to each oily mixture under proper magnetic stirring at 37ºC so that the medium became clear & transparent. Then pseudo-ternary phase diagram, was plotted using this concentration. (Goyal et al, 2012 and Cui et al, 2009).
Formulation methodology
Oil, isopropyl myristate, surfactant, tween 80, co-surfactant PEG 400 and water were used for formulation and their concentration was optimised using ternary plot. In a clean and dry vial, caffeic acid was added to oil and vortexed. After adding surfactant and co-surfactant in a certain ratio (Smix), again vortexed. Under a vortex mixer, distilled water was used to titrate the mixture. After that, it was sonicated for three minutes using a probe sonicator and kept at room temperature for further use (Ammar et al, 2009).
Evaluation of Nanoemulsions
RESULT
Standard calibration curve
With the help of observed values of absorbance, a standard calibration curve of caffeic acid in methanol was plotted. The absorbance was measured at 218 nm.
Table 1: Absorbance at different concentration in methanol
|
S. No. |
Concentration (µg/ml) |
Absorbance (mean) |
|
1 |
0 |
0 |
|
2 |
2 |
0.168 |
|
3 |
4 |
0.324 |
|
4 |
6 |
0.546 |
|
5 |
8 |
0.732 |
|
6 |
10 |
0.899 |
|
7 |
12 |
0.997 |
|
8 |
14 |
1.233 |
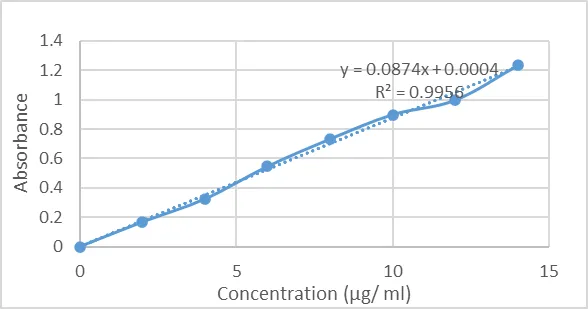
Figure 1: Calibration curve of caffeic acid in methanol
The standard curve as shown in figure 1 indicated the regression equation y = 0.0.874x+0.0004 and R2 was found to be 0.9956, that shows good linearity.
Solubility analysis
Solubility of API in following oils, surfactants and co-surfactants was determined as follows:
Table 2: Solubility analysis of caffeic acid in excipients
|
Excipients |
Solubility (mg/ml) |
|
Oil |
|
|
Ethyl oleate |
4.67±0.01 |
|
Isopropyl palmitate |
6.43±0.001 |
|
Isopropyl myristate |
11.51±0.03 |
|
Surfactant |
|
|
Cremophor RH 40 |
5.33±0.01 |
|
Span 20 |
4.32±0.02 |
|
Tween 80 |
9.87±0.01 |
|
Co-surfactant |
|
|
PEG 400 |
11.68±0.2 |
|
Glycerine |
2.21±0.01 |
|
Isopropyl alcohol |
8.11±0.02 |
n=3
Screening of the optimized ratio of oil, surfactant and co-surfactant
Table 3: Transparency between isopropyl myristate, isopropyl alcohol and tween 80
|
Component |
Oil: Smix |
% transparency (Mean±SD) |
|
|
1 |
Isopropyl myristate |
1:1 |
62.81±0.02 |
|
2 |
Isopropyl alcohol |
||
|
3 |
Tween 80 |
Table 4: Transparency between isopropyl myristate, PEG 400 and tween 80
|
S. No. |
Component |
Oil: Smix |
% transparency (Mean±SD) |
|
1 |
Isopropyl myristate |
1:1 |
88.65±0.09 |
|
2 |
Tween 80 |
||
|
3 |
PEG 400 |
Table 5: Transparency between isopropyl palmitate, tween 80 and PEG 400
|
S. No. |
Component |
Oil: Smix |
% transparency (Mean±SD) |
|
1 |
Isopropyl palmitate |
1:1 |
54.77±0.04 |
|
2 |
Tween 80 |
||
|
3 |
PEG 400 |
Table 6: Transparency between isopropyl palmitate, tween 80 and isopropyl alcohol
|
S. No. |
Component |
Oil: Smix |
% transparency (Mean±SD) |
|
1 |
Isopropyl palmitate |
1:1 |
34.94±0.01 |
|
2 |
Tween 80 |
||
|
3 |
Isopropyl alcohol |
On the basis of transparency, components of nanoemulsion (isopropyl myristate as oil, tween 0 as surfactant and PEG 400 as a co-surfactant) were selected because of maximum transparency (88.65%).
A value of percentage transmittance closer to 100% indicated that the optimized formulation was clear and transparent.
Optimization of aqueous phase
The o/w nanoemulsion region was obtained using a pseudo-ternary phase diagram, which entails gradually adding water to ratio of the oil and surfactant combination using a vortex mixer. Oil:surfactant/co-surfactant ratios were varied as 1:9, 2:8, 3:7, 4:6, 5:5, 6:4, 7:3, 8:2, and 9:1. Surfactant (tween 80) to cosurfactant (PEG 400) ratios were varied as 1:1 and 2:1. Using triplot software, the compositions of the titrated samples, the mass percent compositions of isopropyl myristate, surfactant and co-surfactant mixture (Smix), and water were computed from the end point and plotted on triangle coordinates to create the pseudo ternary phase diagrams.
Based on visual observation, the nanoemulsion phase was identified as a clear and transparent region in the phase diagram. The aqueous phase was represented by one axis of the pseudo-three component phase diagram, the oil phase by another, and a mixture of surfactant and co-surfactant at a fixed weight ratio (Smix) by the third.
TWEEN 80: PEG 400:: 1:1
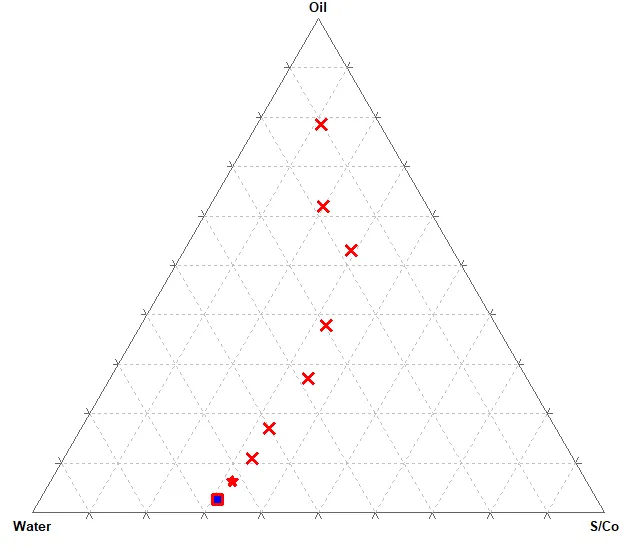
Figure 2: Ternary plot (Km=1:1)
It represents a three-component system {oil, water and Km (surfactant + co-surfactant)}. The symbol ( ) represented NE region (transparent and clear) and other symbols represented coarse emulsion (turbid). The NE region depends upon transparent nature after titration with water (0.05ml water was added at a time).
Table 7: Transparency in various formulations (when Km=1:1)
|
S. No. |
Oil:S/Cos |
Formulation code |
Appearance |
Observation |
|
1 |
1:9 |
M1 |
clear and transparent |
NE |
|
2 |
2:8 |
M2 |
transparent |
NE |
|
3 |
3:7 |
M3 |
cloudy |
coarse emulsion |
|
4 |
4:6 |
M4 |
cloudy |
coarse emulsion |
|
5 |
5:5 |
M5 |
cloudy |
coarse emulsion |
|
6 |
6:4 |
M6 |
cloudy |
coarse emulsion |
|
7 |
7:3 |
M7 |
cloudy |
coarse emulsion |
|
8 |
8:2 |
M8 |
cloudy |
coarse emulsion |
|
9 |
9:1 |
M9 |
Thick and cloudy |
coarse emulsion |
TWEEN80: PEG 400::2:1
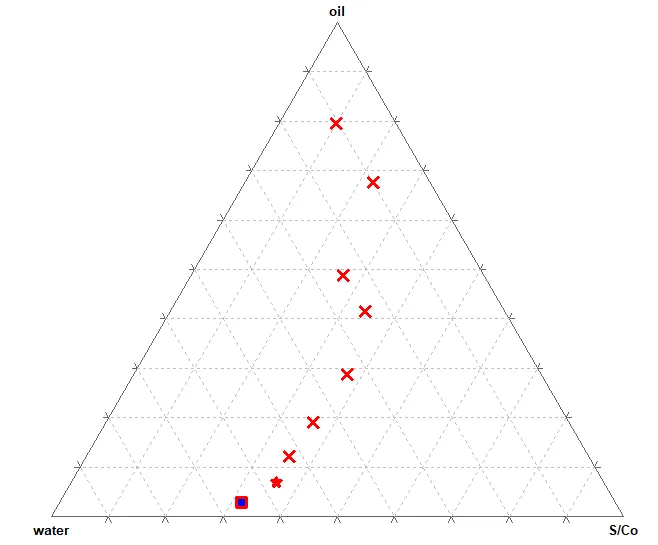
Figure 3: Ternary plot (Km=2:1)
It represents a three-component system {oil, water and Km (surfactant + co-surfactant)}. The symbol ( and ) represented NE region (transparent and clear) and other symbols represented coarse emulsion (turbid). The NE region depends upon transparent nature after titration with water (0.05ml water was added at a time).
Table 8: Transparency in various formulations (when Km=2:1)
|
S. No. |
Oil:S/Cos |
Formulation code |
Appearance |
Observation |
|
1 |
1:9 |
N1 |
transparent |
NE |
|
2 |
2:8 |
N2 |
transparent |
NE |
|
3 |
3:7 |
N3 |
cloudy |
Coarse dispersion |
|
4 |
4:6 |
N4 |
cloudy |
Coarse dispersion |
|
5 |
5:5 |
N5 |
cloudy |
Coarse dispersion |
|
6 |
6:4 |
N6 |
cloudy |
Coarse dispersion |
|
7 |
7:3 |
N7 |
cloudy |
Coarse dispersion |
|
8 |
8:2 |
N8 |
cloudy |
Coarse dispersion |
|
9 |
9:1 |
N9 |
cloudy |
Coarse dispersion |
Formulation of Nanoemulsion
Table 9: Nanoemulsion composition
|
S.No. |
Ingredient |
%w/w |
|
1. |
Isopropyl myristate |
3.12 |
|
2. |
Smix |
66.19 |
|
3. |
Distilled water |
30.69 |
Characterization of Nanoemulsions
The morphology of the nanoemulsion was performed by TEM. From the TEM images of nanoemulsion, it was observed that the particles were uniformly distributed and were spherical in shape with size less than 100 nm. The results confirmed that the droplets were discrete and non-aggregated (Laxmi et al, 2015).
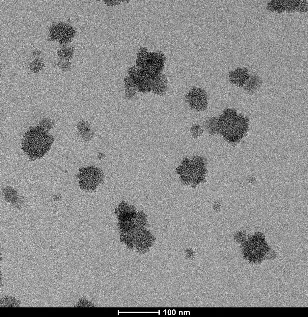
Figure 4: TEM image
Droplet size analysis is done to predict the physical stability of nanoemulsions. Small droplet size prevented the flocculation in order to make the droplets dispersed in medium (Laxmi et al, 2015).
|
|
|
|
|
|
|
Size distribution by Number |
|
|
|
40 |
|
|
|
30 |
|
|
|
20 |
|
|
|
10 |
|
|
|
0 |
|
|
|
0.1 |
|
|
|
1 |
|
|
|
10 |
|
|
|
100 |
|
|
|
1000 |
|
|
|
10000 |
|
|
|
Size (d.nm) |
|
|
|
|
|
Record |
|
|
|
1: |
|
|
|
1 |
|
|
|
1 |
|
|
|
(Number |
|
|
|
Percent) |
|
|
Figure 5: Graphical representation of droplet size distribution
Droplet size of the formulation was found to be 33.56 d.nm. This reveals that the droplet size of the optimized formulation lies in the desirable range i.e. less than 100 nm.
3. pH
The pH of the formulation was found to be 5.9 ± 0.17 by using digital pH meter at 25º ±1º C.
4. Refractive index
It was found to be 1.39 ± 0.08 which indicated the isotropic nature of the nanoemulsion.
5. Viscosity Determination
For determination of viscosity, spindle no. L3 was used and the viscosity was low and was found to be 9.5cps at 27.6ºC.
6. Determination of % drug entrapment
The % drug entrapment of the formulation was found to be 91.70 ± 0.07.
7. Physical evaluation of nanoemulsions
In this test, water-soluble dye eosin yellow was added to nanoemulsions and observed under microscope. It was found that the continuous aqueous phase was evenly distributed with eosin yellow dye whereas, the dispersed oily phase remained undistributed. This test confirmed that the nanoemulsion was o/w type (Laxmi et al, 2015).
This test was done to investigate the phase inversion. The nanoemulsion was diluted with distilled water in the ratio 1:10, 1:50, 1:100. The nanoemulsion did not showed any sign of phase inversion and any kind of precipitation. Thus, this test confirmed that the nanoemulsion was stable (Laxmi et al, 2015).
The nanoemulsion was dropped onto filter paper which indicated rapid spreadability over filter paper due to the aqueous nature of continuous phase. This result confirmed the presence of o/w nanoemulsion (Ghareeb and Neamah, 2017).
CONCLUSION
The present study successfully demonstrated the formulation, optimisation, and evaluation of caffeic acid nanoemulsions using systematic approaches. Caffeic acid, being a polyphenolic constituent of natural origin, has the potential to prevent as well as treat the degenerative disorders specifically associated with oxidative stress. It has been reported to be involved in defense mechanism against degeneration caused by UV irradiation and some pathogens. The optimised nanoemulsion exhibited desirable physicochemical properties, enhanced stability, and improved bioavailability compared to conventional formulations.
These findings highlight the relevance of nanoemulsion technology in advancing natural bioactive compounds into effective pharmaceutical applications.
Beyond the immediate findings, this work underscores the broader applicability of nanoemulsion technology in delivering natural bioactive compounds with poor solubility and stability. By improving the pharmacokinetic profile of caffeic acid, nanoemulsions may open new avenues for its use in antioxidant therapy, anti-inflammatory treatments, and chronic disease management.
Future research should focus on in vivo pharmacodynamic studies, long-term stability assessments, and clinical trials to validate the translational potential of this formulation. Additionally, exploring synergistic combinations with other phytochemicals could further enhance therapeutic outcomes. Overall, caffeic acid nanoemulsions represent a promising step toward bridging the gap between natural compound efficacy and modern pharmaceutical delivery systems.
REFERENCES

Nisha Yadav, Sakshi Garg, Rahul Singla. Optimization and Characterization of Caffeic acid Nanoemulsions, Int. J. of Pharm. Sci., 2026, Vol 4, Issue 8, 3544-3554, https://doi.org/10.5281/zenodo.22054302
 10.5281/zenodo.22054302