
We use cookies to ensure our website works properly and to personalise your experience. Cookies policy
Department of Pharmaceutics, KMCH College of Pharmacy, Coimbatore – 48, Tamil nadu, India
Iguratimod is a novel disease-modifying antirheumatic drug used in the treatment of rheumatoid arthritis due to its anti-inflammatory and immunomodulatory effects. The present study aims to characterize Iguratimod using UV spectrophotometry, Melting point determination, and Fourier Transform Infrared (FTIR) spectroscopy. UV analysis was performed to determine the absorption maximum (?max) and to establish a calibration curve, which showed good linearity within the selected concentration range. The Melting point of Iguratimod was determined to assess its purity and identity, and the observed value was found to be within the acceptable range. FTIR spectroscopy was used to identify the functional groups present in the drug, revealing characteristic peaks corresponding to key structural features. The results confirm the suitability of these simple, rapid, and cost-effective methods for routine identification and quality control of Iguratimod in pharmaceutical analysis
Rheumatoid arthritis (RA) is a chronic autoimmune inflammatory disorder characterized by progressive joint destruction, synovial inflammation, and systemic complications. It affects approximately 0.5–1% of the global population, significantly impacting quality of life and causing long-term disability if not properly treated.[1] The management of RA primarily involves disease-modifying antirheumatic drugs (DMARDs), which slow disease progression and prevent joint damage.[2]
Iguratimod is a novel synthetic disease-modifying antirheumatic drug (DMARD) widely used in the treatment of rheumatoid arthritis, particularly in Japan and China. It exhibits potent anti-inflammatory and immunomodulatory properties, making it an effective therapeutic option for autoimmune diseases.[3] The drug acts by suppressing the production of inflammatory cytokines such as tumor necrosis factor-α (TNF-α), interleukin-1β (IL-1β), IL-6, IL-8, and IL-17, thereby reducing inflammatory responses associated with rheumatoid arthritis.[4]
Iguratimod also modulates immune responses by inhibiting B-cell antibody production and T-cell mediated immune activity, which contributes to its therapeutic efficacy. In addition to its immunomodulatory activity, the drug has been reported to influence bone metabolism by inhibiting osteoclast differentiation and promoting osteoblast activity, thereby preventing bone destruction in rheumatoid arthritis patients.[5]
Due to its increasing clinical use, the development of reliable analytical methods for the identification and characterization of Iguratimod is essential for quality control and pharmaceutical analysis.[6] Various physicochemical and spectroscopic techniques are commonly employed for drug characterization, including UV–Visible spectrophotometry, Melting point determination, and Fourier Transform Infrared (FTIR) spectroscopy. UV spectrophotometry is widely used for quantitative analysis because of its simplicity, sensitivity, and cost-effectiveness. Melting point determination provides preliminary information regarding the purity and identity of the compound, while FTIR spectroscopy enables the identification of characteristic functional groups present in the drug molecule. [7-12]
Therefore, the present study focuses on the analytical characterization of Iguratimod using UV spectrophotometry for calibration curve development, melting point determination for purity assessment, and FTIR spectroscopy for functional group identification, which together provide important information regarding the physicochemical properties of the drug.
The reference standard of Iguratimod was obtained from a company name certified pharmaceutical supplier. Methanol of analytical reagent (AR) grade was used as the solvent for UV analysis. All reagents and solvents used in the study were of analytical grade and used without further purification.
Table 1. List of Instruments used
|
S.NO |
MANUFACTURE |
MODEL |
|
1 |
Shimadzu UV-Visible spectrophotometer |
1800 |
|
2 |
Jasco FT-IR spectrophotometer |
1400 |
|
3 |
Labholic Microprocessor melting and boiling point apparatus |
LH-108 |
|
4 |
Shimadzu digital weighing balance |
AX 200 |
|
5 |
Lifecare Sonicator |
MH2200 |
An accurately weighed quantity of 10 mg of Iguratimod was transferred into a 100 mL volumetric flask. The drug was dissolved in methanol with the aid of sonication and the volume was made up to the mark with the same solvent to obtain a stock solution of 100 µg/mL.
Appropriate aliquots of the stock solution were transferred into a series of 10 mL volumetric flasks and diluted with methanol to obtain concentrations of 5, 10, 15, 20, 25, and 30 µg/mL.
The absorbance of the prepared working standard solutions was measured at the selected λmax. A calibration curve was constructed by plotting concentration (µg/mL) against absorbance, and the regression equation and correlation coefficient were calculated to evaluate the linearity of the method according to the Beer–Lambert Law.
2.3. Determination of melting point:
The melting point of Iguratimod was determined using the capillary tube method. A small amount of finely powdered sample was filled into a capillary tube sealed at one end to a height of approximately 2–3 mm. The capillary tube was placed in a digital melting point apparatus and heated gradually. The temperature at which the sample started melting and the temperature at which it completely liquefied were recorded as the melting point range.
2.4. FT IR Analysis:
Fourier Transform Infrared (FTIR) spectroscopy is used to identify functional groups present in a compound based on the absorption of infrared radiation by molecular bonds. Each functional group absorbs infrared radiation at characteristic frequencies, producing a unique spectrum that serves as a molecular fingerprint for compound identification.
2.4.1. Sample Preparation:
The FTIR spectrum of Iguratimod was recorded using the direct sample method without preparation of a potassium bromide pellet. A small quantity of the powdered sample was placed directly on the sample holder of the FTIR spectrophotometer.
2.4.2. Procedure:
The sample was gently pressed against the crystal surface of the instrument and scanned over the wavenumber range of 4000–400 cm?¹. The spectrum obtained was recorded and analyzed to identify the characteristic absorption bands corresponding to different functional groups present in the molecule.
2.4.3. Interpretation
The observed absorption peaks were compared with standard reference values to confirm the presence of functional groups such as aromatic rings, carbonyl groups, and other characteristic bonds present in Iguratimod.
3. Results and discussion:
3.1. UV Visible spectrophotometric Analysis:
The UV spectrum of Iguratimod was recorded in methanol in the wavelength range of 200–400 nm to determine the wavelength of maximum absorption (λmax). The drug exhibited a prominent absorption peak at approximately 257 nm, which was selected for quantitative analysis.
A series of standard solutions in the concentration range of 5–30 µg/mL were prepared and their absorbance values were measured at the selected λmax. The calibration curve was constructed by plotting concentration against absorbance. The calibration plot showed a linear relationship, confirming adherence to the Beer–Lambert Law within the studied concentration range.
The regression equation obtained from the calibration curve demonstrated a high correlation coefficient (R² value close to 1), indicating good linearity and reliability of the method for quantitative determination of Iguratimod. The results suggest that the developed UV spectrophotometric method is simple, rapid, and suitable for routine analysis of Iguratimod.
Figure 1. Determination of λmax
3.2. Determination of melting point:
The melting point of Iguratimod was determined using the capillary tube method with a digital melting point apparatus.
The melting point of Iguratimod was found to be in the range of 238–242 °C, which is in close agreement with the reported literature value.
The sharp and narrow melting range obtained indicates the good purity and crystalline nature of the drug sample. A narrow melting interval generally suggests the absence of significant impurities, whereas impurities usually produce depression and broadening of the melting range. The observed melting behavior therefore confirms the identity and purity of iguratimod used for the analytical study.
The experimentally obtained melting point was consistent with previously reported physicochemical data, supporting the suitability of the received reference standard for further characterization and method development studies. The high melting point of iguratimod may be attributed to its stable aromatic heterocyclic structure and intermolecular interactions within the crystal lattice.
Reported literature melting point: 238–242 °C.
Observed melting point: 239.7 °C.
Figure 2. Determination of melting point
3.3. FTIR Analysis:
The FTIR spectrum of Iguratimod was recorded in the range of 4000–400 cm?¹ using the direct sample method. the observed peaks were in agreement with the reported structure of iguratimod and demonstrated the presence of aromatic, carbonyl, sulfone, and amide functionalities.
Major absorption bands observed in the FTIR spectrum included a peak around 3300–3400 cm?¹ corresponding to N–H stretching vibration, indicating the presence of the amide group. The bands observed near 2920–2850 cm?¹ were attributed to aromatic/aliphatic C–H stretching vibrations. A strong characteristic absorption peak around 1650–1700 cm?¹ confirmed the presence ofthe carbonyl (C=O) functional group. The intense peaks observed in the region of 1320–1150 cm?¹ were assigned to symmetric and asymmetric stretching vibrations of the sulfone (S=O) group. Peaks in the region of 1500–1600 cm?¹ indicated aromatic C=C stretching vibrations.(Table 2)
The obtained FTIR spectrum confirmed the structural integrity and purity of Iguratimod and showed no evidence of significant interference or degradation products. The characteristic functional group frequencies correlated well with the proposed chemical structure, thereby supporting the suitability of the drug for further analytical investigations and formulation studies.
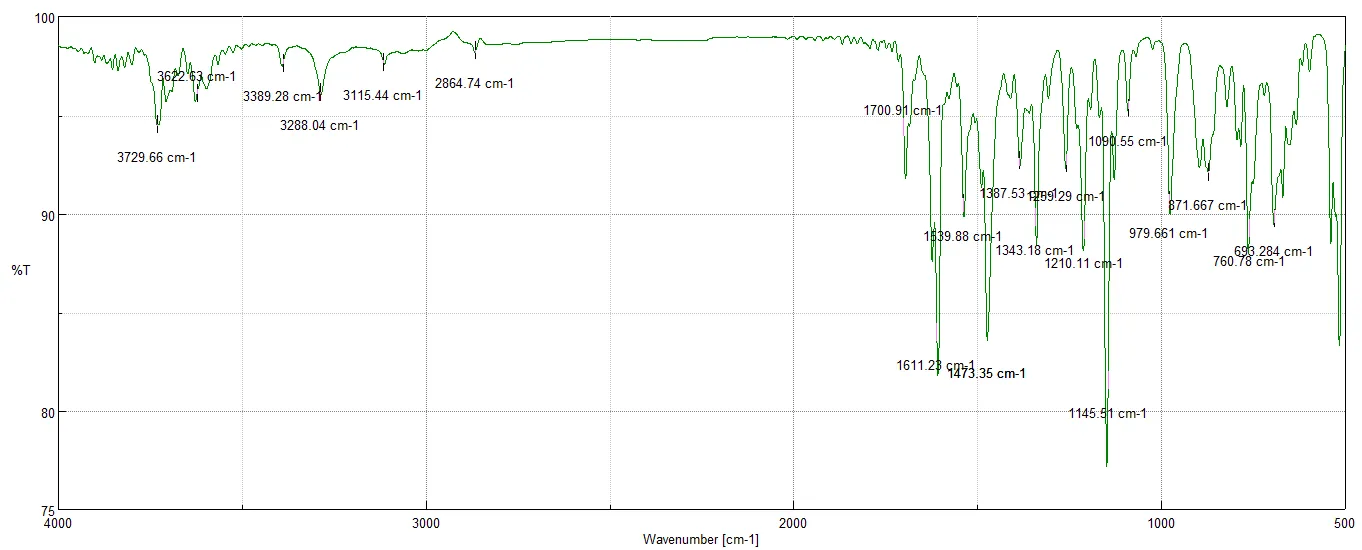
Figure 3. FTIR Spectrum of iguratimod
Table 2. FTIR interpretation of iguratimod
|
Wavenumber (cm?¹) |
Functional Group |
Assignment |
|
~3300 |
N–H stretching |
Amide group |
|
~1700–1730 |
C=O stretching |
Carbonyl group |
|
~1600 |
C=C stretching |
Aromatic ring |
|
~1300–1250 |
C–N stretching |
Amide linkage |
|
~1150–1100 |
C–O stretching |
Ether group |
|
~750–700 |
C–H bending |
Aromatic substitution |
In the present study, the analytical characterization of Iguratimod was successfully carried out using simple and reliable physicochemical and spectroscopic techniques, including UV–Visible spectrophotometry, melting point determination, and Fourier Transform Infrared (FTIR) spectroscopy. The UV spectrophotometric analysis revealed a distinct absorption maximum at 257 nm, and the calibration curve constructed in the concentration range of 5–30 µg/mL demonstrated excellent linearity, confirming compliance with the Beer–Lambert Law. This indicates that the developed UV method is suitable for the quantitative estimation of Iguratimod.
The melting point determination showed a sharp melting range (238–242 °C) consistent with reported literature values, indicating the purity and authenticity of the drug sample. Furthermore, FTIR spectral analysis confirmed the presence of characteristic functional groups corresponding to the molecular structure of Iguratimod, thereby verifying its chemical identity.
Overall, the combination of UV spectrophotometry, melting point determination, and FTIR spectroscopy provides a rapid, cost-effective, and reliable approach for the identification and characterization of Iguratimod. These techniques can be effectively applied for routine quality control and preliminary analytical evaluation of Iguratimod in pharmaceutical research and development.
REFERENCE


Naresh Kumar S., Sabitha S., Vasanthkumar A., Babitha C.L., Sankar C.*, Preliminary Physicochemical Characterization of Iguratimod Using UV Spectroscopy, FTIR And Melting Point Analysis, Int. J. of Pharm. Sci., 2026, Vol 4, Issue 6, 7037- 7043. https://doi.org/10.5281/zenodo.20963141
 10.5281/zenodo.20963141