
We use cookies to ensure our website works properly and to personalise your experience. Cookies policy
1 Department of Pharmaceutical Science, Bhagwan Mahavir Centre for Advance Research, Bhagwan Mahavir University, Surat, Gujarat, India-395007
2 Bhagwan Mahavir Institute of Pharmacy, Bhagwan Mahavir University
The clinical management of Non-Small Cell Lung Cancer (NSCLC), which accounts for nearly 85% of all lung cancer cases, faces significant hurdles despite advancements in targeted and conventional chemotherapy, primarily due to the poor bioavailability, rapid systemic clearance, non-specific distribution, and dose-related toxicities associated with agents like Gemcitabine Hydrochloride (GEM), necessitating high and frequent dosing that often compromises therapeutic efficacy and patient safety. To address these limitations, this study proposes the development of a novel Gemcitabine Hydrochloride niosomal pulmonary drug delivery system, leveraging pulmonary administration as a promising, non-invasive approach for direct, lung-specific drug deposition, which can maximize local concentration and minimize undesirable systemic exposure. Utilizing niosomes, which are non-ionic surfactant-based vesicular carriers known for their ability to encapsulate both hydrophilic and lipophilic drugs, enhance stability, and facilitate sustained/targeted release, the research will formulate GEM-loaded niosomes using optimal ratios of non-ionic surfactants and cholesterol via established preparation techniques like thin-film hydration or the heating method. The prepared formulations will undergo rigorous physicochemical characterization, focusing on critical parameters such as vesicle size and morphology, entrapment efficiency, and in-vitro drug release kinetics, followed by an assessment of the system's overall suitability for pulmonary delivery. It is strongly anticipated that this niosomal pulmonary delivery system will significantly enhance lung-specific drug deposition, prolong the drug's residence time within the pulmonary tissues, and substantially mitigate the systemic toxicity commonly associated with conventional chemotherapy, thereby contributing to a more effective, targeted, and safer pulmonary chemotherapy strategy for the management of NSCLC, ultimately improving patient compliance and overall therapeutic outcomes.
Lung cancer is a heterogeneous group of malignancies that primarily originate in the respiratory epithelium. It is broadly classified into two main categories: Non-Small Cell Lung Cancer (NSCLC) and Small Cell Lung Cancer (SCLC) (1). NSCLC accounts for approximately 85% of all cases and includes three major subtypes: adeno carcinoma, squamous cell carcinoma, and large cell carcinoma. Adeno carcinoma is the most common subtype, especially among non-smokers, and originates from glandular epithelial cells (2). Squamous cell carcinoma typically develops in the central parts of the lungs and is strongly associated with smoking, while large cell carcinoma is an undifferentiated type known for rapid progression (3).
SCLC, although less common (about 15% of lung cancers), is highly aggressive and characterized by rapid growth and early metastasis (2). It typically responds well to chemotherapy and radiotherapy in early stages but has a poor prognosis due to recurrence and resistance in advanced stages (4). These different types of lung cancer vary in their biological behavior, treatment responsiveness, and prognosis, thereby influencing the choice of therapeutic approach, including chemotherapy, radiotherapy, targeted therapy, and immunotherapy (5, 6).
Among various histological types, NSCLC constitutes nearly 85% of diagnosed cases (7). The primary mode of treatment for NSCLC includes chemotherapy, often using antineoplastic agents such as Gemcitabine Hydrochloride (8). While these drugs demonstrate potent anticancer activity, their systemic administration is associated with multiple drawbacks including poor target specificity, rapid plasma degradation, limited bioavailability at the tumor site, and high systemic toxicity (9). Gemcitabine hydrochloride (Gem-HCl) is widely used in lung cancer treatment, but it suffers from rapid plasma degradation, a short half-life, and systemic toxicity due to non-targeted distribution (10). These issues necessitate the development of a site-specific, controlled drug delivery system to improve therapeutic efficacy and patient outcomes (11).
Pulmonary drug delivery is a promising approach that enables direct targeting of lung tissues, offering enhanced local drug concentration and reduced systemic exposure (12). Niosomes, non-ionic surfactant-based vesicles, are stable, biocompatible carriers capable of encapsulating hydrophilic drugs and enabling controlled release (13). They are particularly suitable for inhalation-based drug delivery systems (14, 15).
Despite the therapeutic potential, limited studies have focused on inhalable niosomal formulations of Gemcitabine for targeted lung delivery. Most research emphasizes systemic or oral delivery, leaving a significant gap in inhalation-based nanocarrier development for this drug (16).
This study aims to bridge that gap by developing and optimizing a Gemcitabine-loaded niosomal formulation for pulmonary delivery. It includes preformulation analysis, formulation optimization, physicochemical and biological evaluation, aerosol performance testing, and stability assessment, ultimately supporting the design of an effective lung-targeted anticancer therapy.
MATERIALS AND METHODS
Materials
Gemcitabine Hydrochloride was acquired from Pure chem. Pvt. Ltd. Cholesterol were procured from Astron Chemicals, India. Glycerol and Methanol were procured from National chemical, Vadodara. Tween 80, Disodium hydrogen phosphate and Potassium dihydrogen phosphate were procured from Astron Chemicals, India. Other laboratory grade materials were bought from an institutional supplier for the manufacturer of reagents and solutions.
METHODS
Preparation of Gemcitabine Hydrochloride-loaded Niosomes by thermal emulsification method
Blank Niosomes
Blank formulations were prepared using 2 mL of surfactant blend, heated to 120 °C while stirring. Cholesterol (1.01 g) and SDS (0.5 g) were added, homogenized, and glycerol (3% w/w in PBS) was added dropwise. The mixture was sonicated for 15 minutes at 27 °C to facilitate vesicle formation (17).
Drug-Loaded Niosomes
Gemcitabine-loaded niosomes were prepared via a thermal emulsification method. The lipid phase (Tween 80, Span 80 (2:1 w/w), cholesterol (1.01 g), SDS (0.5 g, for stability)) was heated to approximately 120 °C for homogeneous mixing. The aqueous phase containing 50 mg of Gem-HCl dissolved in 0.9% NaCl was slowly added into the lipid phase under continuous stirring to form a coarse emulsion. Ultrasonication (probe, 4 cycles) was then used to reduce vesicle size, enhance homogeneity, and improve drug encapsulation, crucial for pharmacokinetics and tissue penetration (17).
Optimization of the Niosome Formulation by Quality by design approach
A Box-Behnken Design (BBD) (Design-Expert v10.3.3) was used to optimize niosome composition, targeting a vesicle size <200 nm for inhalable delivery. Surfactant ratio (2–4%), cholesterol (0.9–1.2%), and glycerol (60–63.15%) were varied, while Gemcitabine, SDS, and NaCl were fixed. Statistical models and 3D response surface plots identified optimal component levels for particle size minimization and desired physiochemical characteristics.
Characterization of Optimized Niosomal Formulation.
Particle Size, PDI & Zeta Potential
The mean particle size, PDI, and zeta potential for optimized batch of niosomes were performed using Zetasizer (Malvern Inc.). The analysis lasted 100 s at room temperature with an angle of detection fixed at 90° (18). The Zetasizer (Marlvern Inc.) was used to determine the charge on empty and drug-loaded vesicles surfaces. Analysis was performed for 60 seconds and average ZP, charge, and mobility of the Niosomes were determined (19, 20).
pH Measurement
Niosome pH was recorded at ambient temperature using a calibrated meter, averaged over three replicates. Maintaining a physiologically compatible pH (typically 6.0-8.0) is crucial for drug stability, vesicle integrity, and preventing tissue irritation during administration (21) .
Surface Tension Measurement
Surface tension was measured using a Du Noüy ring on a KSV Sigma 702 tensiometer, after flame cleaning and water calibration (≈72 mN/m). Triplicate measurements were averaged. Surface tension indicates interfacial stability and influences droplet formation during nebulization; lower values facilitate aerosolization (22).
% Entrapment Efficiency (%EE)
EE% was determined by centrifuging 1 mL of formulation (21,000 rpm, 1 h) to pellet vesicles. The free drug in the supernatant was diluted in Simulated Lung Fluid (pH 7.4) and quantified via UV-Vis spectroscopy (23). EE% was calculated as:
%EE=Amount of total drug - Amount of free drug in supernantAmount of total drug×100

High EE% ensures accurate dosing, maximized therapeutic efficacy, and minimized off-target effects.
Morphological Analysis
Morphological analysis of prepared niosomes was carried out using Scanning Electron Microscopy (SEM). The niosomal suspension was placed on an aluminum stub, dried, and coated with a thin layer of gold by sputter coating. The sample was then examined under SEM to study the surface morphology, shape, and structural characteristics of the niosomes (24, 25).
Aerosol Output
Nebulization studies assessed aerosolization performance. A 3 mL niosome formulation was loaded into a jet nebulizer (model to be specified). Aerosol output (%) was gravimetrically determined as:
Aerosol Output (mg) = Initial drug amount (mg) − Residual drug amount (mg)
High aerosol output (≈96%) validates suitability for inhalation, ensuring efficient drug delivery to the respiratory tract (26).
Stability Study
Long-term and accelerated stability were assessed by storing formulations at 4°C, 27°C, and 45°C for 90 days after centrifugation. Periodic measurements included size, PDI, and visual appearance to detect degradation, aggregation, or phase separation, aligning with accelerated stability testing norms (27).
Antimicrobial Sensitivity Testing
The antimicrobial activity of the niosomal formulation was assessed using the agar well diffusion method against selected Gram-positive and Gram-negative bacterial strains (Staphylococcus aureus, Escherichia coli, and Pseudomonas aeruginosa) (28). Mueller-Hinton agar plates were inoculated with microbial suspensions (0.5 McFarland standard), and wells of 6 mm diameter were created. Each well was filled with 100 µL of the niosomal formulation, and the plates were incubated at 37 °C for 24 hours. Zones of inhibition were measured and compared with those of standard antibiotics (29).
In Vitro Cytotoxicity Assay
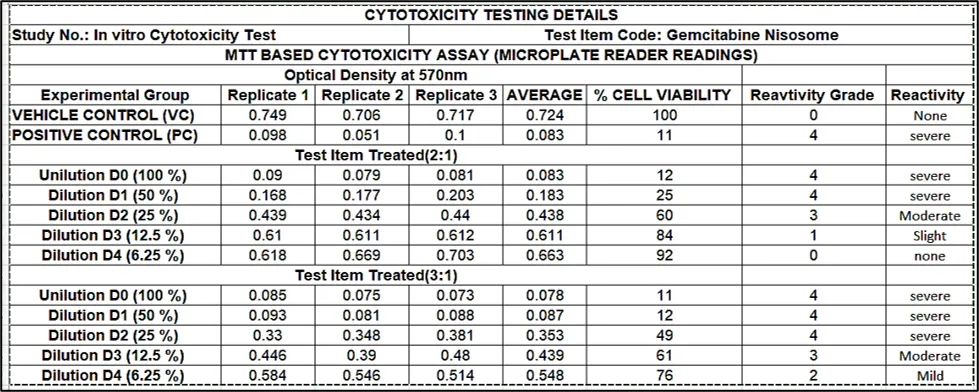
The cytotoxicity of the niosomal formulation was evaluated on MRC-5 (normal lung fibroblast) and A549 (lung adenocarcinoma) cell lines using the MTT assay (30). Cells were cultured in DMEM with 10% fetal bovine serum and 1% penicillin-streptomycin, maintained at 37 °C with 5% CO2. A total of 1×10⁴ cells per well were seeded in a 96-well plate and treated with different concentrations of the niosomal preparation for 24 hours. Subsequently, 20 µL of MTT reagent (5 mg/mL) was added and incubated for 4 hours. The formazan crystals were dissolved using 100 µL of DMSO, and absorbance was measured at 570 nm using a microplate reader. The percentage of viable cells was calculated relative to untreated control wells (31).
Statistical Analysis
Formulation data underwent rigorous statistical analysis for model validity and reliability. R2>0.90 indicated strong fit. ANOVA (P<0.05) assessed significance. A non-significant lack-of-fit (P>0.05) confirmed model adequacy. Adequate precision (>4) ensured model navigability (32). This approach ensures robust, reliable, and scientifically sound optimal formulations.
RESULT AND DISCUSSION
Development of Gemcitabine-loaded niosomal formulation
The optimization of the niosome formulation was systematically conducted using Response Surface Methodology (RSM) via a Box-Behnken Design (BBD) in Design-Expert software (Version 10). This statistical experimental design approach efficiently explores the relationship between multiple independent variables and one or more dependent responses, allowing for the identification of optimal formulation parameters with a reduced number of experimental runs compared to traditional one-factor-at-a-time methods (Table 1).
Table 1 Optimization Parameters and Evaluation Data of Niosomal Formulations
|
Std |
Run |
A: T80:S80 (%w/w) |
B: Cholesterol (%w/w) |
C: Glycerol Solution (%w/w) |
Particle size (nm) |
|
8 |
1 |
4 |
1.05 |
63.15 |
244.7 |
|
13 |
2 |
3 |
1.05 |
61.575 |
236.2 |
|
1 |
3 |
2 |
0.9 |
61.575 |
186.6 |
|
11 |
4 |
3 |
0.9 |
63.15 |
233.4 |
|
6 |
5 |
4 |
1.05 |
60 |
231.2 |
|
9 |
6 |
3 |
0.9 |
60 |
234.5 |
|
5 |
7 |
2 |
1.05 |
60 |
196.7 |
|
2 |
8 |
4 |
0.9 |
61.575 |
242.9 |
|
4 |
9 |
4 |
1.2 |
61.575 |
223.6 |
|
7 |
10 |
2 |
1.05 |
63.15 |
183.3 |
|
10 |
11 |
3 |
1.2 |
60 |
231.7 |
|
12 |
12 |
3 |
1.2 |
63.15 |
232.6 |
|
3 |
13 |
2 |
1.2 |
61.575 |
184.5 |
All 13 niosome formulations were prepared according to the experimental design, and the primary response, particle size (nm), was measured. As shown in Table 5.6, the actual particle sizes ranged from 181 nm to 245 nm, and the close agreement between actual and predicted values validated the robustness of the statistical model.
Model fitting and regression analysis
The experimental data for particle size (Y1) were fitted to a quadratic polynomial model using response surface methodology. The full quadratic model showed excellent adequacy with R² = 0.9944, a low residual error (SSE = 36.25; MS = 12.08), and a statistically significant model (F = 59.17; p = 0.0032). The lack-of-fit was non-significant (p = 0.7901), confirming that the model suitably represents the experimental response within the studied design space. To obtain a parsimonious and practically interpretable equation, a reduced model was generated by omitting five non-significant terms. The reduced model remained highly significant (F = 51.36; p < 0.0001) with strong explanatory power (R² = 0.9625). In addition, the calculated F-value (Fcal = 51.36) was markedly higher than the tabulated critical value (Fcritical = 8.812 at α = 0.05), further confirming overall model significance and validating the selected regression model for prediction and optimization of particle size.
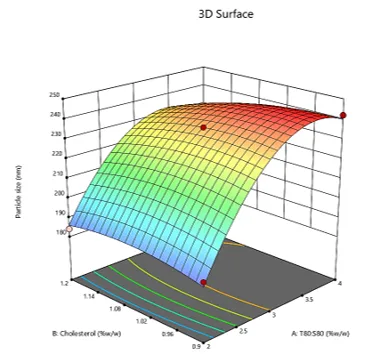
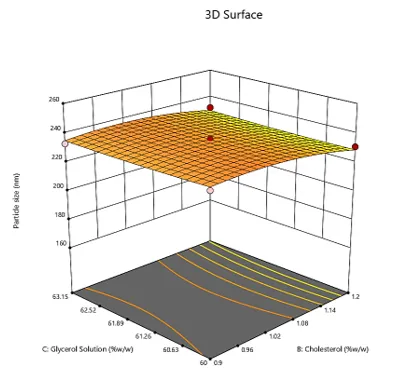
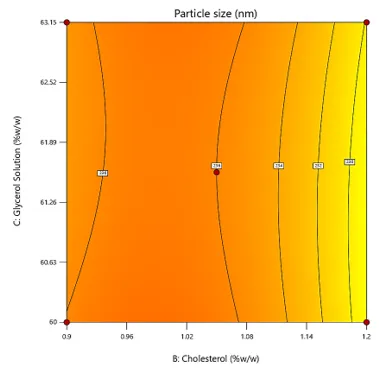
The contour and 3D response surface plots for Y1 (particle size) provide a visual interpretation of how the formulation variables influence vesicle size within the studied design space. Across all plots, particle size changes most prominently with the surfactant ratio (A: T80:S80), confirming that A is the primary driver of size variation in this formulation system. The 3D surfaces show a clear rise in particle size as A increases from its lower to higher levels, while the color gradients and contour spacing indicate that changes in the other factors produce comparatively smaller shifts in the response.
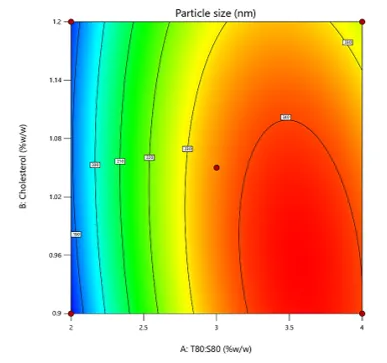
In the A–B plots, generated at a fixed glycerol concentration (C = 61.575% w/w), particle size increases markedly with increasing A, whereas the effect of cholesterol (B: 0.9–1.2% w/w) is limited. The contour lines remain largely aligned along the B-axis, indicating that particle size is relatively insensitive to cholesterol within the selected range, particularly when compared to the pronounced effect of A. The mild curvature and only slight separation of contour lines across B levels suggest that the A×B interaction contributes minimally to the response, which is consistent with the weak statistical contribution of the AB term.
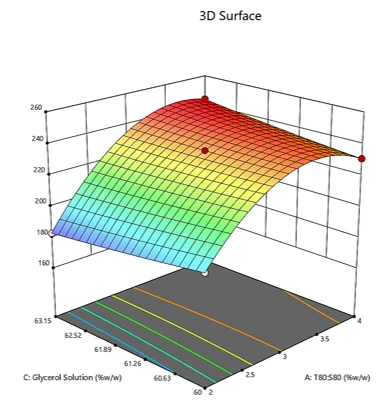
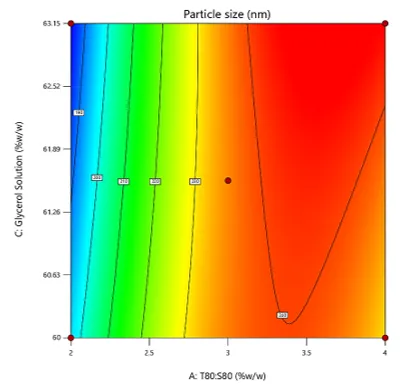
In contrast, the A–C plots, obtained at the center level of cholesterol (B = 1.05% w/w), show that glycerol solution can influence particle size depending on the level of A. Although A still dominates the response, the contour lines exhibit noticeable bending and the surface slope changes across the glycerol range (60–63.15% w/w), indicating a dependence of the glycerol effect on surfactant ratio. This behavior supports the presence of an interaction between A and C, implying that glycerol does not act as a strong independent factor but can modulate particle size when combined with specific surfactant compositions.
The B–C plots, generated at a fixed surfactant ratio (A = 3), display a comparatively flat surface with widely spaced contours, indicating minimal combined influence of cholesterol and glycerol on particle size at the mid-level of A. The absence of strong curvature or steep gradients suggests that the B×C interaction is negligible within the investigated ranges. Overall, these response surface and contour plots corroborate the regression analysis by demonstrating that vesicle size is primarily governed by the surfactant ratio, while glycerol contributes mainly through interaction with A, and cholesterol shows only a minor influence within the selected experimental window.
Table 2 Model Testing Summery
|
Model parameters |
Y1: PS |
|
|
Full model |
Reduced Model |
|
|
df |
9 |
4 |
|
F-value |
59.17 |
51.36 |
|
P-value (model) |
0.0032 |
< 0.0001 |
|
R2 |
0.9944 |
0.9625 |
|
SSE |
36.25 |
242.55 |
|
MS (FM) |
12.08 |
30.32 |
|
No. of term ommited |
5 |
|
|
p-value (Lack of Fit) |
0.7901 |
|
|
Fcalculated |
51.36 |
|
|
Fcritical (α=0.05) |
8.812 |
|
|
Fcrit>Fcal |
||
|
|
|
|
|
|
Figure 1 Contour Plots and 3D surface plots for Response Y1 showing effect of AB, AC and BC
The interaction plot illustrates the combined effect of A (T80:S80 ratio) and B (cholesterol concentration) on particle size (Y1) at a fixed level of C (glycerol solution). A clear rise in particle size is observed as the surfactant ratio increases from the low to high level, indicating that A exerts the strongest influence on vesicle size across the studied domain. This pattern suggests that increasing the T80:S80 ratio promotes formation of larger vesicles, which is reflected by the upward curvature of the response lines.
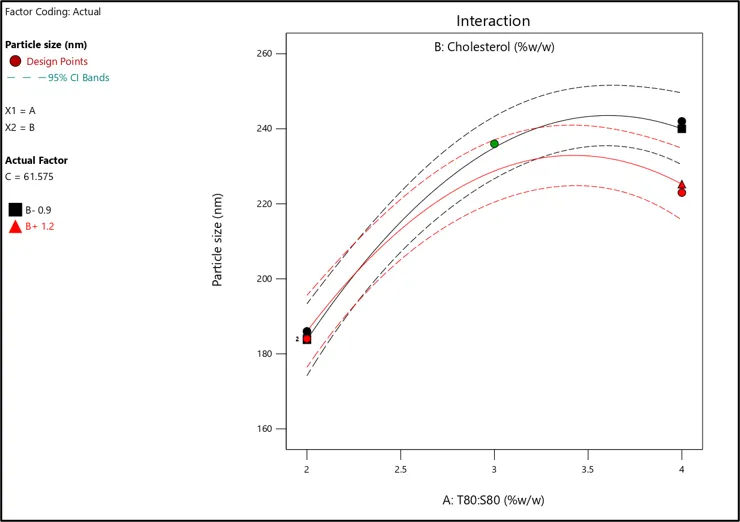
Figure 2 Interaction Plot
In contrast, the influence of cholesterol is comparatively small within the tested range (0.9–1.2% w/w). The response lines corresponding to low and high cholesterol remain close to each other and are almost parallel over the entire range of A. Such behavior indicates that cholesterol causes only a slight shift in the particle size response and does not markedly change the trend imposed by the surfactant ratio. Overall, the near-parallel nature of the lines supports a weak A×B interaction, and the plot confirms that particle size is primarily controlled by the surfactant ratio, with cholesterol contributing only marginally under the selected experimental conditions. The predicted versus actual plot for particle size demonstrates the adequacy of the developed regression model. Most experimental points lie very close to the diagonal reference line, indicating strong agreement between the predicted values generated by the model and the corresponding observed particle size values. The close clustering of data points around the line across the full response range (approximately 180–245 nm) suggests that the model can describe the response with minimal systematic bias. In addition, the absence of pronounced scatter or clear outliers indicates that the residual errors are small and reasonably uniform throughout the design space. The consistency observed at both lower and higher particle size regions further supports the reliability of the model for prediction and optimization. Overall, this plot confirms that the selected model provides a satisfactory fit and can be used to predict particle size within the investigated experimental region.
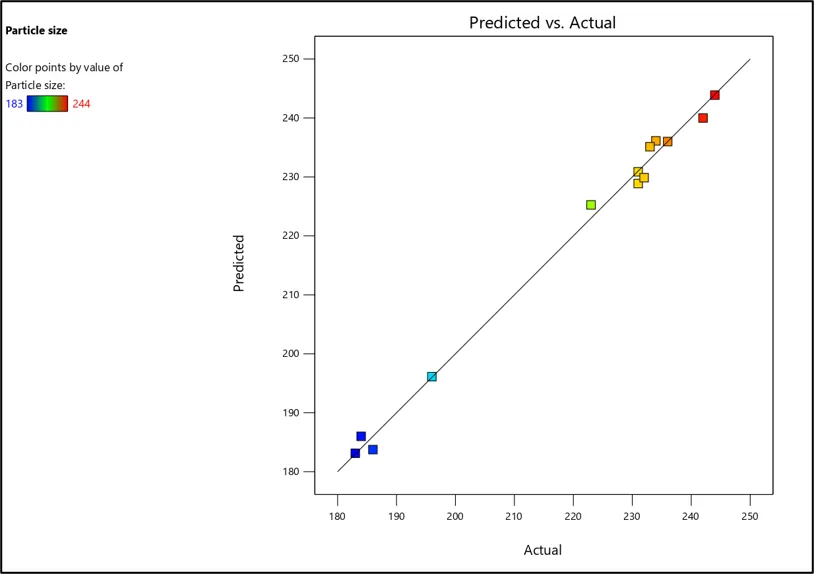
Figure 3 Predicted vs Actual Plot for response Y1
Checkpoint analysis and formulation optimization
The overlay plot was used to identify the design space for achieving the desired particle size response. As shown in the figure, the yellow region represents the feasible zone satisfying the particle size constraint (≤ 220 nm), whereas the grey region indicates conditions that do not meet the criterion. At the fixed level of glycerol solution (C ≈ 61.96% w/w), the acceptable region was mainly governed by the surfactant ratio A (T80:S80), with the boundary shifting only slightly with cholesterol concentration. This pattern indicates that particle size is predominantly controlled by factor A, and values of A in the lower range (approximately 2.0–2.6% w/w) provide the most reliable space to obtain vesicles within the targeted size limit.
Based on the desirability function approach, two optimized checkpoint formulations were suggested by the software and were prepared experimentally to validate the model predictions. Both optimized batches (OBGEM 1 and OBGEM 2) showed desirability of 1, indicating that the selected factor combinations strongly satisfied the optimization goal. The predicted particle sizes for OBGEM 1 and OBGEM 2 were 185.6 nm and 179.56 nm, respectively. Upon experimental evaluation, the observed particle sizes were 181.2 nm and 183.4 nm (mean ± SD, n = 3), demonstrating close agreement with the predicted values. The corresponding prediction errors were low (2.43% for OBGEM 1 and 2.09% for OBGEM 2), confirming the reliability and predictive capability of the developed model within the established design space.
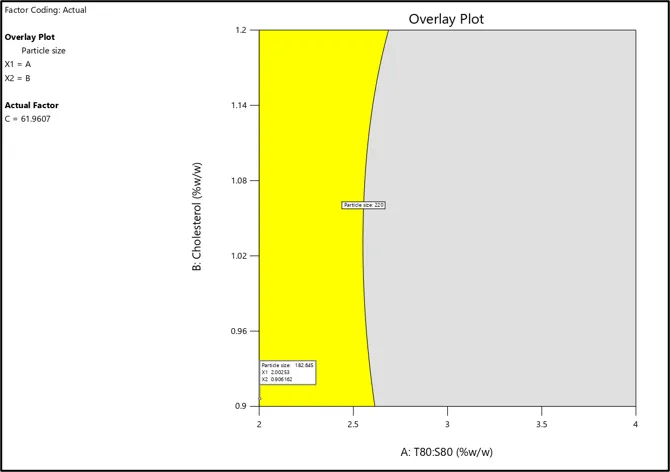
Figure 4 Overlay Plot
Table 3 Checkpoint analysis and optimized batch
|
Batch code |
Factor value |
Desirability |
Predicted value |
Experimental value* |
% Error |
|
PS (nm) |
PS (nm) |
PS (nm) |
|||
|
OBGEM 1 |
X1=2.003, X2= 0.906, X3= 61.961 |
1 |
185.6 |
181.2 |
2.43 |
|
OBGEM 2 |
X1=2.003, X2= 0.907, X3= 62.730 |
1 |
179.56 |
183.4 |
2.09 |
|
*All values are mean ± SD (n = 3) |
|||||
Characterization of optimized Niosomal (OBGEM 2) formulation
Particle Size, PDI & Zeta Potential
The Particle Size Niosome was 183.2 nm; the niosome formulation meets the requirement for the aerosolized application, as a particle size that was suitable to be aerosolized was in the range of 50–500 nm. Zeta potential of Niosome was -26.7±0.12mv; which indicates that the charged Niosomes are stable against aggregation and fusion due to the increasing repulsive forces between the particles in the niosome systems.
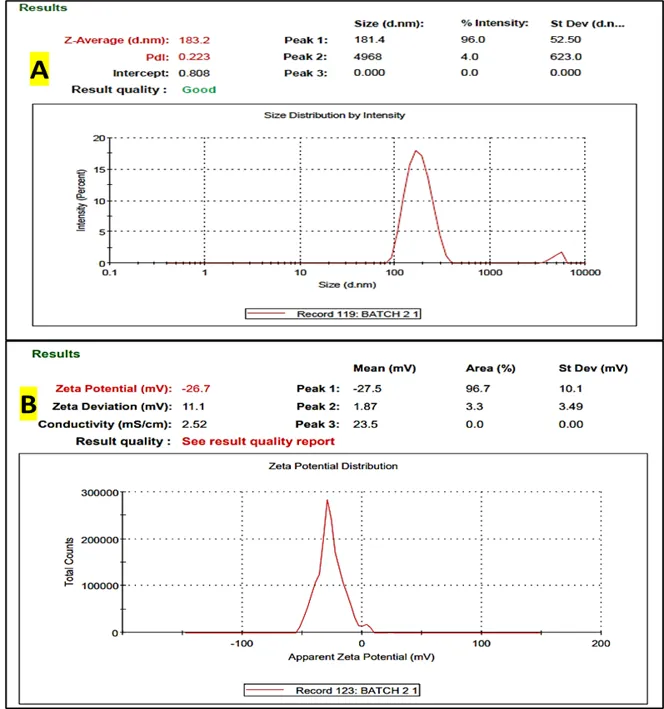
Figure 5 A) Particle size and B) Zeta potential of optimized Niosomes
pH Measurement
pH of the niosome formulation which needs to be nebulized to the lung should be in the range of 6.6 to 6.8 to mimic the condition in the lung cancer area as well as for inhaled drugs. Extremely acidic pH may increase drug loss and result in severe cough and irritation. The optimized formulation OBGEM 2 showed a mean pH of 6.70 ± 0.01 (n = 3), indicating a slightly acidic to near-neutral dispersion with excellent batch-to-batch consistency.
Table 4 Ph Measurement of optimized niosomes (OBGEM 2)
|
Sr. No. |
Formulation |
Mean pH Value (n=3: ± SD) |
|
1 |
OBGEM 2 |
6.70±0.01 |
Surface Tension Measurement
The optimized formulation exhibited a density of 1.012 g/mL, which is close to that of water, indicating a dispersion that should nebulize efficiently without excessive gravitational settling during handling. The surface tension was 34.42 ± 0.01 mN/m, reflecting effective interfacial activity of the formulation components. A reduced surface tension compared with pure water is generally favorable for nebulization because it can facilitate droplet formation and aerosol generation, supporting consistent aerosol output and potentially improving pulmonary delivery performance.
Table 5 Surface tension measurement of OBGEM 2
|
Sample |
Density |
Surface Tension |
|
WATER |
1g/mL |
72mN/m. |
|
OBGEM 2 |
1.012 g/mL |
34.42 ±0.01 mN/m. |
% Entrapment Efficiency (%EE)
The optimized niosomal formulation OBGEM 2 exhibited a high drug entrapment efficiency of 90%, indicating efficient incorporation of the drug within the vesicular system.
Table 6 % Entrapment efficiency of OBGEM 2
|
Optimized batch |
Drug Entrapment Efficiency % |
|
OBGEM 2 |
90% |
Morphological Analysis
SEM analysis revealed that the prepared niosomes exhibited irregular flaky/plate-like morphology with rough surface characteristics. The particles appeared uniformly distributed with slight aggregation in some regions. The SEM micrographs confirmed the formation of discrete vesicular structures with satisfactory surface morphology and structural integrity.
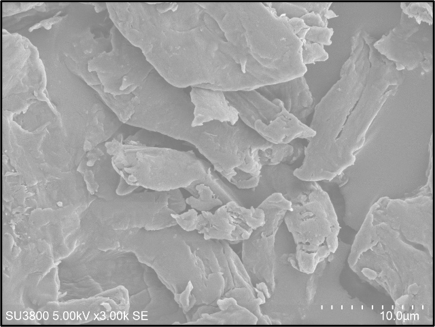
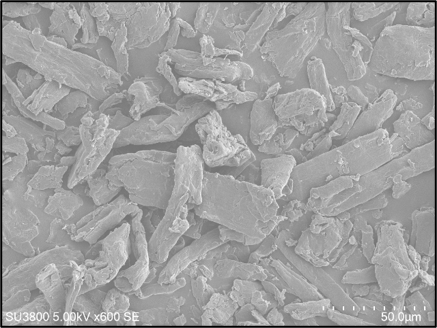
Figure 6 Scanning Electron Microscopy (SEM) images showing the surface morphology of prepared niosomes at different magnifications
Aerosol Output
Aerosol output performance was evaluated by measuring the nebulized volume as a function of time and comparing the optimized batch (2:1) with water. The optimized batch showed a faster aerosol generation profile, delivering 1.0 mL at 5 min, 2.0 mL at 10 min, and reaching 3.0 mL by 15 min. In contrast, water exhibited a slower output, producing 0.5 mL (5 min), 1.5 mL (10 min), 2.0 mL (15 min) and 2.5 mL at 20 min. Overall, the batch (2:1) achieved a higher nebulized output within a shorter duration, indicating improved nebulization performance compared with water.
Table 7 Aerosol Output
|
Time (min) |
Aerosol Output efficiency (%) |
|
|
Water |
Batch (2:1) |
|
|
5 |
0.5ml |
1ml |
|
10 |
1.5ml |
2ml |
|
15 |
2.0ml |
3.0 |
|
20 |
2.5ml |
- |
Antimicrobial Sensitivity Testing
The optimized niosomal formulation (2:1) exhibited notable antimicrobial activity, producing a zone of inhibition of 40 mm, indicating strong inhibitory potential against the tested microorganism.
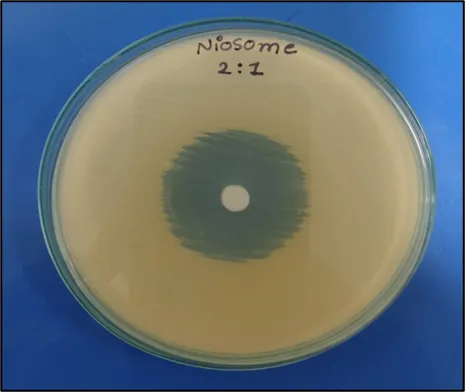
Figure 7 Antimicrobial activity by Zone of Inhibition
In Vitro Cytotoxicity Assay
The MTT cytotoxicity assay showed clear dose-dependent reduction in cell viability for the gemcitabine niosome formulations. The vehicle control maintained 100% viability (OD 0.724), while the positive control showed marked cytotoxicity with ~11% viability (OD 0.083). For the 2:1 batch, cell viability decreased from 92% (6.25%) and 84% (12.5%) to 60% (25%), and further dropped sharply to 25% (50%) and 12% (100%), indicating strong concentration-dependent cytotoxicity. For the 3:1 batch, viability similarly decreased from 76% (6.25%) and 61% (12.5%) to 49% (25%), and reached 12% (50%) and 11% (100%), confirming potent cytotoxic activity at higher concentrations. Based on the % viability values, the estimated IC₅₀ (approximate concentration producing ~50% viability) was ~32% dilution for the 2:1 batch (between 25% and 50%) and ~24% dilution for the 3:1 batch (close to the 25% point). Overall, both formulations demonstrated substantial cytotoxic potential, with the 3:1 batch showing a slightly stronger effect at comparable dilutions (lower IC₅₀), while the 2:1 batch exhibited higher viability at lower concentrations, suggesting better tolerance at dilute levels.
Table 8 MTT-based in vitro cytotoxicity evaluation of gemcitabine niosomes (2:1 and 3:1) using OD at 570 nm and % cell viability
Stability Study
The optimized niosomal formulation was subjected to a centrifugation stress test at 4000 rpm for 15 min to assess physical stability. The formulation was then divided into three test tubes and stored at 4°C, 27°C, and 45°C for 90 days. At predetermined intervals, samples were visually examined for changes in physical appearance. Throughout the study period, the formulation showed no phase separation and no change in color under all storage conditions, indicating good physical stability.
CONCLUSION
In this study, gemcitabine-loaded niosomes were successfully developed and optimized for inhalable delivery using a systematic design approach. The optimized batch (OBGEM 2; T80:S80 = 2:1) exhibited nanoscale particle size (~184 nm), a sufficiently negative zeta potential (−27.3 mV), and a pH of 6.7, which is suitable for nebulization and compatible with the targeted lung environment. The formulation demonstrated high drug entrapment efficiency (90%) and favorable physicochemical properties such as near-water density and reduced surface tension, supporting efficient aerosol generation.
Model-based optimization was validated through checkpoint batches showing low prediction errors, confirming the reliability of the developed regression model within the design space. TEM analysis confirmed the formation of spherical vesicular structures at the nanoscale, supporting the DLS findings. The optimized formulation also showed good aerosol output performance compared with water and maintained physical stability without phase separation or color change under different storage conditions over 90 days. Furthermore, the formulation exhibited notable biological activity, including a clear zone of inhibition and concentration-dependent cytotoxicity in the MTT assay, indicating its potential therapeutic relevance. Overall, the optimized gemcitabine niosomes represent a promising platform for pulmonary delivery and warrant further in vivo evaluation for lung cancer therapy.
CONFLICT OF INTEREST
The authors disclose that they have no conflicting financial interests.
ACKNOWLEDGEMENT
Authors would like to thank Dr. Vineet C. Jain and Bhagwan Mahavir college of Pharmacy for offering research facility that is required in this study. We also thanks to Dr. Zarana Dedania and Dr. Ronak Dedania for providing all technical guidance.
REFERENCES

Araf Mahefuzabibi Hidayat, Dr. Ronak Dedania, Quality by Design-Based Optimization of Gemcitabine Niosomes for Aerosolized Pulmonary Delivery, Int. J. of Pharm. Sci., 2026, Vol 4, Issue 6, 2012-2027. https://doi.org/10.5281/zenodo.20594953
 10.5281/zenodo.20594953