
We use cookies to ensure our website works properly and to personalise your experience. Cookies policy
Noble Pharmacy College, Faculty of Pharmacy, "Parth-Vatika", Junagadh- Bhesan Road, Via. Vadal, Nr. Bamangam, Junagadh - 362310, Gujarat, INDIA.
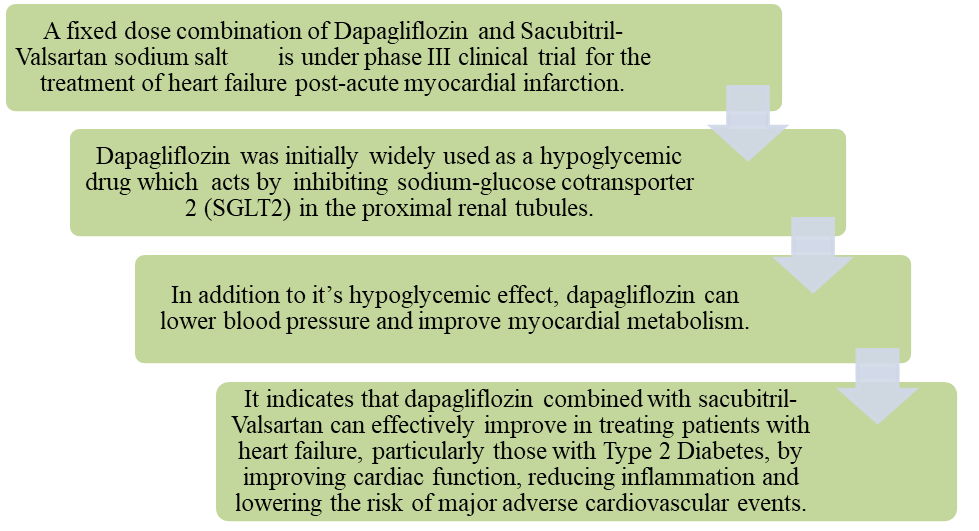
A simple, precise, accurate, and robust Reverse Phase High Performance Liquid Chromatographic (RP-HPLC) method was developed and validated for the simultaneous estimation of Dapagliflozin and Sacubitril–Valsartan sodium complex salt in a synthetic mixture. The method development was carried out to achieve effective separation and quantification of both drugs within a short analytical run time. Various chromatographic conditions such as mobile phase composition, pH, flow rate, and detection wavelength were optimized to obtain satisfactory peak resolution and system suitability parameters.Chromatographic separation was achieved using an RP-HPLC system with an appropriate C18 column and optimized mobile phase under isocratic conditions. The developed method was validated according to ICH guidelines for parameters including specificity, linearity, accuracy, precision, robustness, limit of detection (LOD), and limit of quantification (LOQ). The calibration curves for both Dapagliflozin and Sacubitril–Valsartan showed good linearity within the selected concentration ranges with acceptable correlation coefficients. Accuracy studies demonstrated satisfactory recovery values, while precision studies confirmed the reproducibility of the method with low %RSD values.The developed RP-HPLC method was found to be specific, sensitive, reliable, and suitable for routine quantitative analysis of Dapagliflozin and Sacubitril–Valsartan sodium complex salt in synthetic mixtures. Therefore, the proposed method can be effectively applied for quality control and analytical studies in pharmaceutical formulations
Dapagliflozin
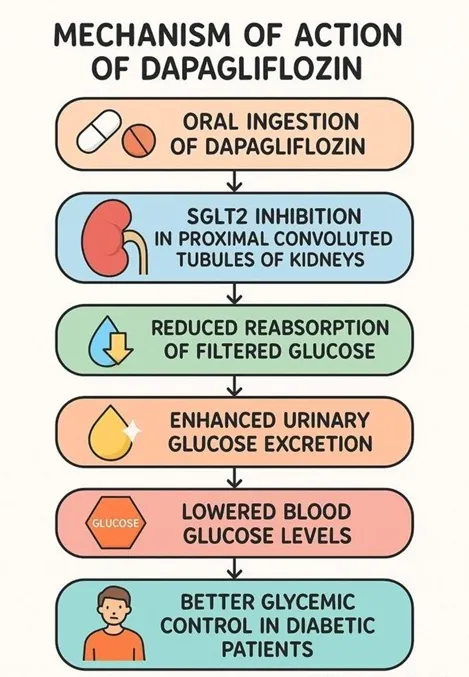
SGLT2 inhibitors are a recently developed class of glucose-lowering medications that are widely used for treating patients with type 2 diabetes mellitus. [1,2,3 SGLT2 inhibitors exert their pharmacological effect by selectively suppressing renal glucose reabsorption within the proximal tubular segments of the nephron through inhibition of the sodium–glucose cotransporter-2 system. This action enhances urinary glucose clearance, thereby reducing circulating glucose concentrations via an insulin-independent pathway. Due to this distinct mechanism, SGLT2 inhibitors demonstrate strong compatibility with other antihyperglycemic therapies and are frequently incorporated into combination regimens, including those involving insulin, to achieve improved glycemic control. DAP (DAP) is a well-established agent within this class and has obtained regulatory approval for the treatment of type 2 diabetes mellitus in numerous global markets, including Europe and the United States. Its pharmacological profile and clinical efficacy in adult populations have been comprehensively evaluated and reported in prior scientific literature. [4]
❖ Selective SGLT2 inhibition in proximal tubules
DAP specifically inhibits the SGLT2 transporter in the early proximal convoluted tubule of the kidney.
❖ Reduced renal glucose reabsorption
Normally responsible for about 90% of filtered glucose reabsorption, inhibition leads to elevated urinary glucose excretion (glucosuria).
❖ Osmotic diuresis and natriuresis
Excretion of glucose pulls water and sodium prematurely into the urine, decreasing plasma volume and blood pressure.
2 Sacubitril-Valsartan complex salt
SVN (SVN), recognized as the first angiotensin receptor–neprilysin inhibitor (ARNI) authorized by the U.S. Food and Drug Administration, has demonstrated significant clinical benefits in patients with chronic heart failure characterized by reduced ejection fraction. Its use is associated with a decreased incidence of cardiovascular mortality and heart failure– related hospital admissions, along with notable improvement in symptomatic status. In addition to these established effects, emerging evidence suggests that this combination therapy may also exhibit antiarrhythmic properties.[7]. The exact mechanism underlying the reduction in mortality from malignant ventricular arrhythmias by sacubitril/valsartan has not been fully clarified. Evidence from multiple studies suggests that the development of ventricular arrhythmias is closely linked to myocardial fibrosis. SVN is thought to attenuate arrhythmic events by modulating key biological pathways, including those involving B-type natriuretic peptides, angiotensin II, and bradykinin.
Efficacy of SVN in cardiorenal syndrome (CRS):
The therapeutic effectiveness of SVN in patients with cardiorenal syndrome (CRS), particularly those presenting with heart failure and renal impairment, has been evaluated with respect to glomerular filtration parameters. Clinical evidence indicates that this combination therapy can attenuate the rate of decline in estimated glomerular filtration rate (eGFR), with comparatively greater benefits observed in patients below 65 years of age. In a study conducted by Spannella et al., 54 consecutive outpatients with heart failure and reduced left ventricular ejection fraction (LVEF) were assessed following initiation of SVN therapy. Over the follow-up period, a reduction in systolic blood pressure was noted, while LVEF showed only modest improvement. Importantly, renal function demonstrated significant enhancement after 12 months when compared with historical controls, particularly among younger individuals and those with underlying chronic kidney disease.
SVN has been incorporated into established heart failure management guidelines and is considered a safe and effective pharmacological option. Supporting this, Chang et al. evaluated 466 patients with heart failure and reduced ejection fraction (HFrEF) receiving SVN against an equal number of patients treated with conventional therapy without ARNI. The findings suggested superior therapeutic outcomes with SVN, including in patients exhibiting advanced renal dysfunction secondary to CRS.
MATERIALS AND METHODS:
5.1 Instruments:
Table 5.1: List of Instrumnets
|
Sr. No. |
Name of Equipment/ Instrument |
Manufacturer |
|
1 |
UV Spectrophotometer |
Shimadzu UV-1700 double-beam UV-VIS spectrophotometer Software: UV Probe |
|
2 |
HPLC |
Make: Shimadzu Model:- LC 2010 CHT Injector: 100 μL fixed loop. Detector: PDA Detector Software: LC Solution |
|
3 |
Analytical balance |
Sartorius Analytical Balance Accuracy: 0.001 g |
|
4 |
pH Meter |
Lab India Digital pH Meter |
|
5 |
Melting Point Apparatus |
Lab Junction Melting Point Apparatus |
|
8 |
FT-IR |
Agilent Cary 630 FTIR Spectrometer Software: MicroLab Expert |
5.2 Chemicals & Reagents
Table 5.2 : List of Chemical and Reagents
|
Sr. No |
REAGENTS |
GRADE |
MAKERS |
|
1 |
Water |
MiliQ water |
- |
|
2 |
Methanol |
HPLC Grade |
Merck Life Science Pvt. Ltd. |
|
3 |
Acetonitrile |
HPLC Grade |
Merck Life Science Pvt. Ltd. |
|
4 |
Ortho Phosphoric acid |
HPLC Grade |
Merck Life Science Pvt. Ltd. |
|
5 |
Potassium Dihydrogen Ortho Phosphate |
AR Grade |
Avantorscience Ltd. |
5.3 Identification of API:
The identity of the drug substances was confirmed through comparison of their infrared (IR) spectra with corresponding reference standards, complemented by evaluation of physicochemical parameters such as melting point and solubility.
5.4.2 Determination of Melting Point
The prepared sample was introduced into a capillary tube and placed in a digital melting point apparatus. The temperature at which the sample transitioned from solid to liquid was recorded as its melting point.
5.4.3 IR Spectra of Drug:
• Identification of DAP, SAC and VAL was carried out using infrared spectroscopy by comparing their spectra with those of standard reference materials.
• For sample preparation, the drug substances were finely powdered to ensure particle size was sufficiently small to allow effective transmission of IR radiation. The powdered samples were then dispersed in a suitable medium (e.g., Nujol) and placed between KBr plates for analysis. Each sample was examined individually.
• The characteristic absorption peaks obtained were recorded and interpreted from the IR spectra.
5.5 HPLC Method Development:
The development of a reliable and sensitive RP-HPLC method involved systematic optimization of key chromatographic parameters. The following factors were investigated:
5.5.1 Selection of Column:
The chromatographic behavior of DAP, SAC and VAL was evaluated using a Cosmosil C18 column (250 mm × 4.6 mm, 5 µm), selected based on their polarity and compatibility with reversed-phase conditions.
5.5.2 Selection of Diluents:
DAP, SAC and VAL analytes exhibited good solubility in methanol; therefore, methanol was chosen as the diluent for preparation of all standard and sample solutions.
5.5.3 Selection of Wavelength:
The optimal detection wavelength was determined by scanning the drug solutions over a range of 200–400 nm using a UV spectrophotometer. The wavelength providing maximum absorbance was identified as 228 nm and selected for analysis.
5.5.4 Selection of Mobile Phase:
The composition of the mobile phase was optimized by considering factors such as solvent type, buffer selection, pH, and their respective ratios. The physicochemical properties of the analytes, including solubility and molecular characteristics, were also taken into account. Buffers were incorporated to maintain a stable pH environment during analysis.
It is generally observed that acidic compounds exhibit improved retention under lower pH conditions, whereas basic compounds show enhanced retention at higher pH values. Various mobile phase compositions were evaluated through iterative trials, and system suitability parameters such as theoretical plate count, tailing factor, peak symmetry, and resolution were monitored to achieve optimal chromatographic performance.
5.5.5 Selection of pH:
The pH of the mobile phase plays a critical role in analyte separation. For most HPLC applications, an effective pH range lies between 2 and 8, within which optimal separation can typically be achieved.
5.6 Preparation of Solutions:
5.6.1 DAP Stock solution (50 µm/ml): Accurately weighed 50 mg of DAP working standard was transferred into a 100 mL volumetric flask. Approximately 50 mL of methanol was added, and the solution was sonicated for 5 minutes to ensure complete dissolution. The volume was then adjusted to the mark with methanol. A further dilution was prepared by transferring 5 mL of this solution into a 50 mL volumetric flask and diluting to volume with methanol.
5.6.2 SAC stock solution (970 µm/ml): About 970 mg of sacubitril was accurately weighed and transferred into a 100 mL volumetric flask. Methanol was added followed by sonication for 5 minutes. The final volume was adjusted with methanol. A further dilution was prepared by transferring 10 mL of this solution into a 100 mL volumetric flask and diluting to volume with methanol.
5.6.3 VAL stock solution (1030 µm/ml): About 1030 mg of Valsartan was accurately weighed and transferred into a 100 mL volumetric flask. Methanol was added followed by sonication for 5 minutes. The final volume was adjusted with methanol. A further dilution was prepared by transferring 10 mL of this solution into a 100 mL volumetric flask and diluting to volume with methanol.
5.6.3 Mixed standard solution (5 µm/ml DAP + 97 µm/ml SAC+ 103 µm/ml VAL): Aliquots of 1 mL each from the respective stock solutions of DAP, SAC and VAL were transferred into a 10 mL volumetric flask. The volume was made up to the mark with methanol, followed by sonication for 5 minutes to ensure uniform mixing.
5.6.4 Preparation of Synthetic mixture:SAMPLE PREPARATION:
Synthetic mixture was prepared for 10 tablets.[39-40]
Table No. 5.3 : Preparation of Synthetic mixture
|
Ingredient |
Role in Formulation |
Mg/Tablet |
Mg taken for 10 Tablets |
|
DAP |
Active pharmaceutical ingredient (SGLT2 inhibitor) |
05.00 |
50.00 |
|
SAC |
Active pharmaceutical ingredient (NEP inhibitor + ARB) |
97.00 |
970.00 |
|
VAL |
Active pharmaceutical ingredient (ARB) |
103.00 |
1030.00 |
|
Microcrystalline cellulose (pH-101) |
Diluent / filler |
90.00 |
900.00 |
|
Anhydrous lactose |
Diluent |
40.00 |
400.00 |
|
Low substituted hydroxypropyl cellulose (L-HPC) |
Binder / disintegrant |
12.00 |
120.00 |
|
Crospovidone |
Disintegrant |
6.00 |
60.00 |
|
Colloidal silicon dioxide |
Glidant |
3.00 |
30.00 |
|
Magnesium stearate |
Lubricant |
4.00 |
40.00 |
|
Total |
|
360 |
3600 |
Sample Stock: Synthetic mixture 360 mg (equivalent to 5 mg DAP + 97 mg SAC + 103 MG VAL) was weighed on butter paper. Powder was then transferred to 100 mL volumetric flask. To this 30 mL methanol was added and active contents were extracted in sonication for 15 minutes. The flask was allowed to cool down on room temperature and then the volume was made with methanol. The solution was then filtered through 0.45 µ Whatman PVDF syringe filter.
Sample (05 µm/ml DAP + 97 µm/ml SAC + 103 µm/ml VAL ): An aliquot of 1 mL of the filtered solution was transferred into a 10 mL volumetric flask and diluted to volume with the selected diluent to obtain the final sample solution.
5.7 Trials of Method Development:
Table 5.4 : List of MP various trials for HPLC
|
Sr. No. |
Mobile phase |
Ratio |
Injection Volume |
Comment |
|
1 |
Water:Methanol |
50:50 % v/v |
10 µL |
No peaks were seen. |
|
2 |
Water:Methanol |
25:75 % v/v |
10 µL |
All three peaks observed. First peak broad and distorted with less than 2000 theoretical plates. |
|
3 |
Water:ACN |
60:40 % v/v |
10 µL |
ACN used. ACN has higher solvent strength hence started with lower volumes. No peak observed till 20 minutes. |
|
4 |
Water:ACN |
50:50 % v/v |
10 µL |
All three peaks eluted. Elution order changed due to change in selectivity. Last two peaks broad and with peak fronting. |
|
5 |
Buffer:ACN |
50:50% v/v |
10 µL |
To control pH of the solution, buffer was used. pH of buffer |
|
|
|
|
|
selected 2.0 leaving ± 1.5 units from pKa of all three analytes. Three sharp peaks seen. Last peak near the end of chromatography run. |
|
6. |
Buffer:ACN |
40:60 % v/v |
10 µL |
ACN ratio optimized for early elution of analytes. |
|
7 |
Buffer: ACN |
40:60 % v/v |
20 µL |
Method also optimized by increasing injection volume so that peak height can be higher. |
Table 5.5 Optimization of RP-HPLC chromatographic condition
|
Sr.No |
Chromatographic Parameter |
Optimize Condition |
|
1 |
Column |
Inertsil ODS 3V (250 mm x 4.6 mm X 5 µm) |
|
2 |
Mobile phase composition |
Buffer (pH 2.0):ACN (40:60 % v/v) |
|
3 |
Wavelength |
228 nm |
|
4 |
Flow rate |
1.0 mL/min |
|
5 |
Temperature |
Ambient |
|
7 |
Injection Volume |
15 µL |
5.8 System Suitability Criteria(n=5) :
• System suitability was assessed by performing five consecutive injections of a standard solution containing DAP (05 µg/mL), SAC (97 µg/mL) and VAL (103 µg/mL) under optimized chromatographic conditions.
• The chromatographic system was considered acceptable when the resolution between adjacent peaks exceeded 2.
• The efficiency of the column was evaluated through theoretical plate count, which was required to be greater than 2000, while peak symmetry was assessed using the asymmetry factor, expected to be below 1.5.
• The capacity factor (k′) was maintained within the range of 1 to 10 to ensure adequate retention.
• The selectivity or separation factor (α) was required to be greater than 1, indicating effective differentiation between analyte peaks.
5.9 Method Validation:
5.9.1 The developed RP-HPLC method was validated in accordance with ICH Q2 (R2) guidelines by evaluating parameters including linearity, specificity, accuracy, precision, detection limit (DL), quantification limit (QL), and robustness.
5.9.2 Linearity (n=5):
Calibration standards were prepared by transferring appropriate aliquots from the standard stock solution (SSS) into a series of 10 mL volumetric flasks and diluting to volume with methanol. Concentration ranges of 5–15 µg/mL for DAP and 100–300 µg/mL for SAC and VAL were obtained. Calibration curves were constructed by plotting peak area against corresponding concentrations for both analytes.
5.9.3 Specificity (n=6):
Specificity was evaluated by analyzing diluent, placebo (excipients), and standard solutions to assess potential interference at the retention times of the analytes. Standard solutions containing DAP (05 µg/mL), sacubitril (97 µg/mL) and valsartan (103 µg/mL) were analyzed. Additionally, placebo samples spiked with known amounts of analytes were examined to determine any interference from excipients or related impurities.
5.9.4 Accuracy (n=3):
• Accuracy of the method was verified through recovery studies using the standard addition technique at three concentration levels: 50%, 100%, and 150%.
• A placebo mixture containing all excipients (excluding active drugs) was prepared and treated similarly to the formulation. An amount equivalent to one tablet weight was transferred into a 100 mL volumetric flask, dissolved in methanol with sonication, diluted to volume, and filtered to obtain placebo stock solution.
50% Level:
• Appropriate quantities of DAP (5 mg) and sacubitril–valsartan (100 mg) were added to the placebo solution, dissolved, and diluted to obtain intermediate concentrations. A further dilution yielded final concentrations of 5 µg/mL and 100 µg/mL, respectively. The solution was filtered and analyzed in triplicate.
100% Level:
• Standard additions equivalent to 10 mg DAP and 25 mg sacubitril–valsartan were prepared and processed similarly to obtain final concentrations of 10 µg/mL and 200 µg/mL, respectively. Analysis was performed in triplicate.
150% Level:
• Standard additions of 15 mg DAP and 30 mg sacubitril–valsartan were used to prepare final concentrations of 15 µg/mL and 300 µg/mL, respectively. Each sample was analyzed in triplicate.
5.9.5 Precision:
I. Repeatability (n=6):
• A working solution containing DAP (10 µg/mL) and sacubitril–valsartan (200 µg/mL) was prepared from the stock solution. Six replicate injections were performed, and the peak areas were recorded. Precision was expressed as % relative standard deviation (%RSD).
II. Intraday Precision (n=3):
• Samples at 50%, 100%, and 150% levels (5, 10, and 15 µg/mL for DAP; 100, 200, and 300 µg/mL for sacubitril–valsartan) were analyzed three times within the same day. The %RSD was calculated to evaluate repeatability within a single day.
III. Interday Precision (n=3):
• The same concentration levels were analyzed on different days to assess variability over time. %RSD values were calculated to determine method consistency across days.
5.9.6 DL and QL:
• The DL and QL for both analytes were estimated using statistical calculations based on the standard deviation of the response and slope of the calibration curve.
5.9.7 Robustness :
• Robustness was assessed by introducing small, deliberate variations in chromatographic conditions such as flow rate, detection wavelength, column temperature, and mobile phase composition. The effect of these variations on system performance was evaluated to determine method reliability.
5.9.8 Assay of synthetic mixture (n=6):
• For assay determination, accurately weighed quantities of DAP (10 mg) and SVN (200 mg), along with appropriate excipients, were transferred into a 100 mL volumetric flask. The mixture was dissolved in diluent with sonication and diluted to volume.
• The solution was filtered through a 0.45 µm membrane filter, and an aliquot of 1 mL was further diluted to 10 mL with mobile phase to obtain final concentrations of 10 µg/mL for DAP and 200 µg/mL for sacubitril–valsartan. This solution was used for assay analysis.
SUMMARY AND CONCLUSION
• A reverse-phase high-performance liquid chromatography (RP-HPLC) method was successfully developed for the simultaneous determination of DAP and sacubitril– valsartan.
• The proposed analytical procedure enabled effective separation of both analytes and was subsequently validated in accordance with ICH Q2 (R2) guidelines.
Table 7.1 Summary of Validation Parameters of RP-HPLC method
|
Parameters |
Result |
||
|
DAP |
SAC |
VAL |
|
|
Linearity Regression equation (R2) |
5-15 (µg/mL) 0.9983 |
100-300 (µg/mL) 0.9999 |
100-300 (µg/mL) 0.99816 |
|
Accuracy |
99.70-101.90 % |
98.40-99.07% |
98.1-101.90 |
|
DL |
0.34 µg/mL |
1.04 µg/mL |
12.92 µg/mL |
|
QL |
1.04 µg/mL |
27.53 µg/mL |
35.15 µg/mL |
|
Precision |
RSD was found to be less than 2 RSD was found to be less than 2 |
||
|
Robustness |
|||
REFERENCES
Medindia (2025). Drug information portal. Available at https://www.medindia.net (Accessed on 21 November 2025).
United States Pharmacopeia (2023). United States Pharmacopeia 43 NF 41.
Res J Pharm Technol. 14(11):5797–5802.
Medindia (2025). Drug information portal. Available at https://www.medindia.net (Accessed on 21 November 2025).
United States Pharmacopeia (2023). United States Pharmacopeia 43 NF 41.
Res J Pharm Technol. 14(11):5797–5802.


Zala Dhaval Ramshibhai, Dhirendra Kumar Tarai, Dr. Basareddy Chandrasekhar, Dr. Santosh Kirtane, RP-HPLC Method Development and Validation for Simultaneous Estimation of Dapagliflozin and Sacubitril-Valsartan Sodium Complex Salt in Synthetic Mixture, Int. J. of Pharm. Sci., 2026, Vol 4, Issue 6, 1799-1809, https://doi.org/10.5281/zenodo.20588757
 10.5281/zenodo.20588757