
We use cookies to ensure our website works properly and to personalise your experience. Cookies policy
S.G.S.P.S Institute of Pharmacy, Kaulkhed, Akola-444001 (MS) India.
A simple, accurate, precise, and economical Reverse Phase High-Performance Liquid Chromatography (RP-HPLC) method was developed and validated for the simultaneous estimation of Cilnidipine (CIL) and Telmisartan (TEL) in bulk drug substances and pharmaceutical dosage forms. The chromatographic separation was achieved using an Inertsil C18 column (4.6 mm × 250 mm, 5 ?m particle size) as the stationary phase. The optimized mobile phase consisted of Methanol: Buffer (65:35, v/v) adjusted to pH 3.5, delivered at a flow rate of 1.0 mL/min under ambient temperature conditions. Detection was carried out at 245 nm using a UV detector was employed throughout the analysis. The developed method provided satisfactory separation of Cilnidipine (CIL) and Telmisartan (TEL) with well-resolved, symmetrical peaks and acceptable retention times. The method was validated according to ICH guidelines for parameters including specificity, linearity, accuracy, precision, robustness, limit of detection (LOD), limit of quantitation (LOQ), and system suitability. The calibration curves for both drugs exhibited excellent linearity over the selected concentration ranges with correlation coefficients (r²) greater than 0.999. Accuracy studies performed by recovery experiments demonstrated recoveries within the acceptable range of 98–102%, confirming the reliability of the method. Precision studies showed low percentage relative standard deviation (%RSD) values, indicating good repeatability and intermediate precision. Robustness evaluation revealed that minor deliberate variations in chromatographic conditions did not significantly affect the analytical performance. The proposed RP-HLC method was successfully applied to the quantitative determination of Cilnidipine and Telmisartan in marketed pharmaceutical formulations, yielding assay values within acceptable limits. Therefore, the developed method can be effectively employed for regular pharmaceutical analysis and quality assurance purposes
High-performance liquid chromatographic (HPLC) is the most frequently applied technique in the determination of drugs in biological fluids and dosage forms. We believe that the availability of this new method, with increased simplicity, sensitivity and selectivity, will be very useful for the determination of Cilnidipine (CIL) and Telmisartan (TEL) in API and pharmaceutical preparations. This gradient HPLC method uses a simple mobile phase and does not require complicated sample preparation. The aim of this study was to develop a simple, rapid and reproducible reversed-phase HPLC method. Hypertension is one of the most prevalent cardiovascular disorders worldwide and remains a major risk factor for stroke, myocardial infarction, heart failure, and chronic kidney disease. Effective management of hypertension often requires combination therapy involving drugs with complementary mechanisms of action to achieve optimal blood pressure control and reduce cardiovascular morbidity and mortality. Among the available antihypertensive agents, Cilnidipine and Telmisartan have gained considerable clinical importance due to their efficacy, safety profile, and beneficial effects on target organ protection.
Cilnidipine is a fourth-generation dihydropyridine calcium channel blocker that inhibits both L-type and N-type calcium channels. By blocking calcium influx into vascular smooth muscle cells, it produces vasodilation and lowers peripheral vascular resistance, thereby reducing blood pressure. In addition, inhibition of N-type calcium channels suppresses sympathetic nerve activity, resulting in improved cardiovascular and renal protection. Telmisartan, on the other hand, is an angiotensin II receptor blocker (ARB) that selectively blocks the angiotensin II type-1 (AT1) receptor, leading to vasodilation, reduced aldosterone secretion, and decreased blood pressure. The combination of Cilnidipine and Telmisartan provides synergistic antihypertensive activity and is widely prescribed for the management of essential hypertension.
The increasing use of fixed-dose combination formulations containing Cilnidipine (CIL) and Telmisartan (TEL) necessitates the development of reliable analytical methods for their simultaneous estimation in bulk drugs and pharmaceutical dosage forms. Accurate analytical methods are essential for quality control, formulation development, stability assessment, and regulatory compliance. High-performance liquid chromatography (HPLC) is one of the most widely employed analytical techniques in pharmaceutical analysis because of its high sensitivity, selectivity, precision, and reproducibility. Reverse-phase HPLC (RP-HPLC), in particular, offers efficient separation of compounds with varying physicochemical properties and is routinely utilized for quantitative drug analysis.
Although several analytical methods have been reported for the individual determination of Cilnidipine (CIL) and Telmisartan (TEL), there remains a need for a simple, rapid, precise, and cost-effective RP-HPLC method suitable for routine quality control analysis of their combined dosage forms. The development of an optimized chromatographic method requires careful selection of stationary phase, mobile phase composition, pH, flow rate, and detection wavelength to achieve adequate resolution, peak symmetry, and analytical performance.
2. EXPERIMENTAL
2.1 Materials
TEL & CIL was supplied by MG Lab India Pvt Ltd and Sodium hydroxide was purchased from Molychem (Mumbai). Hydrochloric acid and hydrogen peroxide was procured from LOBA Chemie Pvt. Ltd. (Mumbai). HPLC grade methanol and acetonitrile was purchased from S. D. Fine-chem Ltd. (Mumbai) whereas HPLC grade water was purchased from Merck Ltd. All other chemicals were of analytical reagent grade. Telma-LN marketed formulation (manufactured Glenmark Pharmaceutical Ltd India.) were purchased from Local market.
2.2 Chemical structure :

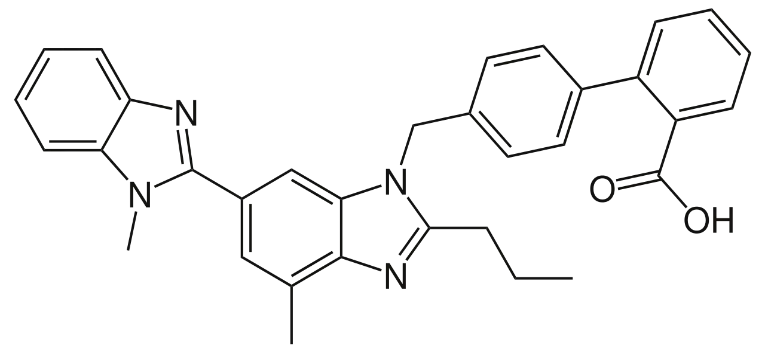
Fig. 1 Structure of Cilnidipine Fig. 2 Structure Telmisartan
2.3 Instrumentation
The HPLC system consisting of Waters India model no 510 isocratic HPLC pump Spectra System with UV detector of Spectra System, manual rheodyne injection system, the software was an Data ace software version 6.1. The chromatographic separation was performed using Intersil C18 (250mm × 4.6 mm i.d., 5mm particle size) Separation was achieved using a mobile phase consisting of Methanol: Buffer in the ratio of (65:35) pH 3.5 at a flow rate of 1ml/min and UV detection at 245 nm. The column was maintained at ambient temperature with injection volume of 20 µl. The mobile phase was filtered through 0.45 µm Chrom Tech Nylon-66 filter and degassed in ultrasonic bath prior to use. A blank chromatogram was recorded before the studies. Quantization of result was performed using peak area counts.
2.4 Standard preparation
TEL standard solution:
Accurately weighed quantity 10 mg of TEL was dissolved in mobile phase and volume was made up to 100 ml mark. The stock standard solution was diluted further with mobile phase to get final concentration of about 40 mg/ml of TEL.
CIL standard solution:
Accurately weighed quantity 10 mg of CIL was dissolved in mobile phase and volume was made up to 100ml mark. The stock standard solution was diluted further with mobile phase to get final concentration of about 20 mg/ml of CIL.
2.5 System suitability test:
System suitability is a pharmacopoeial requirement and is used to verify, whether the resolution and reproducibility of the chromatographic system are adequate for analysis to be done. The tests were performed by collecting data from five replicate injections of standard solutions.
2.6 Application of proposed method for estimation of TEL and CIL Laboratory mixture
Three different laboratory mixtures of TEL and CIL were prepared by appropriately weighing the quantities of drug samples so as to get the concentration of 40 mg/ml of TEL and 20 mg/ml of CIL.
The peak area of standard laboratory mixture and sample laboratory mixture was compared to obtain the concentration.
2.7 Application of proposed method for estimation of TEL and CIL in formulation:
The twenty tablets were weighed, and then average weight was determined and finely grounded. The weight of the powdered tablet equivalent to 100 mg of TEL and 50 mg of CIL were transferred into a 100 mL standard volumetric flask. Added 50 mL of solvent sonicated for 10 min and diluted to 100 mL with the same solvent and then filtered through Whatmann filter paper No: 41.
RESULT & DISCUSSION:
3.1 Preparation of Calibration Curve: -
The mobile phase was allowed to equilibrate with the stationary phase until steady baseline was obtained. The series of concentration from mg/ml for 5-50 mg/ml TEL and 3-30 mg/ml for CIL drug solutions were injected and peak area was recorded. The graph plotted as the concentration of the drug Vs peak area depicted in Fig. No.3 and 4.
3.2 Method Validation
3.2.1 Specificity (Selectivity)
Specificity was measured as ability of the proposed method to obtain well separated peak for TEL and CIL without any interference from component of matrix.
Mean retention time for –
TEL – 3.981
CIL – 6.543
The values obtained were very close to that in standard laboratory mixture indicates no interference from the component of matrix.
Typical chromatogram is shown in the Fig. No.5
3.2.2. Accuracy and precision
It was ascertained on the basis of recovery studies performed by standard addition method. The results of recovery studies and statistical data are recorded in Table No. 3 Precision of an analytical method is expressed as S.D or R.S.D of series of measurements. It was ascertained by replicate estimation of the drugs by proposed method.
3.2.3 Ruggedness:
The studies of ruggedness were carried out under two different conditions-
a) Days
b) Analyst.
a) Interday (Different days):
Same procedure was performed as under marketed formulation analysis on different days. The % label claim was calculated. Data obtained for day 1, day 2, and day 3 is shown in Table No. 4
b) Different analyst:
The sample solution was prepared by two different analysts and same procedure was followed as described earlier. The % label claim was calculated as done in marketed formulation estimation.
Tables:
Table No1 . : Summary of system suitability test results
|
Sr. no. |
Parameter |
TEL |
CIL |
|
1. |
Peak area |
170710.3 |
81861.93 |
|
2. |
Retention time (min) |
3.951 |
6.491 |
|
3. |
Asymmetry |
1.110 |
1.819 |
|
4. |
Efficiency |
111593.36 |
67402.53 |
*Results are mean of five replicates
Table No. 2: Summary of laboratory mixture and marketed formulation analysis by RP-HPLC Method
|
Sr. no. |
Sample |
Statistical data |
% Estimation |
% Recovery |
||
|
TEL |
CIL |
TEL |
CIL |
|||
|
1. |
Standard Laboratory mixture |
Mean |
100.20 |
100.10 |
- |
- |
|
S.D. |
0.265 |
0.436 |
- |
- |
||
|
C.V. |
0.003 |
0.004 |
- |
- |
||
|
2. |
Telma-LN |
Mean |
100.87 |
101.17 |
100.37 |
100.22 |
|
S.D. |
0.321 |
0.306 |
0.548 |
0.624 |
||
|
C.V. |
0.003 |
0.003 |
0.005 |
0.006 |
||
Table No 3: Summary of validation parameters for the proposed method
|
Validation Parameters |
TEL |
CIL |
|
Linearity μg mL-1 |
5-50 |
3-30 |
|
Accuracy mean |
100.37 |
100.22 |
|
Precision (% RSD) |
0.008 |
0.003 |
Table No 4: Summary of Ruggedness by RP-HPLC method
|
Parameter |
Statistical data |
% Estimation by RP-HPLC method |
|
|
TEL |
CIL |
||
|
Interday |
Mean |
99.97 |
100.10 |
|
S.D. |
0.321 |
0.436 |
|
|
C.V. |
0.003 |
0.004 |
|
|
Intraday |
Mean |
100.63 |
100.10 |
|
S.D. |
0.321 |
0.436 |
|
|
C.V. |
0.003 |
0.004 |
|
|
Different analyst |
Mean |
100.06 |
99.9 |
|
S.D. |
0.320936131 |
0.254950976 |
|
|
C.V. |
0.003207437 |
0.002552062 |
|
Table No.5: Result and statistical data of Different analyst study
|
Sr. No. |
% Label claim |
|||
|
ANALYST I |
ANALYST II |
|||
|
TEL |
CIL |
TEL |
CIL |
|
|
1 |
99.9 |
99.7 |
99.9 |
99.7 |
|
2 |
100.3 |
99.6 |
100.1 |
99.6 |
|
3 |
100.4 |
100.8 |
99.6 |
100.1 |
|
4 |
100.5 |
100.9 |
100.3 |
100.2 |
|
5 |
101 |
101.1 |
100.4 |
99.9 |
|
Mean |
100.42 |
100.42 |
100.06 |
99.9 |
|
± S.D |
0.396232255 |
0.712039325 |
0.320936131 |
0.254950976 |
|
C.V |
0.00394575 |
0.007090613 |
0.003207437 |
0.002552062 |
Table No.6: Observations of Linearity and range study for SORA.
|
Sr. No. |
%Label claim |
Peak area |
|
|
TEL |
CIL |
||
|
1 |
80 |
137892 |
65951 |
|
2 |
90 |
155128 |
74195 |
|
3 |
100 |
172365 |
82439 |
|
4 |
110 |
189601 |
90682 |
|
5 |
120 |
209838 |
99926 |
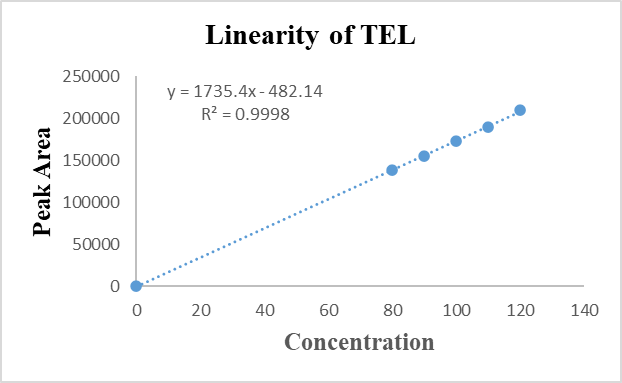
Fig. No.3: -Plot of linearity and range study for TEL
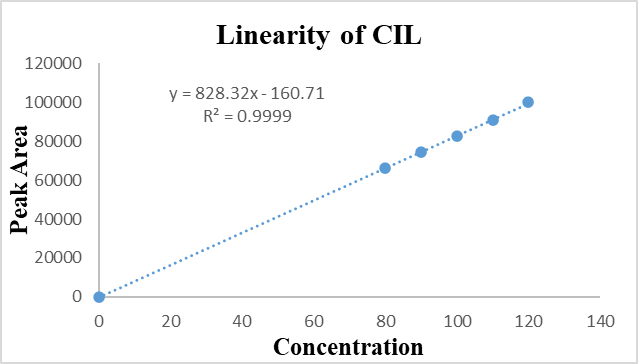
Fig. No.4: -Plot of linearity and range study for CIL
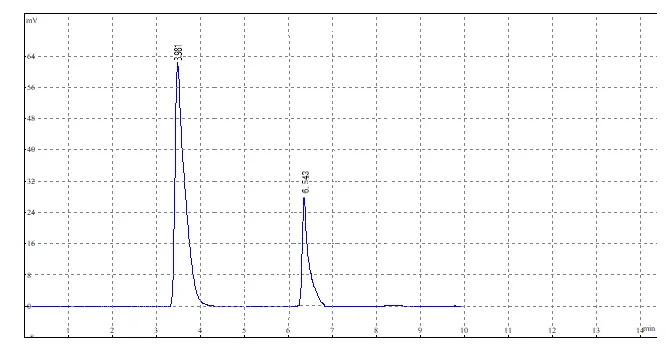
Fig. No.5: Chromatogram obtained by formulation of TEL & CIL
REFERENCES


Yashasvi Kale, L. R. Gandhi, N. S. Bhajipale, RP-HPLC Method Development & Validation for The Simultaneous Estimation of Cilnidipine & Telmisartan in Bulk & It’s Pharmaceutical Dosage Form, Int. J. of Pharm. Sci., 2026, Vol 4, Issue 6, 534-541, https://doi.org/10.5281/zenodo.20508029
 10.5281/zenodo.20508029