
We use cookies to ensure our website works properly and to personalise your experience. Cookies policy
1 Department of Rasashastra and Bhaishajya Kalpana. KAHER’S Shri B M Kankanawadi Ayurveda Mahavidyalaya Shahapur, Belagavi Department of Pharmaceutical Chemistry, MAEER Pune’s, MAEER Pune’s, Maharashtra Institute of Pharmaceutical Sciences, Latur Vishwanathpuram, Ambajogai Road, Latur-413531.
2Department of Pharmaceutical Quality Assurance, Sinhgad Technical Education Society's, Sinhgad Institute of Pharmacy, Narhe, Maharashtra, 411041 India.
A new simple, rapid accurate and precise high performance thin layer chromatography (HPTLC) method has been developed for estimation of Torsemide in bulk and tablet dosage form and stability indicating parameters are studied by using QbD approach the drug employed for Quality by design-based Box Behnken design by high performance thin layer chromatography method utilizing aluminium plates; pre-coated using silica gel 60F254 as stationary phase. The mobile phase optimized for the separation used with Toluene: Ethyl acetate: Methanol: Glacial Acid (2:7:1:0.1). Densitometric peak quantification was performed at 297nm and coefficient regression, R2=0.9909, retention factors (Rf) were 0.56±0.02 for the drug. Forced degradation of 0.42±0.02 Rf for the NaOH, 0.59±0.02 Rf for the HCL, 0.85±0.02 Rf for the D. W (Distilled Water),0.89±0.02 Rf for the H2O2.The Method was found to be linear in the range 100-500ng/band both area and height. Limit of detection and quantitation was 2.11 and 6.39 respectively. The recovery study was carried out by standard addition method and percentage recovery was found to be 102.2%. Therefore, this method was validated for precision accuracy, specific, and robustness
Torsemide is a loop diuretic drug, chemically it is 3-pyridinesulfoonamide, N-[(1methylethyl) amino] carbonyl]-4-3[(3-methylethyl) amino)-1-Isopropyl- 3[(4-m-toluidino-3-pyridyl) sulfonyl] urea (figure 1). It is in the treatment of hypertension or edema associated with congestive failure heart, renal disease and hepatic disease.
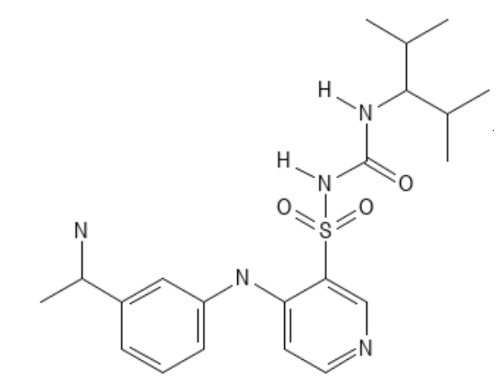
Fig 1: Chemical structure of Torsemide
Literature survey revealed reports on method developed for estimation of Torsemide in bulk and tablet dosage form and combination. Such as the method development with single drug and combination by using HTLC chromatography but, in those studies only chromatography is study, in this research paper also studied the stability-indicating with the different condition also the mobile optimized using quality by design approaches and with various variable change.
Based on all of these presumptions, this research’s goal was to design and evaluate a stability- indicating, HPTLC densitometry assay for Torsemide (TOR) quantification in market formulation. The proposed stability-indicating HPTLC approach for TOR was proven efficient the International Council for Harmonization (ICH)-Q2-R1 requirements.
The QbD concepts are detailed in the International Conference on Harmonization (ICH) rules, namely Q8 (R2): pharmaceutical development. Q9: quality risk management, and Q10: pharmaceutical quality system.The ICH Q10 recommendations provide a complete assessment of pharmaceuticals that should be included at every stage of pharmaceutical manufacture to assure quality, and the QbD principle follows the same approach.The design of the experiment is utilized to validate and adjust significant process variables according to statistical significance. The suitability of the implementation method for the intended goal, as evidenced by its design and the need to periodically assess its performance are the most crucial factors to consider.The present research aimed to develop and validate the HPTLC method for Torsemide in bulk and tablet dosage form by using the QbD approach. The HPTLC method's chromatographic conditions were optimized through the Box-Behnken design in this study for its adaptability in adjusting experimental parameters. The objective was to establish a reliable quality assurance technique based on HPTLC and design principles. This research introduces a high-performance thin-layer chromatographic method for assessing the composition of Torsemide which is characterized by its simplicity, precision, speed, selectivity. The suggested approach underwent refinement and verification in accordance with ICH guidelines.
The first work has been done on this drug, but I am a newbie in this and have obtained good results by using QbD and change in mobile phase. Also, by getting good results from the stability indicating study.
MATERIALS AND METHOD
1. CHEMICAL AND REAGENT
Methanol was used in mobile phase composition and it is also used as a diluent, which was purchased from LOBA CHEMIE PVT Ltd Mumbai. Other chemicals used were Acetonitrile, Acetone and Formic acid of Analytical grade also purchased from LOBA CHEMIE PVT Ltd Mumbai.
2. INSTRUMENTS
High-Performance Thin Layer Chromatography (HPTLC) manufactured by CAMAG was used in the current study. For UV- analysis Double beam UV spectrophotometer model V-630 manufactured by Jasco International Co. Ltd. Japan is used. For functional group detection, FTIR Spectrophotometer (Bruker). For accurate weighing of drug weighing balance model CB-50 is used manufactured by Contech, Pune. For sonication purposes, the UCB-40 Sonicator is used manufactured by Spectra Lab. For drying purposes, a Hot air oven 250 BSS is used and manufactured by Pathak Pvt. Ltd, Mumbai.
3.SELECTION OF OPTIMUM CONDITION FOR THE HPTLC PROCESS
In order to view the appropriate peak for the Torsemide the mobile phase usedToluene: Ethylacetate: Methanol:
Glacial Acid (2:7:1:0.1)was saturation time for the mobile phase is kept for 10 min. Aluminium plates precoated with silica gel 60 F254 (Merck, Ltd. Mumbai.) are used for the application of the sample.
4. PREPARATION OF SOLUTIONS
a. Selection of Wavelength for Determination
The range of 200-400nm was used and a concentration of 1000µg/ml for the determination of the wavelength of the standard solutions of Torsemide. TOR showed maximum absorbance at 297nm which further selected for the analysis.
b. Preparation of standard solution
10mg of Torsemide standard were accurately weighed and transferred into 10ml volumetric flask respectively. About 10ml of methanol was added, sonicated to dissolve. Final concentration of Torsemide were made to 1000µg/ml.
C. Preparation of Sample solution
The marketed formulation of Torsemide manufactured by Cipla Ltd, was available in the local market. The quantity of tablet equivalent to 10mg of Torsemide was transferred into a 10ml volumetric flask. About 10ml methanol was added and the solution was sonicated for 5mins with intermittent shaking. The final concentration of Torsemide was made to 1000µg/ml.
d. Analysis of Marketed Formulation (Tablet)
The sample solution was applied to the TLC plate five times. The plate was developed, scanned in a densitometer and the peak is measured and the % assay was calculated against the peak area of a band of standard solution applied in the same concentration.
5. METHOD DEVELOPMENT AS PER EXPERIMENTAL DESIGN
Box-Behnken statistical screening design was used to optimize the compositional parameters and to evaluate interaction effects and quadratic effects of the solvent front, saturation time and band length on the retardation factor (Rf). The Box-Behnken design was specifically selected since it requires fewer runs than a CCD in cases of three or four variables. The Box-Behnken design was chosen because of its versatility, which allows us to add, remove or change any parameter at any time during our research or project. The goal of this research was to create and verify an HPTLC-based quality by design method that was both efficient and reliable.According to ICH criteria, the proposed approach was optimized and validated a design matrix comprising of 17 experimental runs was constructed.Outline of ATP, CMP, and CAA.
The first stage in developing a technique for Torsemide was to define the analytical target profile (ATP), which included choosing the drug sample and determining the suitable method or equipment for assessing the drug ingredient. Critical method parameters (CMPs) such as saturation time, band length, and solvent front were identified as important process variables. The retardation factor was identified as a key analytical attribute (CAA) required ensuring the established method's performance and the reliability of the data produced.
Identifying Risks: An Ishikawa fishbone diagram (cause-and-effect diagram) was created to explore potential risks affecting critical analytical attributes (CAAs) based on operational factors.
Screening Key Factors: A three-factor design with 17 runs was used to identify process parameters significantly impacting CAAs. The investigated factors were: saturation time, band length and solvent front. A design matrix generated by Design-Expert software assigned low, medium, and high values for each factor. The impact of these variables on CAAs was then evaluated for each run. Each CMP was investigated at three levels (low, medium, and high). Design-Expert® version 13 software was employed to analyze the results. The significance of model was validated through the implementation of Analysis of Variance (ANOVA). The importance of model was assessed by lack of fit test, p-value, and F-value.
6. FORCED DEGRADATION STUDIES
The degradation samples were prepared by transferring 10mg of Torsemide into a10ml volumetric flask and diluted to the mark with 0.5 N HCl, 0.5 N NaOH, and 3% H2O2 for acidic, basic and oxidative degradation studies respectively. The sample solution was kept at room temperature for 5 min then samples were withdrawn and applied on HPTLC plate.
METHOD VALIDATION
According to ICH Guidelines Method Validation is defined as “established the documented evidence which provides a high degree of assurance that a specific process will consistently produce a product of predetermined specifications and quantity attributes”
The developed method was validated as per the ICH guidelines Q2 (R1) for the parameter’s linearity, accuracy, precision, limit of quantitation, limit of detection, and robustness.
1. Accuracy
Accuracy refers to how closely a measured value aligns with the true value. In a highly accurate method, the measured value matches the true value of a known sample.
Accuracy can be determined through three approaches:
Precision
Precision in an analytical method refers to the degree of agreement among a series of measurements obtained from repeated sampling of the same homogeneous material under similar analytical conditions. It can be categorized into three types.
i. Repeatability:
This refers to the precision achieved when the method is used by the same analyst under identical operating conditions within a short time period.
ii. Intermediate precision:
This category assesses the method's precision by testing it on different days, using different instruments, or involving different analysts, while maintaining the same methodology.
iii. Reproducibility:
Reproducibility evaluates the precision of the method through inter-laboratory studies, where different laboratories apply the same methodology to analyse the same sample. According to the guidelines provided by the International Council for Harmonization (ICH), to ensure repeatability, it is recommended to perform a minimum of 9 determinations within a specified range (such as three concentrations with three replicates each), or a minimum of 6 determinations at 100% of the test concentration.
3) Specificity:
Specificity relates to the capacity of an analytical method to accurately distinguish and quantify the target analyte within complex mixtures. It is particularly important when assessing impurities and validating identification tests. During the determination of impurities and the validation of identification tests, it is essential to thoroughly investigate the specificity of the analytical method.
4) Limit of Detection (LOD) and Limit of quantification (LOQ):
LOD is the lowest concentration in a sample that can be detected but not necessarily quantified under the stated experimental conditions and LOQ is the lowest concentration of an analyte in a sample that can be determined with acceptable precision and accuracy.
LOD = 3.3*(SD) / S
LOQ = 10* (SD) / S
Where,
SD = Standard deviation of response
S = Slope of the calibration curve.
5) Robustness:
Robustness refers to how sensitive the method is to uncontrolled small changes in parameters such as temperature, pH of solution, mobile phase composition, and flow rate. There should not be interference from a blank with the main peaks Active ingredients peak in test preparation should be spectrally pure.
Forced degradation/Selectivity Studies
To examine the selectivity/stability-indicating capabilities of the HPTLC assay, forced degradation studies under a various stress condition, including acidic (HCl), alkali (NaOH), oxidative (H2O2), distilled water (DW), and thermal stress condition, were performed. These studies were performed under mild condition according to ICH recommendation.
Stress degradation by acid- induced degradation
For the degradation study,10 mg of Torsemide added to 0.5 N HCl and transferred into 10 ml volumetric flask and kept for 5 min. After 5 min make up this solution with methanol and measure the peak area and find out the percent degradation.
Stress degradation by under base-induced degradation
For the degradation study, 10 mg of torsemide added to 0.5 NaOH and transferred into 10 ml volumetric flask and kept for 5 min. After 5 min make up this solution with methanol and measure the peak and find out the percent degradation.
Oxidative degradation
For the oxidative degradation study, 10 mg of torsemide to 3 H2O2 and transferred into volumetric flask and kept for 5 min. After 5 min make up this solution with methanol and measure the peak area and find out the percent degradation.
Stress degradation study under neutral hydrolytic condition
For the neutral degradation study, 10 mg torsemide to 3 ml distilled water and transferred into volumetric flask and kept for 5 min under room temperature. After 5 min make up this solution with methanol and the peak area and find out degradation.
RESULT AND DISCUSSION
DRUG IDENTIFICATION:
Melting point measurement, solubility studies, and UV and IR spectra were used as preliminary work for drug identification, which yielded the following results.
a. Solubility Study:
A solubility study was carried out with different solvents such as methanol, acetonitrile, ethanol, water, triethylamine, ethyl acetate, chloroform, ether, acetone, and ammonia. Torsemide is soluble in methanol, DMSO, ethyl acetate, ethanol, conc. HCl, tetrahydrofuran, acetonitrile, formic acid, and acetic acid.
b. Melting point determination:
The melting point for Torsemide was evaluated and it was compared with reported standard values which is found to be 163-169°C.
OPTIMIZATION BY DoE SOFTWARE
Design-Expert software (version 13) was employed to perform the optimization. Optimizing Critical Method Parameters (CMPs): A Box-Behnken design with 17 runs was used to optimize the identified CMPs (Solvent front, saturation time, and band length) as shown in table 1. A quadratic model was chosen to statistically analyze the relationship between the factors and the retardation factor. The effects of three factors on the retardation factor were evaluated solvent front, saturation time, and band length. Three-dimensional (3D) response surface plots were generated to visualize the impact of these factors (solvent front, saturation time, and band length) on the retardation factor for Torsemide.
The 3D response surface plots for the critical analytical attributes (CAAs) are illustrated in figure 2. present the results of the analysis of variance (ANOVA) performed on the model for the retardation factor (Rf) as shown in Table 2. The analysis confirms that the model statistically predicts these values. This suggests that the chosen quadratic model effectively captures the curvature observed in the response surfaces. The numerically optimized conditions for achieving the desired response include a volume of Solvent front80mm, a saturation time of 10 minutes, and a band length of 6 mm.
Table 1: Design matrix for Box-Behnken response surface design
|
Run |
Factor-1 A: Saturation time (min) |
Factor-2 B: Band length (mm) |
Factor-3 C: Solvent Front(ml) |
Response 1 Rf |
|
1 |
20 |
8 |
80 |
0.68 |
|
2 |
15 |
6 |
80 |
0.52 |
|
3 |
15 |
6 |
80 |
0.52 |
|
4 |
15 |
8 |
70 |
0.41 |
|
5 |
15 |
6 |
80 |
0.52 |
|
6 |
10 |
4 |
80 |
0.18 |
|
7 |
20 |
6 |
70 |
0.59 |
|
8 |
15 |
6 |
80 |
0.52 |
|
9 |
15 |
8 |
90 |
0.58 |
|
10 |
20 |
6 |
90 |
0.73 |
|
11 |
10 |
8 |
80 |
0.3 |
|
12 |
15 |
4 |
90 |
0.47 |
|
13 |
15 |
6 |
80 |
0.52 |
|
14 |
10 |
6 |
70 |
0.11 |
|
15 |
15 |
4 |
70 |
0.36 |
|
16 |
10 |
6 |
90 |
0.35 |
|
17 |
20 |
4 |
80 |
0.64 |

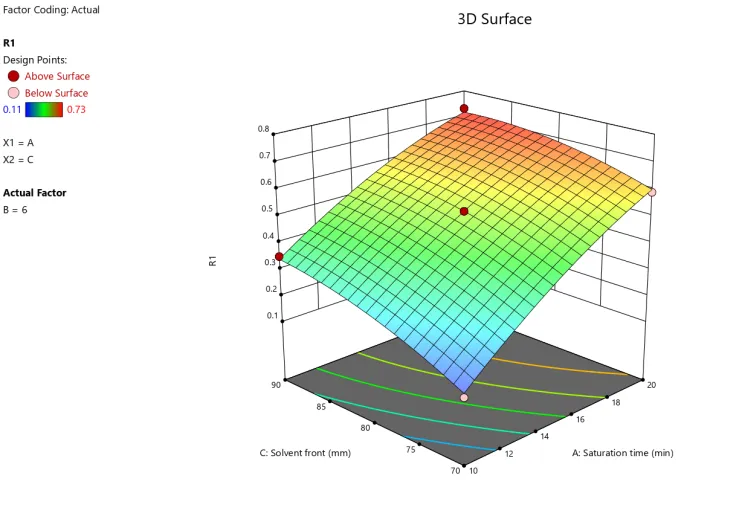
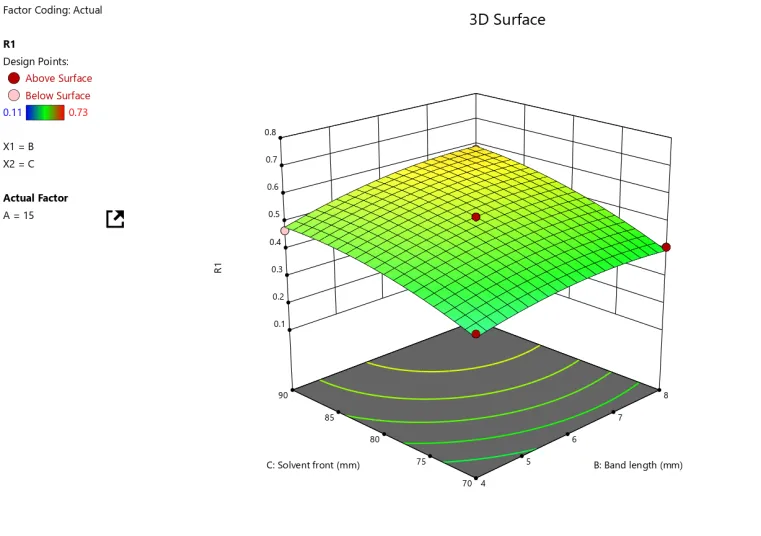
Fig 2: 3D surface plot of Torsemide showing (a)the influence of band length and saturation time on the Rf value, (b) the influence of saturation time and solvent front on the Rf value, (c) the influence of band length and solvent front on the Rf value, respectively.
Table 2: Result Analysis of ANOVA for Torsemide
|
Source |
Sum of Squares |
df |
Mean Square |
F-value |
P-value |
|
|
Model |
0.4510 |
9 |
0.0501 |
269.83 |
< 0.0001 |
Significant |
|
A-Saturation time |
0.3613 |
1 |
0.3613 |
1945.19 |
<0.0001 |
|
|
B-Band length |
0.0128 |
1 |
0.0128 |
68.92 |
<0.0001 |
|
|
C-Solvent front |
0.0544 |
1 |
0.0544 |
293.19 |
<0.0001 |
|
|
AB |
0.0016 |
1 |
0.0016 |
8.62 |
0.0219 |
|
|
AC |
0.0025 |
1 |
0.0025 |
13.46 |
0.0080 |
|
|
BC |
0.0009 |
1 |
0.0009 |
4.85 |
0.0636 |
|
|
A |
0.0067 |
1 |
0.0067 |
36.28 |
0.0005 |
|
|
B |
0.0038 |
1 |
0.0038 |
20.40 |
0.0027 |
|
|
C |
0.0052 |
1 |
0.0052 |
27.77 |
0.0012 |
|
|
Residual |
0.0013 |
7 |
0.0002 |
|
|
|
|
Lack of Fit |
0.0013 |
3 |
0.0004 |
|
|
|
|
Pure error |
0.0000 |
4 |
0.0000 |
|
|
|
|
Cor total |
0.4523 |
16 |
|
|
|
OPTIMIZATION OF CHROMATOGRAPHIC CONDITION:
The standard stock solutions 0.3 of Torsemide, was applied on thin layer chromatographic plates in shapes of bands (band size: 6 mm) and plates were placed in TLC chamber in various solvents systems. Every attempt intended to attain a desired result with preferred Rf value range with compact small size band. Various trials were carried out by use of both polar and non-polar solvents like toluene: methanol: ethyl acetate; methanol: Toluene: methanol: chloroform: toluene: Ethyl acetate: methanol: formic acid. The mobile phase comprising Toluene: Ethyl acetate: Methanol: Formic acid (2:7:1:0.1v/v/v) showed good resolution with Rf value of 0.86 but the peak area was high. So, we added the glacial acid and remove formic acid.The final mobile phase was selected as Toluene: Ethyl acetate: Methanol: Formic acid (2:7:1:0.1v/v/v) with Rf value of 0.56 as shown in figure 3.
Fig 3: Optimized Densitogram of the Torsemide
UV analysis:
In order to perform UV analysis, a 10 mg quantity of the drug was dissolved in 10 ml of methanol, resulting in a 1000 ppm solution. Then, 1 ml of this solution was withdrawn and diluted to a final volume of 9 ml, creating a 100-ppm solution. Subsequently, 2ml, 4ml, 6ml, and 8ml portions of the 100ppm solution were separately withdrawn and each diluted to a final volume of 10 ml. This yielded 20 ppm, 40 ppm, 60 ppm, and 80 ppm solutions, respectively. The absorbance of each of these solutions will be measured, and the R2 value will be calculated. The scanning range will be selected from 200-400nm. Thereported wavelength for Torsemide is 285-297 nm and wavelength found will be 297 nm.
FT-IR Spectroscopy:
The IR spectrum is shown in Fig. 4 and the functional group detected was shown in Table no. 3.In Figure 5, the isosbestic point spectra of Torsemide were presented. The spectra were obtained by scanning a range of 100-500nm. During the analysis, a significant peak was detected at a wavelength of 297nm.
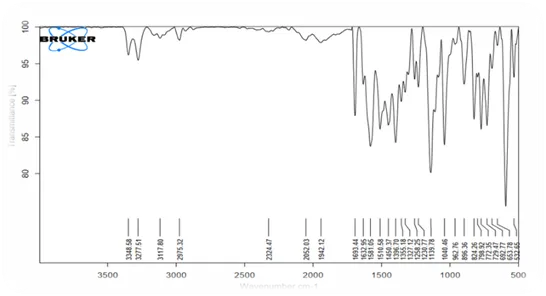
Fig 4: FT-IR of Torsemide
Table 3: IR frequencies of Torsemide functional group
|
Sr. No. |
Functional Group |
Observed Frequency (cm-1) |
|
1 |
S=O symmetric stretch |
1139.78 |
|
2 |
S=O symmetric stretch |
1327.12 |
|
3 |
N-H Bending |
1581.05 |
|
4 |
C-N Bending |
1693.44 |
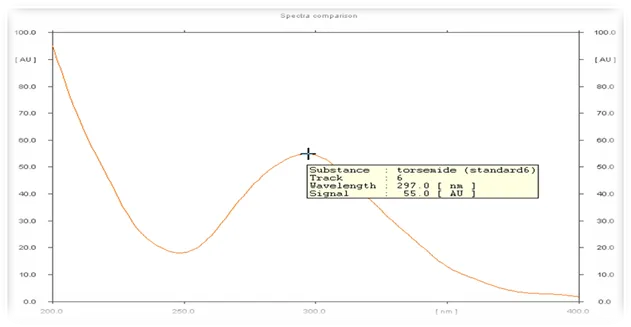
Fig 5: Isosbestic Point by HPTLC for Torsemide
METHOD VALIDATION
Calibration curve
The linear regression data for the calibration curve showed a good linear relationship over the concentration range 100-500ng/band. A linear regression equation was found to be y = 12.528x+560.98R² = 0.9922.
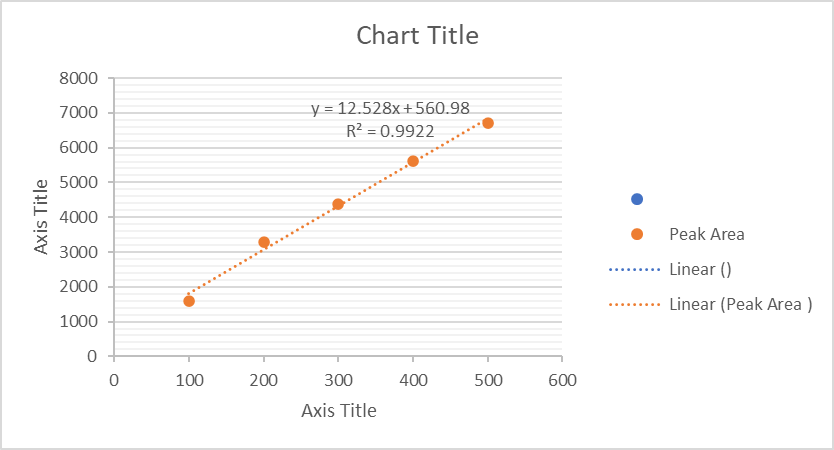
Fig 6: Linearity Plot of torsemide (Calibration Curve)
Precision:
The precision of the developed method was represented in terms of the % relative standard deviation(%RSD) of the peak area. The results depicted indicated the high precision of the method is presented in Table 4.
Table 4: Precision data for Torsemide.
|
Intraday Precision |
Interday Precision |
|||||
|
Run |
1st session |
2nd session |
3rd session |
Day 1 |
Day 2 |
Day 3 |
|
Densitogram area |
Densitogram area |
|||||
|
1 |
5645.1 |
5634.6 |
5260.2 |
5619.5 |
5415.0 |
5187.8 |
|
2 |
5674.4 |
5630.8 |
5360.2 |
5605.9 |
5452.0 |
5290.5 |
|
3 |
5684.2 |
5780.9 |
5289.0 |
5702.2 |
5351.2 |
5280.7 |
|
Mean |
5668.1 |
5630.8 |
5302.9 |
5642.5 |
5406.0 |
5280.7 |
|
SD |
20.12 |
27.89 |
51.78 |
52.46 |
51.08 |
56.67 |
|
% RSD (≤ 2%) |
0.35 |
0.49 |
0.97 |
0.92 |
0.94 |
1.11 |
Recovery studies:
The recovery studies were executed at 80%, 100%, and 120% of the test concentration as per ICH guidelines. The % recovery of Torsemide at all three levels was found to be satisfactory. The amounts of drug added and determined and the % recovery are listed in Table 5.
Table 5: Accuracy data of Torsemide
|
Sr. No. |
% Composition |
Weight of tablet powder taken (mg) |
Amount of drug added or recovered (mg) |
% Recovery |
|
1 |
80% |
82.2 |
8 |
102 % |
|
2 |
100% |
82.2 |
10 |
102.3% |
|
3 |
120% |
82.2 |
12 |
102.6% |
LOD and LOQ:
The limit of detection (LOD) of the developed method was found to be 2.11 ng per spot while the limit of quantitation (LOQ) was found to be 6.39 mg per spot for Torsemide.
Robustness:
The method was found to be unaffected by changing the parameters. It also did not show any significant changes due to alteration of mobile phase composition, and saturation time. The developed method was found to be robust.
Overall, the validation parameter for Torsemide is validated according to ICH guidelines. They are Linearity, Precision, Accuracy, and Robustness. Results for all parameters are summarized below in table no. 7
Table 6: Robustness of Torsemide.
|
Parameter |
Change |
Peak area |
Mean |
SD |
% RSD |
|
Mobile phase composition (±0.1 mL) |
6:3:1:0.1 |
4421.7 |
4324.4 |
83.9 |
1.94% |
|
5:2:1:0.1 |
4271.9 |
||||
|
8:1:1:0.1 |
4281.3 |
||||
|
Saturation time (± 5 min) |
8min |
4456.6 |
4449.09 |
10.69 |
0.24% |
|
10min |
4421.7 |
Table 7: Summary of validation parameters for Torsemide
|
Sr. No |
Parameters |
Results |
|
1 |
Linearity Torsemide Correlation Coefficient TOR |
100-500ng/band
0.99001 |
|
2 |
Precision (%RSD) Inter-day Precision of TOR Inter-day Precision of TOR |
1.11 0.97 |
|
3 |
Accuracy (% Recovery) 80% 100% 120% |
102.5% 102.6% 102.1% |
|
4 |
Robustness (%RSD) for TOR Mobile Phase Composition (± 1ml) Saturation time (± 5min) |
1.94% 0.24% |
DEGRADATION STUDIES:
Torsemide was subjected to forced degradation studies, where it was exposed to different stress conditions. The resulting chromatograms can be observed in Figure (7-10). The percentage of degradation was determined and documented. It was found that Torsemide undergoes decomposition of 14.55%, 5.36%, 1.98%, and 4.00% under acidic, alkaline, oxidative, and Neutral conditions, respectively, producing multiple degradation products. It can be concluded that Torsemide demonstrates moderate degradation in oxidative and Neutral conditions.
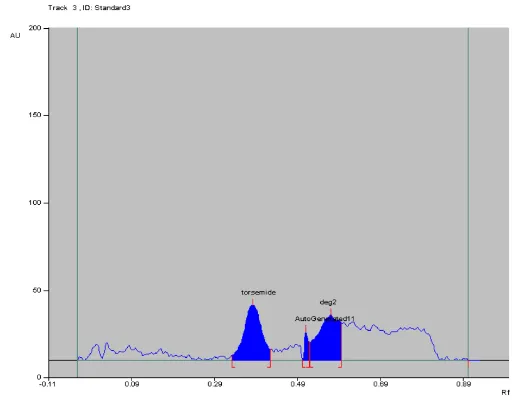
Fig 7: Degradation of Torsemide in 0.5 N HCl
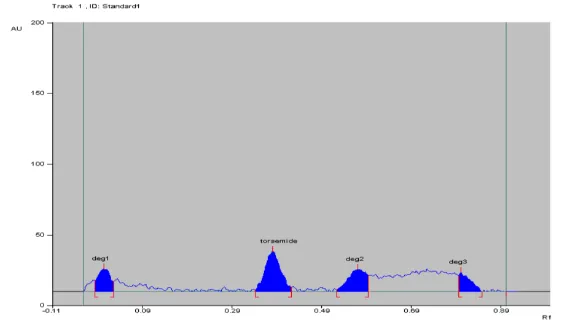
Fig 8: Degradation of Torsemide in 0.5 N NaOH
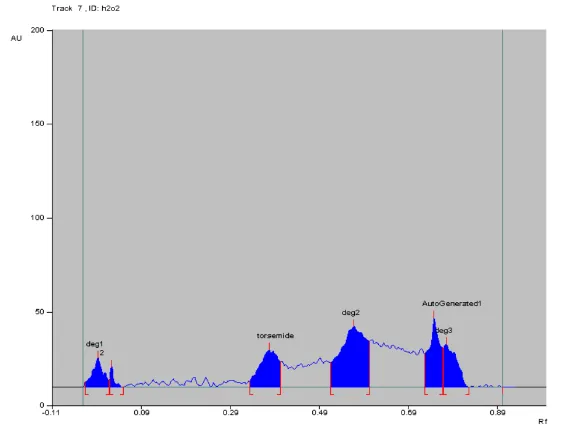
Fig 9: Degradation of Torsemide in 3%H2O2
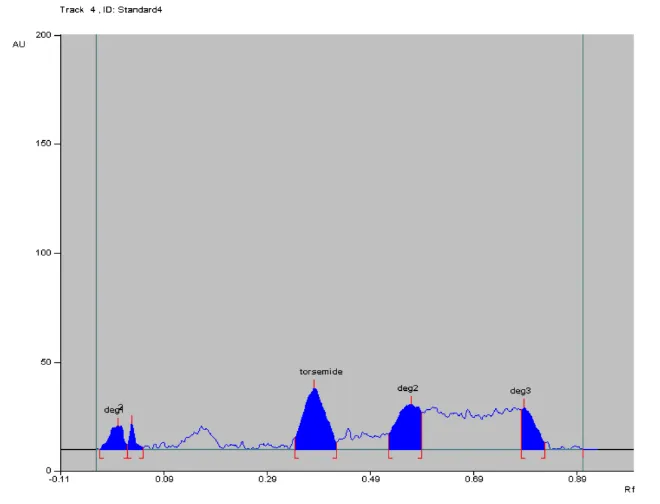
Fig. 10: Degradation of Torsemide in Distilled water.
CONCLUSION
The developed HPTLC method is precise, specific, sensitive, and accurate. Statistical analysis proved the method is reproducible and selective for the analysis of Torsemide in the bulk drug and its tablet dosage form. The developed method is validated as per ICH Guidelines for validation parameters like Linearity, Accuracy, Precision, and Robustness The forced degradation study shows that TOR is more degraded in Neutral, base, and oxidative conditions. Forced degradation studies provide knowledge about possible degradation pathways and degradation products of the active ingredients. This information will help to improve the formulation manufacturing process and determine the storage conditions. The present method can be used for the analysis of stability samples of Torsemide.
ACKNOWLEDGEMENT
Authors are thankful to Principal, Sinhgad Institute of Pharmacy, Narhe Pune and to Principal Dr. D.Y. Patil Institute of Pharmaceutical Sciences and Research Pimpri, Pune for providing HPTLC facility.
REFERENCES


Pratik Dhakne, Yogesh Kadake Stability-Indicating High-Performance Thin-Layer Chromatography Method Development and Validation for Torsemide in Bulk and Tablet Dosage Forms by Using a Quality by Design Approach, Int. J. of Pharm. Sci., 2026, Vol 4, Issue 5, 8083-8096, https://doi.org/10.5281/zenodo.20465291
 10.5281/zenodo.20465291