

We use cookies to ensure our website works properly and to personalise your experience. Cookies policy
1,4 Assistant professor,
2 Associate professor Indira college of pharmacy,
3 Assistant professor Shri Sambhaji College of Pharmacy, Khadkut, India
Analytical chemistry is an essential discipline in pharmaceutical sciences, playing a crucial role in ensuring the quality, safety, efficacy, and consistency of drug substances and finished dosage forms. Accurate and reliable analytical methods are indispensable for quality control and regulatory compliance. In this context, the present study was undertaken to develop and validate simple, precise, accurate, sensitive, and cost-effective analytical methods for the simultaneous estimation of Azelnidipine and Telmisartan in combined pharmaceutical dosage forms. Two complementary analytical techniques were employed, namely UV–Visible spectrophotometry and reverse-phase high-performance liquid chromatography (RP-HPLC). The UV spectrophotometric method was based on the simultaneous equation approach, utilizing methanol and 0.1 N hydrochloric acid as solvents. The absorbance measurements were carried out at 232 nm for Telmisartan and 249 nm for Azelnidipine, corresponding to their respective maximum absorbance wavelengths. For chromatographic analysis, the RP-HPLC method was optimized using a C18 column as the stationary phase and a mobile phase consisting of water and acetonitrile in the ratio of 75:25 v/v, with detection performed at 249 nm. Both analytical methods were rigorously validated in accordance with International Council for Harmonisation (ICH) guidelines. Validation parameters included linearity, accuracy, precision, specificity, robustness, ruggedness, limit of detection (LOD), and limit of quantitation (LOQ). The developed methods exhibited excellent linearity over the studied concentration ranges, high percentage recovery values close to 100%, low relative standard deviation (%RSD), and adequate sensitivity. The validation results confirmed that the proposed UV spectrophotometric and RP-HPLC methods are reliable, reproducible, and suitable for routine quality control analysis of Azelnidipine and Telmisartan in bulk drug substances as well as in combined pharmaceutical dosage forms.
Analytical Chemistry
Analytical chemistry is a core discipline of chemistry that deals with the separation, detection, identification, and quantitative determination of chemical constituents present in both natural and synthetic substances. It holds a crucial position in pharmaceutical sciences, particularly in safeguarding the quality, safety, effectiveness, and consistency of active pharmaceutical ingredients and finished dosage forms. Analytical methodologies serve as essential tools in Quality Assurance (QA) and Quality Control (QC), where precise and accurate measurement of chemical components is required to meet regulatory standards.
Pharmaceutical analysis includes all analytical procedures necessary to evaluate the identity, purity, strength, and quality of pharmaceutical substances. Ensuring accuracy, precision, sensitivity, specificity, and reproducibility of analytical results is the primary responsibility of an analytical chemist. In the contemporary pharmaceutical industry, analytical chemistry is integral throughout the product lifecycle, from drug discovery and formulation development to stability testing and regulatory approval.
Branches of Analytical Chemistry
Analytical chemistry is broadly divided into two main categories:
Qualitative analysis focuses on identifying the chemical nature of components present in a sample, such as atoms, ions, molecules, and functional groups. It addresses the question “what substances are present?” and is a prerequisite for quantitative determination.
Quantitative analysis provides numerical data regarding the concentration or amount of one or more components in a sample. This information is vital for dosage formulation, quality control, and regulatory compliance. In many analytical procedures, separation techniques are employed prior to qualitative and quantitative measurements.
Types of Quantitative Analysis
Quantitative analytical techniques can be classified as follows:
A. Classical Methods
Although these methods are simple and cost-effective, they are generally less sensitive, time-intensive, and less precise, which limits their application in routine pharmaceutical analysis.
B. Instrumental Methods
Instrumental techniques provide greater sensitivity, selectivity, precision, and speed, making them widely applicable in modern pharmaceutical analysis. These methods include:
Methods of Analysis
Analytical methods used for pharmaceutical evaluation are broadly categorized into classical and instrumental techniques. While classical methods are straightforward, their limited precision has led to increased reliance on instrumental approaches. Techniques such as UV–Visible spectrophotometry and HPLC are extensively adopted due to their high accuracy, sensitivity, reproducibility, and suitability for routine quality control applications.
Importance of Analytical Chemistry
Analytical chemistry plays a significant role across various scientific disciplines, particularly in clinical diagnostics and pharmaceutical research. Its applications include:
Spectroscopy
Spectroscopy involves the study of interactions between electromagnetic radiation and matter, including absorption, emission, and scattering phenomena. It encompasses ultraviolet, visible, infrared, X-ray, and gamma-ray spectroscopy. Among these, UV–Visible spectroscopy is extensively used in pharmaceutical analysis due to its operational simplicity and effectiveness in quantitative measurements.
Spectroscopy is the analysis of the interaction between matter and any portion of the electromagnetic spectrum. Spectroscopy involved the visible spectrum of light, but X-ray, gamma and UV spectroscopy also are valuable analytical techniques. Spectroscopy can involve any interaction between light and matter, including absorption, emission, scattering, etc.
UV–VISIBLE SPECTROPHOTOMETRY
The instrument used in ultraviolet-visible spectroscopy is called a UV/Vis spectrophotometer. It measures the intensity of light passing through a sample (I), and compares it to the intensity of the light before it passes through the sample (IO), The ratio I/ IO is called the transmittance, and is usually expressed as a percentage (%). The absorbance, A, is based on the transmittance.
A=log (%T/ 100%)
The absorption by matter of electromagnetic radiation in the domain ranging from the near ultraviolet to the very near infrared, between 180 and 1100 nm, has been studied extensively.
This portion of the electromagnetic spectrum, designated as the ‘UV/Visible’ since it includes radiation perceptible to the human eye, generally yields little structural information but is very useful for quantitative measurements. [4]
The UV/V is spectral region and the origin of the absorptions. This region of the spectrum is conventionally divided into three sub-domains termed near UV (185–400 nm), visible (400–700 nm) and very near infrared (700–1100 nm). Most commercial spectrophotometers cover the spectral range of 185 to 900 nm. The lower limit of the instrument depends upon the nature of the optical components used and of the presence, or not, along the optical pathway of air, knowing that oxygen and water vapour absorb intensely below 190 nm. Some instruments, on condition that they are operating in a vacuum, can attain 150nm with samples in the gaseous state. This is the domain of vacuum or far ultraviolet. The long-wavelength limit is usually determined by the wavelength response of the detector in the spectrometer.
Theory of Ultraviolet Spectra
Ultraviolet absorption spectra arise from transition of electrons or electrons within a molecule or an ion from a lower to a higher electronic energy level and the ultraviolet emission spectra arise from the reverse type of transition. For radiation to cause electronic excitation, it must be in the UV region of the electromagnetic spectrum.The actual amount of energy required depends on the difference in energy between the ground state E0 and excited state E1 of the electrons. Above equations becomes as,
E1- E0=hv
Beer’s and Lambert’s Law
When a ray of monochromatic light when passes through transparent medium decreases exponentially as the thickness and concentration of absorbing media increases.

Where, A = Absorbance of the solution at particular wavelength of the light beam
Io = Intensity of incident light beam,
It = Intensity of transmitted light beam
a = Absorptivity of molecule at the wavelength of beam.
B = Path length of cell in cm
c = Concentration of solution in gm/lit.
Beer’s law is said to be obeyed over a concentration range if a plot of concentration against absorbance passes through origin and is a straight line. [5,6]
UV Spectroscopy
Spectroscopy is the measurement and interpretation of electromagnetic radiation absorbed or emitted when the molecules or atoms or ions of a sample moves from one energy state to another energy states.
UV spectroscopy is type of absorption spectroscopy in which light of ultra- violet region (200-400 nm) is absorbed by the molecule which results in the excitation of the electrons from the ground state to higher energy state.
Principle of UV Spectroscopy
There are four possible types of transitions (π–π*, n–π*, σ–σ*, and n– σ*), and they can be ordered as follows: σ–σ* > n–σ* > π–π* > n–π*
Instrumentation of UV Spectroscopy
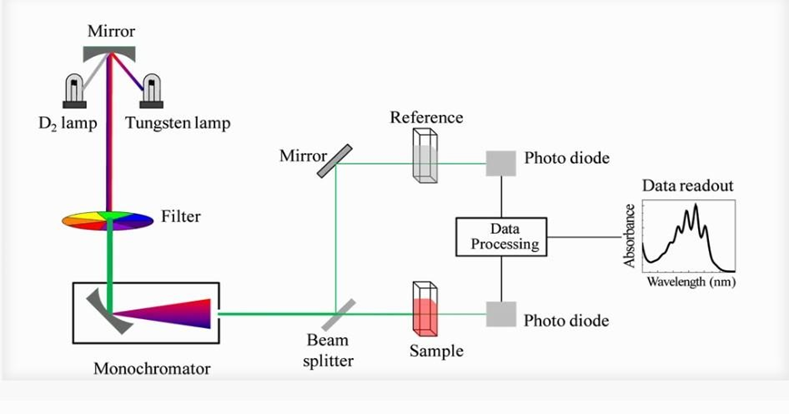
Fig 1: Instrumentation of UV spectroscopy
Light Source
Monochromator
Sample and reference cells
Detector
Amplifier
Recording devices
Applications of UV Spectroscopy Detection of Impurities
Structure elucidation of organic compounds
Terms Used in Absorption Spectroscopy
Transmittance (T): It is the ratio of intensity of transmitted light to that of incident light.
T = It / Io
Absorbance (A): It is the negative logarithm of transmittance to the base 10.
A = - log10T = log10 Io/ It A = abc
Molar absorptivity (ε): When concentration ‘c’ in equation A = abc is expressed in mole/lit and cell length in ‘cm’ then Absorptivity is called as molar absorptivity.
ε = A/bc.
Methods of analysis using UV-Visible spectrophotometer [7]
Simultaneous equation using area under curve method.
UV–Visible Spectrophotometry
UV–Visible spectrophotometry is based on the absorption of ultraviolet or visible light by molecules, resulting in electronic excitation. The technique operates within the wavelength range of 180–1100 nm and is commonly used for the quantitative analysis of UV- or visible-absorbing compounds. According to Beer–Lambert’s law, absorbance is directly proportional to concentration, which makes this method reliable and reproducible.
Chromatography and HPLC
Chromatography is an efficient separation technique that depends on the unequal distribution of analytes between a stationary phase and a mobile phase. Among various chromatographic methods, High Performance Liquid Chromatography (HPLC) is the most extensively used in pharmaceutical analysis owing to its high resolution, sensitivity, accuracy, and reproducibility.
HPLC is particularly advantageous for:
Chromatographic Mechanisms
Systems used in chromatography are often categorized into one of four types based on the mechanism of action, adsorption, partition, and ion-exchange and size exclusion. Adsorption chromatography arises from interactions between solutes and the surface of the solid stationary phase. Partition chromatography involves a liquid stationary phase that is immiscible with the eluent and is coated on an inert support. Ion exchange chromatography has a stationary phase with an ionically charged surface that is different from the charge of the sample. The technique is based on the ionization of the sample. The stronger the charge of the sample, the stronger the attraction to the stationary phase; therefore, it will take longer to elute off the column. Size exclusion is as simple as screening samples by molecular size. The stationary phase consists of material with precisely controlled pore size.
INSTRUMENTATION OF HPLC
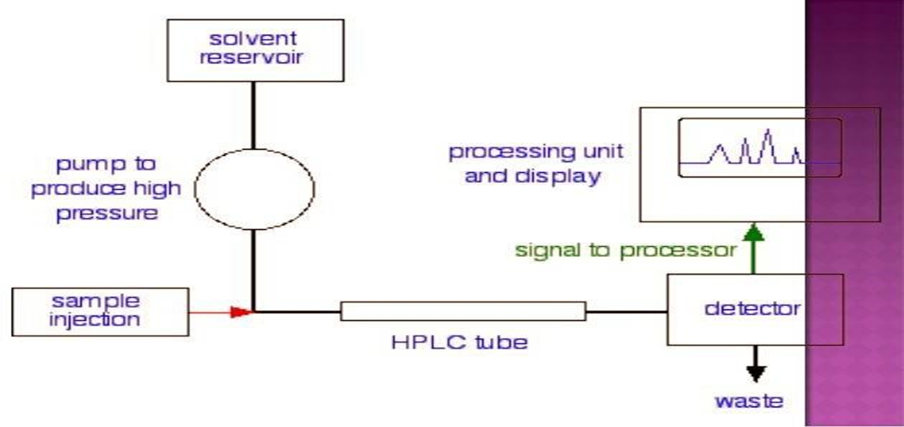
Fig 3: Instrumentation of HPLC
Mobile Phase Reservoir
The most common type of solvent reservoir is a glass bottle. Most of the manufacturers supply these bottles with the special caps, teflon tubing and filters to connect to the pump inlet and to the purge gas (helium), used to remove the dissolved air.
Pumps
Pumps in HPLC may be classified as follows:
Displacement Pump: It is a limited capacity pump which produces a flow that tends to be independent of viscosity and back pressure with pulse free output.
Reciprocating Pump: It has a small internal volume (35 to 400μL), with high output pressure (up to 10,000 psi) and constant flow rates. It produces a pulsed flow.
Pneumatic or Constant Pressure Pump: They are pulse free, but suffer from the drawbacks of limited capacity, dependence of flow rate on solvent viscosity and column back pressure.
They give output pressure less than 2000 psi.
Modern pumps have the following parameters:
Columns
Typical LC columns are 10, 15 and 25 cm in length and are fitted with extremely small diameter (3, 5 or 10 μm) particles. The internal diameter of the columns is usually 4 mm to 4.6 mm; which is considered as the best compromise among sample capacity, mobile phase consumption, speed and resolution. However, if pure substances are to be collected (preparative), larger diameter columns must be used.
Column Packing Materials
The packing used in modern HPLC consist of small, rigid particles having a narrow particle size distribution. Three main types of column packing in HPLC are as follows:
Detectors
Detectors in HPLC may be broadly classified as under:
Bulk Property Detector: It compares overall changes in the physical property (refractive index, dielectric constant or density) of the mobile phase with and without an eluting solute. ?Solute Property Detectors: It responds to the physical property of the solute which is not exhibited by the pure mobile phase, e.g. UV absorbance, fluorescence or diffusion current. Such detectors are about 1000 times more sensitive then bulk property detector, giving a detectable signal for a few nanogram of sample.
Injectors
Sample introduction can be accomplished by the use of an injection valve or with the help of an auto-samplers and microprocessors. Insertion of sample onto pressurized column must be as a narrow plug so that the peak broadening attributable to this step is negligible. The injection system itself should have no dead (void) volume.
There are important ways of introducing the sample into injection port.
Data systems
Since the detector signal is electronic, modern data acquisition techniques are used to store, retrieve and analyze the data which also increases accuracy and precision of analysis even if operator’s attention decreases.
Types of HPLC Techniques [9]
There are four main types of HPLC techniques. They are:
Normal-Phase Chromatography (NP- HPLC)
Normal-phase HPLC explores the differences in the strength of the polar interactions of the analytes in the mixture with the stationary phase. The stronger the analyte-stationary phase interaction, the longer the analyte retention. Analyte molecules compete with the mobilephase molecules for the adsorption sites on the surface of the stationary phase.
Reversed-Phase HPLC (RPLC)
As opposed to normal-phase HPLC, RP-HPLC employs mainly dispersive forces (hydrophobic or vander Waals interactions). The polarities of mobile and stationary phases are reversed, such that the surface of the stationary phase in RP-HPLC is hydrophobic and mobile phase is polar, where mainly water-based solutions are employed. RP-HPLC is by far the most popular mode of chromatography. Almost 90% of all analyses of low-molecularweight samples are carried out using RP-HPLC. The majority of packing materials used in RP-HPLC are chemically modified porous silica.
Ion-Exchange Chromatography (IEX)
IEX is based on the different affinities of the analyte ions for the oppositely charged ionic centers in the resin or adsorbed counter ions in the hydrophobic stationary phase. Consider the exchange of two ions A+ and B+ between the solution and exchange resin.
K = A·E + B+ ↔B·E + A+
The equilibrium constant for this process is shown in Eq. below:
K= [A+] [BE]
[AE] [B+]
Four major types of ion-exchange centers are usually employed:
Size-Exclusion Chromatography (SEC)
SEC is the method for dynamic separation of molecules according to their size; the separation is based on the exclusion of the molecules from the porous space of packing material due to their steric hindrance
Applications of HPLC [10]
Analytical Method Development [11]
Analytical methods development and validation play important roles in the discovery, development, and manufacture of pharmaceuticals. The official test methods that result from these processes are used by quality control laboratories to ensure the identity, purity, potency, and performance of drug products.
Analytical methods are developed and validated for drug substances (API), excipients, drug products, degradation products and related substances, residual solvents, etc. Analytical method development and validation activities play a crucial part in the drug development process.
Analytical Method Development and Validation
Analytical method development and validation are essential processes in pharmaceutical analysis that ensure the reliability and suitability of analytical procedures. These processes confirm that the developed methods are accurate, precise, specific, robust, and fit for their intended purpose. Method validation establishes consistency and compliance with regulatory guidelines.
Validated analytical methods are required for:
Method Validation [12]
Method validation is the process to confirm that the analytical procedure employed for a specific test is suitable for its intended use. Methods need to be validated or revalidated as follows:
Considering the growing need for rapid, accurate, and dependable analytical techniques, the present study emphasizes the development and validation of UV spectrophotometric and HPLC methods for the simultaneous estimation of Azelnidipine and Telmisartan. These analytical approaches are simple, precise, cost-effective, and well-suited for routine pharmaceutical quality control.
AIM AND OBJECTIVES
3.1 AIM
Analytical Method Development and validation of Azelnidipine & Telmisartan by using UV and HPLC techniques.
3.2 OBJECTIVES
Literature Survey
A detailed literature survey indicated that several analytical methods have been reported for the estimation of Telmisartan and Azelnidipine, either individually or in combination with other antihypertensive drugs. UV spectrophotometric methods using solvents such as methanol, distilled water, sulfuric acid, and hydrochloric acid were widely employed. Detection wavelengths for Telmisartan ranged from 251 nm to 329 nm, while Azelnidipine showed absorbance maxima between 239 nm and 257 nm. Derivative spectrophotometry and simultaneous equation methods were frequently reported. RP-HPLC methods utilized C18 columns with methanol or acetonitrile–water mobile phases, flow rates around 1 mL/min, and detection wavelengths near 249–254 nm. However, limited literature was available on a simple and validated simultaneous UV spectrophotometric method for Telmisartan and Azelnidipine together, which justified the present investigation.
MATERIALS
PURE DRUGS
Instruments
Chemicals
All glassware used were calibrated.
Table No. 5: Comparative Drug Profile of Azelnidipine and Telmisartan
|
Parameter |
Azelnidipine |
Telmisartan |
|
Drug Class |
Calcium Channel Blocker (Dihydropyridine) |
Angiotensin II Receptor Blocker (ARB) |
|
Synonym |
Azelnidipine |
Telmisartan |
|
IUPAC Name |
3-(1-Benzhydryl-3-azetidinyl), 5-isopropyl-2-amino-6-methyl-4-(m-nitrophenyl)-1,4-dihydropyridine-3,5-dicarboxylate |
2-(4-{[4-Methyl-6-(1-methyl-1H-1,3-benzodiazol-2-yl)-2-propyl-1H-1,3-benzodiazol-1 yl] methyl} phenyl) benzoic acid |
|
Molecular Formula |
C??H??N?O? |
C??H??N?O? |
|
Molecular Weight |
582.6 g/mol |
514.62 g/mol |
|
Physical Appearance |
White granules or crystalline powder |
White to slightly yellowish solid |
|
Melting Point |
121–125 °C |
183–269 °C |
|
Solubility |
Soluble in methanol & acetonitrile; slightly soluble in water |
Soluble in water; sparingly soluble in methanol |
|
Functional Category |
Antihypertensive, cardioprotective, neuroprotective, anti-atherosclerotic |
Antihypertensive, cardioprotective, neuroprotective |
|
Mechanism of Action |
Blocks L-type voltage-dependent Ca²? channels in vascular smooth muscle → vasodilation → reduced blood pressure |
Selective AT? receptor blocker → inhibits RAAS; also activates PPAR-γ improving insulin sensitivity |
|
Pharmacokinetics |
Gradual onset, prolonged hypotensive effect; no reflex tachycardia; high vascular affinity |
Bioavailability ~50%; >99.5% protein binding; half-life ~24 h; biliary excretion |
|
Dose |
8–16 mg once daily |
40–120 mg twice daily |
|
Contraindications |
Hypotension, dehydration, hyperkalemia, renal artery stenosis, liver disease |
Hyperkalemia, renal impairment, pregnancy |
|
Drug Interactions |
Risk of hypotension; arrhythmia with amlodipine; interaction with amiodarone |
Hyperkalemia with potassium supplements; renal risk with NSAIDs |
|
Therapeutic Uses |
Hypertension, myocardial protection, inhibition of platelet aggregation |
Hypertension, heart failure, diabetic nephropathy |
Figures: Structural Identification
Azelnidipine
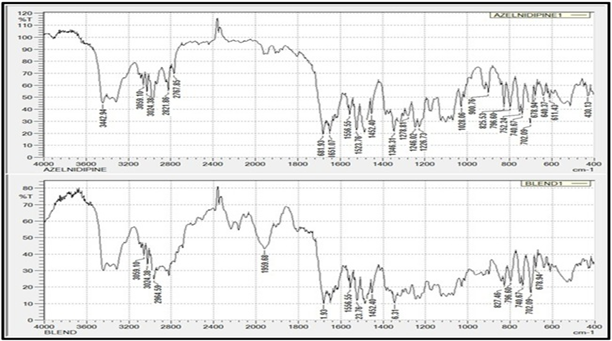
Figure 4: Chemical structure of Azelnidipine
Figure 5: IR spectrum of Azelnidipine
Telmisartan
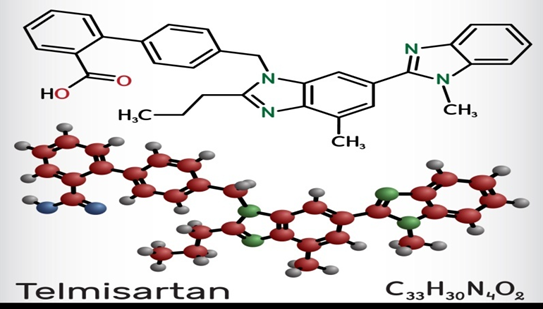
Figure 6: Chemical structure of Telmisartan
Figure 7: IR spectrum of Telmisartan
METHODOLOGY AND RESULTS
UV Spectrophotometric Method
Selection of Wavelength
Scanning of individual drug solutions between 200–400 nm revealed absorbance maxima at 232 nm for Telmisartan and 249 nm for Azelnidipine, which were selected for analysis.
Preparation of Stock and Working Solutions
Standard stock solutions of Telmisartan and Azelnidipine were prepared separately by accurately weighing appropriate quantities of each drug and dissolving them in methanol to obtain a final concentration of 100 μg/mL. Methanol was selected as the solvent due to its good solubilizing capacity for both drugs and compatibility with UV spectrophotometric analysis.
Working standard solutions were prepared by suitable dilution of the stock solutions using 0.1 N hydrochloric acid (HCl). The use of 0.1 N HCl provided a stable medium and ensured reproducible absorbance values during spectrophotometric measurements.
Linearity and Calibration Curve
The linearity of the proposed UV spectrophotometric method was evaluated by analyzing a series of standard solutions at different concentrations for both drugs.
The absorbance of each solution was measured at their respective wavelengths of maximum absorption (λmax), and calibration curves were constructed by plotting absorbance versus concentration.
Regression Analysis
|
Parameter |
Telmisartan |
Azelnidipine |
|
λmax (nm) |
232 |
249 |
|
Regression equation |
Y = 0.0196x − 0.0065 |
Y = 0.1164x − 0.0021 |
|
Correlation coefficient (R²) |
0.9998 |
0.9996 |
The high correlation coefficient values (R² > 0.999) indicate an excellent linear relationship between absorbance and concentration for both drugs, confirming the suitability of the method for quantitative analysis.
Absorptivity Values
The absorptivity coefficients of both drugs were determined at the selected analytical wavelengths and are summarized below:
|
Drug |
Absorptivity at 232 nm |
Absorptivity at 249 nm |
|
Telmisartan |
206.75 |
116.75 |
|
Azelnidipine |
26.25 |
583.55 |
These absorptivity values were utilized in the simultaneous equation method for the accurate determination of Telmisartan and Azelnidipine in combined formulations. The significant difference in absorptivity at the selected wavelengths enabled reliable simultaneous estimation without interference.
Analysis of Laboratory Mixture
The applicability of the proposed method was evaluated by analyzing a laboratory-prepared mixture containing 5 μg/mL of Telmisartan and 1 μg/mL of Azelnidipine.
|
Drug |
Mean % Estimation |
SD |
%RSD |
|
Telmisartan |
100.22 % |
0.598 |
0.598 |
|
Azelnidipine |
100.03 % |
0.374 |
0.374 |
The mean percentage estimation values were very close to 100%, and the low standard deviation and %RSD values (<1%) demonstrate high accuracy and excellent precision of the method for simultaneous estimation.
Tablet Assay
The validated method was applied to the assay of tablet dosage forms containing 40 mg of Telmisartan and 8 mg of Azelnidipine.
|
Drug |
Mean % Estimation |
SD |
%RSD |
|
Telmisartan |
99.92 % |
0.343 |
0.344 |
|
Azelnidipine |
99.62 % |
0.334 |
0.334 |
The assay results were within the acceptable pharmacopeial limits (98–102%), confirming that the proposed method is suitable for routine quality control analysis of combined tablet formulations.
VALIDATION PARAMETERS
UV Spectrophotometric Method
Accuracy (Recovery Study)
Accuracy of the method was assessed by recovery studies using the standard addition technique at 80%, 100%, and 120% levels.
|
Level (%) |
Telmisartan Recovery (%) |
Azelnidipine Recovery (%) |
|
80 |
99.75 |
99.34 |
|
100 |
99.63 |
99.88 |
|
120 |
100.28 |
100.08 |
The recovery values were found to be close to 100% with minimal variation, indicating that the method is accurate and free from interference from excipients.
Precision
Precision of the method was evaluated in terms of intraday (repeatability) and interday (intermediate precision) studies.
All %RSD values were below 2%, confirming that the method is precise under normal laboratory conditions.
Sensitivity
The sensitivity of the analytical method was determined by calculating the Limit of Detection (LOD) and Limit of Quantitation (LOQ).
|
Parameter |
Telmisartan (μg/mL) |
Azelnidipine (μg/mL) |
|
LOD |
0.96 |
0.11 |
|
LOQ |
1.69 |
0.53 |
The low LOD and LOQ values demonstrate the high sensitivity of the method, enabling detection and quantification of both drugs at low concentration levels.
Ruggedness and Robustness
Ruggedness was evaluated by performing the analysis using two different analysts under identical experimental conditions. The %RSD values were found to be below 1%, indicating that the method produces consistent results irrespective of analyst variation.
Robustness was assessed by deliberately varying the analytical conditions, particularly the strength of the acidic medium (0.1 N HCl and 0.5 N HCl). The %RSD values obtained were below 0.5%, confirming that minor variations in experimental conditions do not significantly affect the analytical performance.
METHODOLOGY AND RESULTS – RP-HPLC METHOD : CHROMATOGRPHIC METHOD (RP-HPLC)[29]
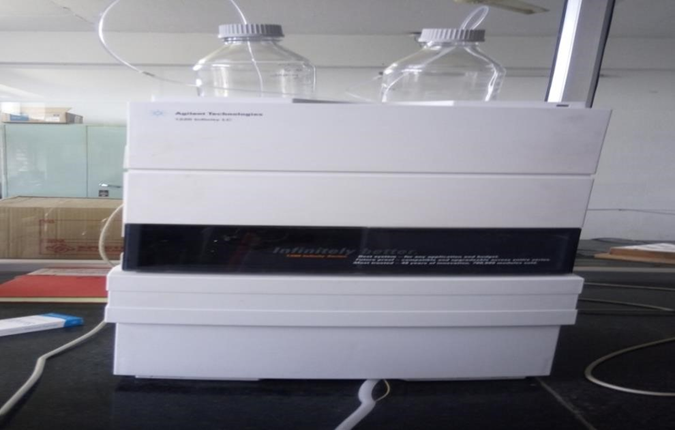
Figure 13: High Performance Liquid Chromatography (RP-HPLC)
Table 16: Pure drug and supplier
|
Sr. No |
Name of Drug |
Pure drug suppliers |
|
1. |
Azelnidipine |
Swapnroop Pharmaceuticals, Aurangabad. |
Table 17 : Instruments Used
|
Sr. No |
Instrument |
Specifications |
|
1. |
HPLC System |
Agilent 1220 LC |
|
2. |
Pump: |
Reciprocating Pump |
|
3. |
Detector: |
UV Detector |
|
4. |
Column: |
Zorbax Eclipse XDB-C18 (4.6 ×250mm ×5µ) |
Table 18: Reagents and chemicals used
|
Sr. No |
Name |
Specification |
|
1. |
Acetonitrile |
HPLC Grade |
|
2. |
Water |
HPLC Grade |
6.3 : METHODOLOGY
6.3.1: METHOD: CHROMATOGRPHIC METHOD (RP-HPLC)
6.3.1.1. SELECTION OF CHROMATOGRAPHIC PARAMETERS
6.3.1.1.1. Selection of Chromatographic Mode
The reverse phase HPLC was selected for separation because it is convenient and rugged than other forms of the liquid chromatography and is more likely to result in a satisfactory final separation.
6.3.1.1.2. Selection of Stationary phase
On the basis of reversed phase HPLC mode and number of carbon present in molecule (analyte) stationary phase with C-18 bonded phase i.e. Zorbax Eclipse XDB-C18 (4.6×250mm×5μ) with particle size 5 μm was selected.
6.3.1.1.3. Selection of Mobile Phase
The selection was made on the basis of literature survey. After assessing the solubility of both drugs in different solvents as well in mobile phases; Water: Acetonitrile in ratio 75:25 v/v was selected as a first choice.
6.3.1.1.4. Selection of Detection wavelength
By appropriate dilution of standard stock solution with Water :Acetonitrile (75:25), the 10 μg/ml concentrations of AZD was prepared. The solution were scanned using double beam UV visible spectrophotometer 1800 in the spectrum mode between the range of 400 nm to 200 nm The analytical wavelength selected was 249 nm at which at which drug shows maximum absorbance.
6.3.1.2. PREPARATION OFMOBILE PHASE & STOCK SOLUTIONS
6.3.1.2.1. Preparation of mobile phase:
A mobile phase consisting of Acetonitrile (HPLC grade), water in the ratio of 75:25 % v/v was prepared and then filtered through a 0.45 µ membrane filter.
6.3.1.2.2. Preparation of standard stock solution:
Accurately, about 10mg of standard AZD was weighed and transferred to separate 10 ml volumetric flasks. The drugs were dissolved in methanol then volume made up to the mark with same solvent to obtain standard stock solution of each drug of concentration 1000 μg/ml.
6.3.2.3. OPTIMIZATION OF CHROMATOGRAPHIC PARAMETERS
To optimize the chromatographic variables such as mobile phase pH, flow rate and solvent ratio were studied. The resulting chromatograms were recorded and the chromatographic parameters such as capacity factor, asymmetric factor, and resolution and column efficiency were calculated. The condition that gave the best resolution, symmetry and capacity factor was selected for estimation.
6.3.2.3.1. Optimization of Mobile Phase Strength
Standard solution of Azelnidipinewere injected into the HPLC system and run in mobile phase system. The mobile phase consisting of Water: Acetonitrile (75:25 v/v) was selected as it gave high resolution of AZD. Results are shown in Table 19
Table 19: Optimization of Mobile Phase Strength
|
Sr No. |
Mobile Phase |
Retension Time (Min.) |
Peak Area |
Remarks |
|
|
|
AZD |
AZD |
|
|
1
2
3 |
Water : Acetonitrile 50:50 Water : Acetonitrile 80:20 Water : Acetonitrile 75:25 |
2.53 |
3857619 |
Broad peak with asymmetry
Negative peak
Sharp peak with symmetry within limits and significant retension for AZD |
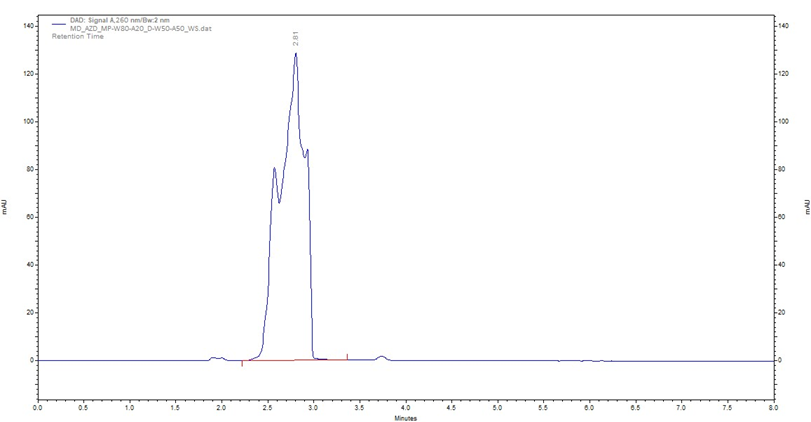
Figure 14 : Chromatogram of AZD (Acetonitrile: Water 50:50)
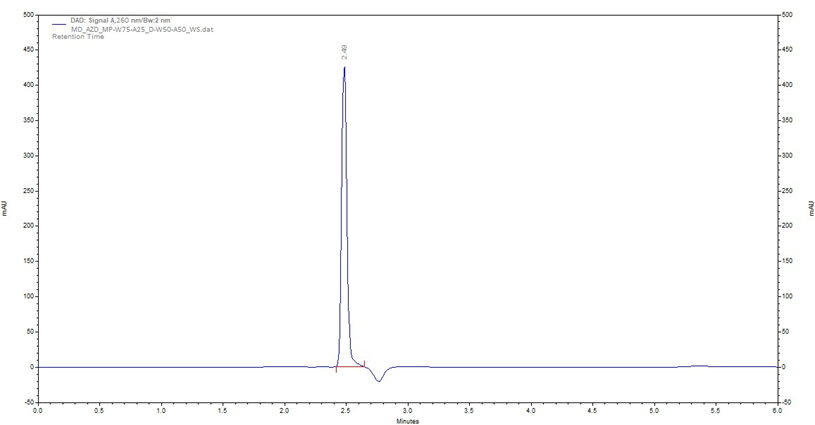
Figure 15:Chromatogram of AZD ( Acetonitrile: Water 80:20)
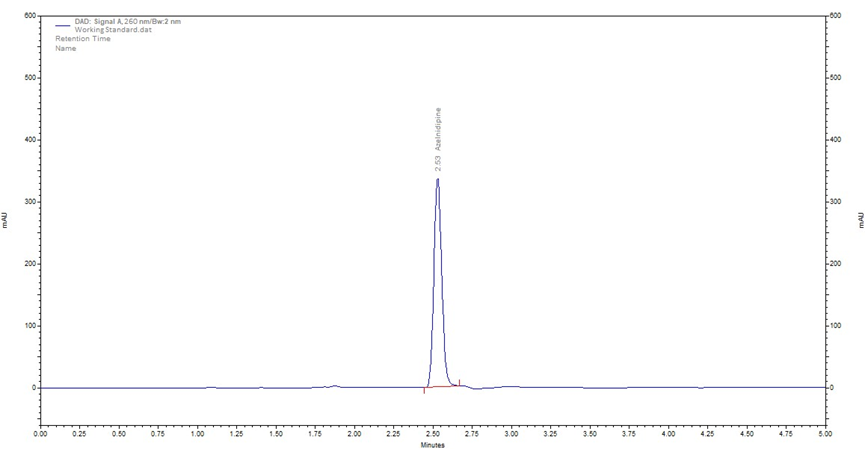
Figure 16: Chromatogram of AZD (Water: Acetonitrile 75:25)
6.3.2.3.2. Optimization of Detection Wavelength
Detection using UV detector at different wavelengths was performed. Physical laboratory containing 10 µg/mL of AZD in the same proportion was prepared in mobile phase and injected. Finally, 249 nm wavelength was selected as detection wavelength.
Finalized Chromatographic Conditions
System : Agilent 1220 LC
6.3.1.4. LINEARITY STUDIES
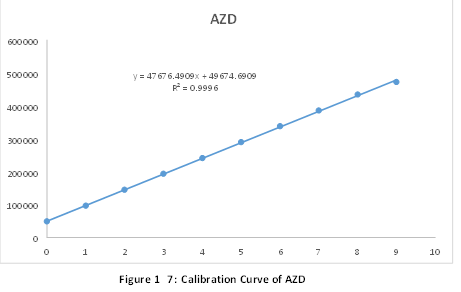
Appropriate aliquots of the standard stock solutions of AZD were pipetted out and transferred to a series of 10 ml volumetric flasks respectively. The volume was made up to the mark with methanol to obtain working standard solutions of AZD. The concentrations 1,2,3,4,5,6,7,8,9 µg/ml of AZD .From these solutions, 10 µl injections of each concentration of the drug were injected into the HPLC system three times separately and chromatographed under the conditions as described above. Evaluation of the drug was performed with the UV detector set at 249 nm and the peak areas were recorded. The standard calibration curve for AZD was plotted separately as peak area Vs the respective concentration of AZD. Good linearity was obtained in the concentration range of 10 μg/ml for AZD .
The standard calibration Table and graph for AZD are shown in Table 20 The standard working curve equation Y=47676.4909× + 49674.6909 for AZD was found to be with a correlation coefficient value of r2 = 0.9996 for AZD .
Table 20 : Calibration Table for AZD
|
Concentration in µg/ml |
Peak Area of AZD |
|
0 |
0 |
|
1 |
48223 |
|
2 |
96450 |
|
3 |
144675 |
|
4 |
192900 |
|
5 |
240999 |
|
6 |
289350 |
|
7 |
337575 |
|
8 |
385800 |
|
9 |
434025 |
|
10 |
472180 |
6.3.1.5. Application of Proposed method to Laboratory Solution
In order to see the feasibility of proposed method for estimation of Azelnidipne in marketed pharmaceutical formulations, the method was first tried for estimation of drugs in standard laboratory solution. Accurately about 10 mg of pure drug (AZD) was weighed and transferred in the 10 ml volumetric flask & Dissolve in Methanol to give stock solution of concentration 1 mg/ml (1000μg/ml). Appropriate aliquot portion 0.1 ml was transferred to 10 mL volumetric flask and diluted with methanol to obtain the concentration 100µg/ml to this appropriate aliquot portion 0.1ml (AZD) was transferred to 10 mL volumetric flask and diluted with methanol to obtain the concentration 10µg/ml of AZD. A volume of 20µL of solution was injected with the help of Hamilton Syringe. All measurements were repeated three times for each concentration and from the Peak area, the amount of drug were calculated, the results are shown in Table 21.
Table 21: Result of Laboratory Solution
|
Sr No. |
Conc. In µg/ml |
Peak Area |
% Estimation |
|
|
AZD |
AZD |
AZD |
|
1 |
10 |
472180 |
100.11 |
|
2 |
10 |
472175 |
99.76 |
|
3 |
10 |
472178 |
99.89 |
|
|
|
Mean |
99.92 |
|
|
|
SD |
0.332616 |
|
|
|
% RSD |
0.33257 |
[Mean(n)=3,SD= Standard Deviation,% RSD= Relative Standard Deviation.
6.3.1.6. VALIDATION OF PROPOSED METHOD
The proposed method was validated as per ICH guidelines. The solutions of the drugs were prepared as per the earlier adopted procedure given in the experiment.
a) Recovery study
Accuracy of an analytical method is the closeness of the test results obtained by that of the true value. Accuracy of proposed method has been carried out by recovery studies. It was performed by recovery study using standard addition method at 80, 100, and 120 % level; known amount of standard AZD was added to pre analyzed sample (8, 10, 12 µg/mL) and subjected them to the proposed HPLC method. Results are shown in Table 22.
Table 22: Result of Recovery Study
|
Level of % recovery |
Amount present (mg) |
Amount of standard added (mg) |
Total amount recovered (mg) |
% Recovery |
|
|
AZD |
AZD |
AZD |
AZD |
|
80 100 120
|
10 10 10
|
0.8 1 1.2
|
10.8 10.9 11.3 Mean SD %RSD |
99.76 99.89 100.89 100.18 0.330454 0.33115 |
(n=3)
b) Precision
Precision of an analytical method is the degree of agreement among individual test results. Precision of the method was verified by using stock solutions in the ratio of 1 containing 0.01 µg/ml AZD . System repeatability was done by repeating the assay three times of the same concentration after every two hours on the same day for intraday precision. Interday precision was carried out by performing the assay sample sets after 24 hours and 48 hours, results are reported in Table 23& 24.
Table 23 : Result of Intraday Precision
|
Sr No. |
Conc. In µg/ml |
Peak Area |
% Estimation |
|
|
AZD |
AZD |
AZD |
|
1 |
10 |
472175 |
99.66 |
|
2 |
10 |
472178 |
99.76 |
|
3 |
10 |
472180 |
100.11 |
|
|
|
Mean |
99.84 |
|
|
|
SD |
0.228692 |
|
%RSD 0.229772 |
|||
(n=3)
Table 24 : Result of Inter day Precision
|
Sr No. |
Conc. In µg/ml |
Peak Area |
% Estimation |
|
|
AZD |
AZD |
AZD |
|
1 |
10 |
472180 |
100.11 |
|
2 |
10 |
472178 |
99.76 |
|
3 |
10 |
472180 |
100.11 |
|
|
|
Mean |
99.99 |
|
|
|
SD |
0.374032 |
|
|
|
%RSD |
0.372951 |
(n=3)
c) Sensitivity
Sensitivity of the proposed method was estimated in terms of Limit of Detection (LOD) and Limit of Quantitation (LOQ). LOD = 3.3 SD/S and LOQ = 10 SD/S, where SD is the residual standard deviation and S is the slope of the line .LOD was found to be 0.68ug/ml & LOQ was found to be 1.68 ug/ml for AZD .
d) Ruggedness
From stock solution, sample solution of AZD (10 μg/mL) was prepared and analyzedby analysts using similar operational and environmental conditions. Peak area was measured for same concentration solutions. The results are shown in Table 25.
Table 25 : Result of Ruggedness
|
Sr No. |
Conc. In µg/ml |
Peak Area |
% Estimation |
|
|
AZD |
AZD |
AZD |
|
Analyst 1 Analyst 2 |
10 10 |
472179 472180 |
99.86 100.11 |
|
|
|
Mean SD %RSD |
100.02 0.708112 0.709453 |
(n=3)
e) Linearity and range
It was performed using different test concentrations. Response was Linear in the range of 1 to 9μg/mL for AZD (Fig.17)
Optimized Chromatographic Conditions
A reverse-phase high-performance liquid chromatographic (RP-HPLC) method was developed and optimized for the quantitative estimation of Azelnidipine. The optimization process involved systematic evaluation of chromatographic parameters such as mobile phase composition, flow rate, detection wavelength, and injection volume to achieve good resolution, peak symmetry, and reproducibility.
The finalized chromatographic conditions were as follows:
Under these optimized conditions, Azelnidipine produced a sharp, symmetrical, and well-resolved peak, indicating efficient separation and suitability of the method for routine quantitative analysis.
Linearity
The linearity of the RP-HPLC method was evaluated by analyzing standard solutions of Azelnidipine at different concentration levels. Calibration standards were prepared in the concentration range of 1–10 μg/mL, and each concentration was injected into the HPLC system under optimized conditions. The peak area was plotted against the corresponding concentration to generate the calibration curve.
Linearity Data
|
Concentration (μg/mL) |
Peak Area |
|
1 |
48,223 |
|
5 |
240,999 |
|
10 |
472,180 |
The regression analysis yielded the following equation:
Y = 47676.49x + 49674.69
with a correlation coefficient (R²) of 0.9996, demonstrating an excellent linear relationship between concentration and peak area. This confirms that the developed RP-HPLC method is linear over the selected concentration range.
Laboratory Solution Assay
The applicability of the optimized RP-HPLC method was assessed by analyzing laboratory-prepared standard solutions of Azelnidipine. The assay was performed in triplicate to evaluate repeatability and accuracy.
|
Parameter |
Value |
|
Mean % Estimation |
99.92 % |
|
Standard Deviation (SD) |
0.332 |
|
% Relative Standard Deviation (%RSD) |
0.333 |
The mean percentage estimation was very close to 100%, and the low %RSD value (<1%) indicates excellent precision and accuracy of the method for the estimation of Azelnidipine.
VALIDATION PARAMETERS – RP-HPLC Method
The developed RP-HPLC method was validated in accordance with ICH Q2(R1) guidelines to establish its suitability for analytical applications.
Accuracy
Accuracy was evaluated by recovery studies using the standard addition method at different concentration levels. The percentage recovery values ranged from 99.76% to 100.89%, with a mean recovery of 100.18%. These results indicate that the method is accurate and unaffected by formulation excipients.
Precision
Precision of the method was assessed by evaluating intraday (repeatability) and interday (intermediate precision) variations.
The low %RSD values (<2%) confirm that the method is highly precise under both same-day and day-to-day conditions.
Sensitivity
Sensitivity of the RP-HPLC method was determined in terms of Limit of Detection (LOD) and Limit of Quantitation (LOQ).
These low values demonstrate that the method is sufficiently sensitive to detect and quantify Azelnidipine even at low concentration levels.
Ruggedness
Ruggedness was evaluated by performing the assay under normal laboratory conditions using different analysts. The results showed:
The low %RSD value indicates that the method is rugged and reproducible, producing consistent results irrespective of analyst variation.
The developed RP-HPLC method for the estimation of Azelnidipine was found to be simple, accurate, precise, sensitive, linear, and rugged, with all validation parameters complying with ICH guidelines. The method provides sharp peak symmetry, excellent linearity, and reliable quantification across the studied concentration range.
When compared with the UV spectrophotometric simultaneous equation method, the RP-HPLC method offers higher sensitivity, specificity, and selectivity, making it particularly suitable for confirmatory analysis, stability studies, and advanced quality control applications. Meanwhile, the UV method remains appropriate for routine quality control due to its simplicity and cost-effectiveness.
Overall, both analytical methods are reliable and complementary, ensuring accurate estimation of Telmisartan and Azelnidipine in pharmaceutical dosage forms.
RESULTS AND DISCUSSION
A novel fixed-dose combination containing Azelnidipine (AZD) and Telmisartan (TEL) was selected for the present study, as no validated analytical method had been previously reported for their simultaneous estimation. Pure samples of Azelnidipine and Telmisartan were procured from Swapnroop Pharmaceuticals and Zydus Cadila, respectively. The objective of the study was to develop and validate simple, accurate, precise, sensitive, and economical analytical methods for the estimation of these drugs in combined pharmaceutical dosage forms.
Method 1: UV–Spectrophotometric Method
7.1 Simultaneous Equation Method for Estimation of Azelnidipine and Telmisartan
Both Azelnidipine and Telmisartan were found to be freely soluble in methanol; hence methanol was selected as the solvent for stock solution preparation, while 0.1 N hydrochloric acid was used as the diluent. Upon scanning in the UV range, Azelnidipine exhibited maximum absorbance at 249 nm, whereas Telmisartan showed maximum absorbance at 232 nm.
Both drugs obeyed Beer–Lambert’s law within the concentration ranges of 1–8 μg/mL for Azelnidipine and 5–45 μg/mL for Telmisartan, indicating good linearity. The developed method was successfully applied to the analysis of combined tablet dosage forms. The percentage label claim was found to be 100.22% for Azelnidipine and 100.03% for Telmisartan, which is in close agreement with the labeled amounts.
The accuracy of the method was confirmed by recovery studies performed at different levels, with %RSD values below 2%, demonstrating that the method is accurate and free from interference by excipients. Precision studies, including intra-day, inter-day, and repeatability, showed %RSD values less than 2%, indicating good precision of the method.
Validation Parameters (UV Method)
Table 26: Summary of Validation Parameters for AZD and TEL (UV Method)
|
Parameter |
AZD |
TEL |
|
Linearity range (μg/mL) |
1–8 |
5–45 |
|
Regression equation |
Y = 0.1165X − 0.0035 |
Y = 0.0196X − 0.0065 |
|
Recovery (%RSD) |
0.32340 |
0.18654 |
|
Precision (%RSD) – Intraday |
0.7823 |
0.3082 |
|
Precision (%RSD) – Interday |
0.2399 |
0.1979 |
|
Ruggedness (%RSD) |
0.077607 |
0.26364 |
|
Robustness (%RSD) |
0.4609 |
0.3539 |
|
LOD (μg/mL) |
0.96 |
0.11 |
|
LOQ (μg/mL) |
1.69 |
0.53 |
Method 2: RP-HPLC Method
7.2 Chromatographic Estimation of Azelnidipine Using RP-HPLC
An RP-HPLC method was developed and optimized for the estimation of Azelnidipine. Various combinations of aqueous and organic solvents were evaluated to obtain a sharp and symmetrical peak with acceptable retention time. An increase in flow rate resulted in reduced peak broadening and improved peak shape.
The optimized chromatographic conditions included a mobile phase of Water : Acetonitrile (75:25 v/v) at a flow rate of 1.0 mL/min. Under these conditions, Azelnidipine showed a retention time of 2.53 minutes, resulting in a short run time of less than 6 minutes, making the method rapid and economical.
The method was applied to pharmaceutical formulations, and the percentage label claim for Azelnidipine was found to be 99.92%, confirming the accuracy of the method. Precision studies revealed %RSD values below 2% for both intra-day and inter-day studies, indicating excellent precision.
Validation Parameters (RP-HPLC Method)
Table 27: Validation Parameters for AZD (RP-HPLC Method)
|
Parameter |
AZD |
|
Linearity range (μg/mL) |
1–9 |
|
Regression equation |
Y = 47676X + 49674 |
|
Retention time (min) |
2.53 |
|
Recovery (%RSD) |
0.331156 |
|
Precision (%RSD) – Intraday |
0.372951 |
|
Precision (%RSD) – Interday |
0.229772 |
|
Ruggedness (%RSD) |
0.709453 |
|
LOD (μg/mL) |
0.68 |
|
LOQ (μg/mL) |
1.68 |
SUMMARY
Recently, a fixed-dose combination of Azelnidipine and Telmisartan has been approved as a once-daily therapy for the management of hypertension and cardiovascular diseases. Azelnidipine acts as a calcium channel blocker, while Telmisartan is an angiotensin II receptor blocker, making the combination therapeutically effective.
Based on the literature survey, an attempt was made to develop simple, accurate, sensitive, rapid, and cost-effective analytical methods for the simultaneous estimation of Azelnidipine and Telmisartan in combined dosage forms using UV–Visible spectrophotometry and RP-HPLC.
Developed Methods
Method A: UV Spectrophotometric Simultaneous Equation Method
Method B: Reverse Phase High Performance Liquid Chromatography (RP-HPLC)
Table 28: Optical Characteristics and Validation Data
|
Method |
Drug |
Wavelength (nm) |
Range (μg/mL) |
LOD (μg/mL) |
LOQ (μg/mL) |
Precision (%) |
|
A |
AZD |
249 |
1–8 |
0.96 |
1.69 |
99.86 |
|
A |
TEL |
232 |
5–45 |
0.11 |
0.53 |
99.72 |
|
B |
AZD |
249 |
1–9 |
0.68 |
1.68 |
99.84 |
CONCLUSION
The developed UV spectrophotometric and RP-HPLC methods were found to be simple, accurate, precise, sensitive, repeatable, and economical. The UV method allows simultaneous estimation of Azelnidipine and Telmisartan without prior separation, making it highly suitable for routine quality control analysis.
The RP-HPLC method offers higher sensitivity and specificity, with short run time and excellent precision, making it suitable for confirmatory analysis and stability studies.
Based on the validation results and compliance with ICH guidelines, it can be concluded that the proposed methods are reliable and can be effectively employed for routine analysis of pharmaceutical dosage forms containing Azelnidipine and Telmisartan.
REFERENCES

Mazalkar Komal, Khan Hajera, Supriya Sawant, Hake P. S., Analytical Method Development and Validation of Azelnidipine and Telmisartan by Using UV and HPLC Technique, Int. J. of Pharm. Sci., 2026, Vol 4, Issue 2, 3162-3186. https://doi.org/10.5281/zenodo.18703687
 10.5281/zenodo.18703687