

We use cookies to ensure our website works properly and to personalise your experience. Cookies policy
New Montfort Institute of Pharmacy, Ashti Dist. Wardha 442202 (M.S.) India.
The present study was aimed at the development and validation of a simple, precise, accurate, rapid, and economical Reverse Phase High Performance Liquid Chromatographic method for the simultaneous estimation of Cefixime (CEF) and Linezolid (LIN) in bulk drug and pharmaceutical dosage form. Cefixime is a third-generation cephalosporin antibiotic widely used for the treatment of various bacterial infections, while Linezolid is an oxazolidinone antibiotic effective against Gram-positive pathogens. The combination of these two antibiotics requires a reliable analytical method for routine quality control analysis. Chromatographic separation was achieved using an Inertsil C18 column (4.6 mm × 250 mm, 5 µm particle size) as the stationary phase. The mobile phase consisted of Methanol and Phosphate Buffer (55:45, v/v) adjusted to pH 4.0, delivered at a flow rate of 1.0 mL/min. The analysis was carried out at a detection wavelength of 264 nm using a UV detector. The optimized chromatographic conditions provided satisfactory separation of Cefixime and Linezolid with well-resolved and symmetrical peaks within a short run time. The developed method was validated according to International Council for Harmonisation (ICH Q2(R2)) guidelines for various analytical performance parameters including specificity, linearity, accuracy, precision, robustness, limit of detection (LOD), limit of quantitation (LOQ), and system suitability. The method exhibited excellent linearity over the selected concentration ranges with correlation coefficients greater than 0.999 for both drugs. Precision studies showed percentage relative standard deviation (%RSD) values below 2%, confirming the reproducibility of the method. The proposed RP-HPLC method was found to be simple, sensitive, accurate, precise, and suitable for the routine quantitative analysis of Cefixime(CEF) and Linezolid (LIN) in bulk drugs and pharmaceutical dosage forms. Therefore, the developed method can be effectively employed for quality control and stability studies in pharmaceutical industries and research laboratories.
Analytical method development and validation are fundamental components of pharmaceutical analysis, ensuring the quality, safety, and efficacy of drug products. Regulatory authorities such as the International Council for Harmonisation (ICH), United States Pharmacopeia (USP), and other pharmacopoeial bodies emphasize the use of validated analytical methods for the assessment of pharmaceutical formulations. Among the available analytical techniques, Reverse Phase High Performance Liquid Chromatography (RP-HPLC) has gained significant importance due to its high sensitivity, specificity, precision, reproducibility, and capability to analyze complex pharmaceutical mixtures within a short period of time [1,2].
High Performance Liquid Chromatography (HPLC) is one of the most widely employed analytical tools in pharmaceutical industries for quantitative and qualitative analysis of active pharmaceutical ingredients (APIs), impurities, degradation products, and finished dosage forms. RP-HPLC utilizes a non-polar stationary phase and a relatively polar mobile phase, making it suitable for the separation of a wide range of pharmaceutical compounds. The technique offers excellent resolution, rapid analysis, and enhanced reproducibility, which are essential for routine quality control applications [3]. Cefixime (CEF) is a third-generation semisynthetic cephalosporin antibiotic with broad-spectrum antibacterial activity against both Gram-positive and Gram-negative microorganisms. It acts by inhibiting bacterial cell wall synthesis through binding to penicillin-binding proteins, resulting in bacterial cell lysis and death [4]. Chemically, Cefixime (CEF) is designated as (6R,7R)-7-[[(2Z)-2-(2-amino-4-thiazolyl)-2-(carboxymethoxyimino)acetyl]amino]-3-ethenyl-8-oxo-5-thia-1 azabicyclo oct-2-ene-2-carboxylic acid. It is commonly used in the treatment of respiratory tract infections, urinary tract infections, otitis media, gonorrhea, and other bacterial infections caused by susceptible organisms [5]. Linezolid (LIN) is a synthetic antibacterial agent belonging to the oxazolidinone class of antibiotics. It exhibits potent activity against multidrug-resistant Gram-positive pathogens, including methicillin-resistant Staphylococcus aureus (MRSA), vancomycin-resistant enterococci (VRE), and penicillin-resistant streptococci [6]. The mechanism of action of Linezolid involves inhibition of bacterial protein synthesis by binding to the 23S ribosomal RNA of the 50S subunit, thereby preventing the formation of the initiation complex required for translation [7]. Due to its unique mechanism of action, cross-resistance with other antibacterial agents is uncommon. The combination of Cefixime and Linezolid provides broad-spectrum antibacterial coverage and is useful in the management of mixed bacterial infections. The increasing utilization of combination antibiotic therapy necessitates the development of accurate, precise, and reliable analytical methods for simultaneous estimation of these drugs in pharmaceutical formulations. Simultaneous analytical methods are advantageous because they reduce analysis time, solvent consumption, and overall operational costs while improving laboratory productivity [8].
2. EXPERIMENTAL
2.1 Materials
CEF & LIN was supplied by MG Lab India Pvt Ltd and Sodium hydroxide was purchased from Molychem (Mumbai). Hydrochloric acid and hydrogen peroxide was procured from LOBA Chemie Pvt. Ltd. (Mumbai). HPLC grade methanol and acetonitrile was purchased from S. D. Fine-chem Ltd. (Mumbai) whereas HPLC grade water was purchased from Merck Ltd. All other chemicals were of analytical reagent grade. Zifi Turbo marketed formulation (manufacture by FDC Ltd India.) were purchased from Local market.
2.2 Chemical structure :

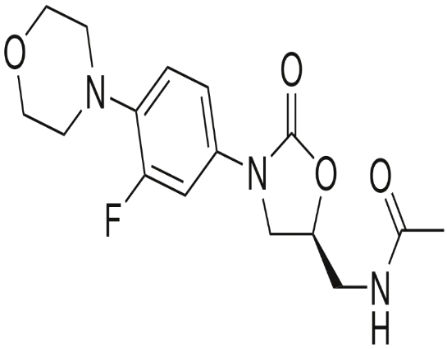
Fig. 1 Structure of Cefixime Fig. 2 Structure Linezolid
2.3 Instrumentation
The HPLC system consisting of Waters India model no 510 isocratic HPLC pump Spectra System with UV detector of Spectra System, manual rheodyne injection system, the software was an Data ace software version 6.1. The chromatographic separation was performed using Intersil C18 (250mm × 4.6 mm i.d., 5mm particle size) Separation was achieved using a mobile phase consisting of Methanol: Buffer in the ratio of (55:45) pH 4 at a flow rate of 1ml/min and UV detection at 264 nm. The column was maintained at ambient temperature with injection volume of 20 µl. The mobile phase was filtered through 0.45 µm Chrom Tech Nylon-66 filter and degassed in ultrasonic bath prior to use. A blank chromatogram was recorded before the studies. Quantization of result was performed using peak area counts.
2.4 Standard preparation
LIN standard solution:
Accurately weighed quantity 10 mg of LIN was dissolved in mobile phase and volume was made up to 100 ml mark. The stock standard solution was diluted further with mobile phase to get final concentration of about 60 mg/ml of LIN.
CEF standard solution:
Accurately weighed quantity 10 mg of CEF was dissolved in mobile phase and volume was made up to 100ml mark. The stock standard solution was diluted further with mobile phase to get final concentration of about 20 mg/ml of CEF.
2.5 System suitability test:
System suitability is a pharmacopoeial requirement and is used to verify, whether the resolution and reproducibility of the chromatographic system are adequate for analysis to be done. The tests were performed by collecting data from five replicate injections of standard solutions.
2.6 Application of proposed method for estimation of LIN and CEF Laboratory mixture
Three different laboratory mixtures of LIN and CEF were prepared by appropriately weighing the quantities of drug samples so as to get the concentration of 60 mg/ml of LIN and 20 mg/ml of CEF.
The peak area of standard laboratory mixture and sample laboratory mixture was compared to obtain the concentration.
2.7 Application of proposed method for estimation of LIN and CEF in formulation:
The twenty tablets were weighed, and then average weight was determined and finely grounded. Three different laboratory mixtures of LIN and CEF were prepared by appropriately weighing the quantities of drug samples so as to get the concentration of 60 mg/ml of LIN and 20 mg/ml of CEF.
3 RESULT & DISCUSSION:
3.1 Preparation of Calibration Curve: -
The mobile phase was allowed to equilibrate with the stationary phase until steady baseline was obtained. The series of concentration from mg/ml for 10-100 mg/ml LIN and 5-50 mg/ml for CEF drug solutions were injected and peak area was recorded. The graph plotted as the concentration of the drug Vs peak area depicted in Fig. No.3 and 4.
3.2 Method Validation
3.2.1 Specificity (Selectivity)
Specificity was measured as ability of the proposed method to obtain well separated peak for LIN and CEF without any interference from component of matrix.
Mean retention time for –
LIN – 8.254
CEF – 5.871
The values obtained were very close to that in standard laboratory mixture indicates no interference from the component of matrix.
Typical chromatogram is shown in the Fig. No.5
3.2.2. Accuracy and precision
It was ascertained on the basis of recovery studies performed by standard addition method. The results of recovery studies and statistical data are recorded in Table No. 3 Precision of an analytical method is expressed as S.D or R.S.D of series of measurements. It was ascertained by replicate estimation of the drugs by proposed method.
3.2.3 Ruggedness:
The studies of ruggedness were carried out under two different conditions-
a) Days
b) Analyst.
a) Interday (Different days):
Same procedure was performed as under marketed formulation analysis on different days. The % label claim was calculated. Data obtained for day 1, day 2, and day 3 is shown in Table No. 4
b) Different analyst:
The sample solution was prepared by two different analysts and same procedure was followed as described earlier. The % label claim was calculated as done in marketed formulation estimation.
Tables:
Table No1 . : Summary of system suitability test results
|
Sr. no. |
Parameter |
LIN |
CEF |
|
1. |
Peak area |
235679.8 |
52290.6 |
|
2. |
Retention time (min) |
8.2546 |
5.871 |
|
3. |
Asymmetry |
1.845 |
1.1456 |
|
4. |
Efficiency |
217921.61 |
72442.88 |
*Results are mean of five replicates
Table No. 2: Summary of laboratory mixture and marketed formulation analysis by RP-HPLC Method
|
Sr. no. |
Sample |
Statistical data |
% Estimation |
% Recovery |
||
|
LIN |
CEF |
LIN |
CEF |
|||
|
1. |
Standard Laboratory mixture |
Mean |
100.07 |
99.63 |
- |
- |
|
S.D. |
0.153 |
0.208 |
- |
- |
||
|
C.V. |
0.002 |
0.002 |
- |
- |
||
|
2. |
Zifi Turbo |
Mean |
100.33 |
100.03 |
100.18 |
100.33 |
|
S.D. |
0.929 |
0.551 |
0.484 |
0.758 |
||
|
C.V. |
0.009 |
0.006 |
0.005 |
0.008 |
||
Table No 3: Summary of validation parameters for the proposed method
|
Validation Parameters |
LIN |
CEF |
|
Linearity μg mL-1 |
10-100 |
5-50 |
|
Accuracy mean |
100.18 |
100.33 |
|
Precision (% RSD) |
0.003 |
0.002 |
Table No 4: Summary of Ruggedness by RP-HPLC method
|
Parameter |
Statistical data |
% Estimation by RP-HPLC method |
|
|
LIN |
CEF |
||
|
Interday |
Mean |
99.80 |
101.17 |
|
S.D. |
0.265 |
0.306 |
|
|
C.V. |
0.003 |
0.003 |
|
|
Intraday |
Mean |
100.07 |
100.10 |
|
S.D. |
0.153 |
0.436 |
|
|
C.V. |
0.002 |
0.004 |
|
|
Different analyst |
Mean |
99.88 |
100.02 |
|
S.D. |
0.258843582 |
0.277488739 |
|
|
C.V. |
0.002591546 |
0.002774333 |
|
Table No.5: Result and statistical data of Different analyst study
|
Sr. No. |
% Label claim |
|||
|
ANALYST I |
ANALYST II |
|||
|
LIN |
CEF |
LIN |
CEF |
|
|
1 |
99.8 |
99.6 |
99.4 |
99.9 |
|
2 |
99.7 |
100.1 |
99.6 |
100.1 |
|
3 |
99.6 |
100.2 |
100.8 |
99.6 |
|
4 |
100.1 |
99.9 |
100.9 |
100.3 |
|
5 |
100.2 |
100.3 |
101.1 |
100.4 |
|
Mean |
99.88 |
100.02 |
100.36 |
100.06 |
|
± S.D |
0.258843582 |
0.277488739 |
0.795613 |
0.320936131 |
|
C.V |
0.002591546 |
0.002774333 |
0.007928 |
0.003207437 |
Table No.6: Observations of Linearity and range study
|
Sr. No. |
%Label claim |
Peak area |
|
|
LIN |
CEF |
||
|
1 |
80 |
188523 |
41838 |
|
2 |
90 |
212088 |
47068 |
|
3 |
100 |
235654 |
52298 |
|
4 |
110 |
257219 |
57527 |
|
5 |
120 |
282784 |
62057 |
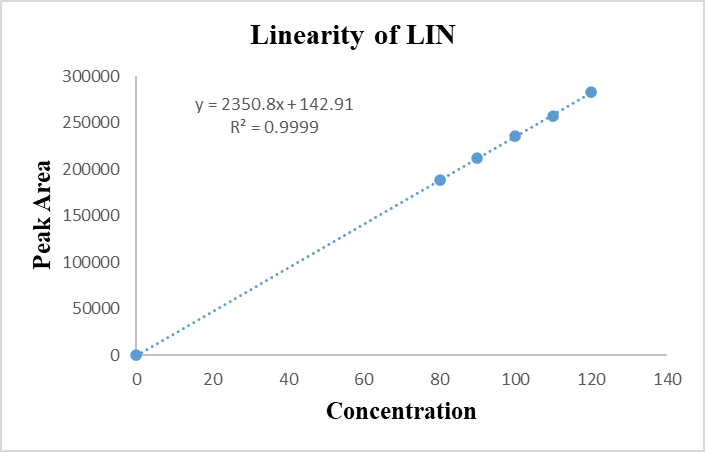
Fig. No.3: -Plot of linearity and range study for LIN
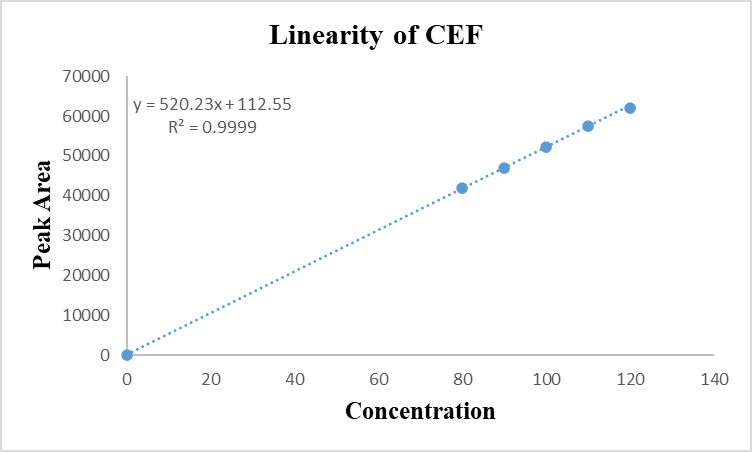
Fig. No.4: -Plot of linearity and range study for CEF
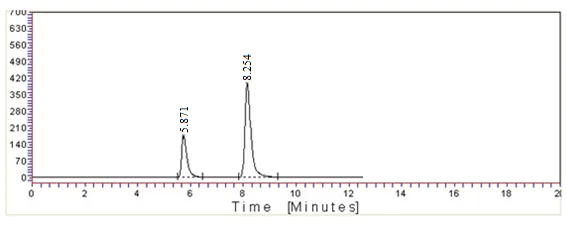
Fig. No.5: Chromatogram obtained by formulation of LIN & CEF
REFERENCES

Muskan Khan Dr. Mudabbirul Haque, Mohd Bilal Sufi, Analytical Method Development & Validation for The Combination of Cefixime and Linezolide in Bulk & It’s Dosage Form by Using RP-HPLC, Int. J. of Pharm. Sci., 2026, Vol 4, Issue 7, 2395-2402, https://doi.org/10.5281/zenodo.21323270
 10.5281/zenodo.21323270