

We use cookies to ensure our website works properly and to personalise your experience. Cookies policy
1 Gujarat Technological University, India.
2 Saraswati Institute of Pharmaceutical Sciences, Gandhinagar, India.
3,4 Smt. S.M. Shah Pharmacy College, Ahmedabad, India.
Accurate quantification of active pharmaceutical ingredients in multicomponent mixtures using spectrophotometer analyzer remains a significant challenge in pharmaceutical analysis due to spectral interference. Two accurate, simple, and precise chemometric techniques, principal component regression (PCR) and partial least squares (PLS) were used to resolve the severely overlapped UV spectra of apixaban and clopidogrel bisulfate. The concentration ranges of the developed models were found to be (1.5 – 3.5 ?g/mL) for apixaban, (45 – 105 ?g/mL) for clopidogrel bisulfate. The respective correlation coefficients of the PLS-1 model for apixaban and clopidogrel bisulfate were calculated to be 0.999 and 0.996. The proposed methods were found to be green, rapid, and were effectively used to analyze the studied compounds in both laboratory-prepared mixtures. The obtained results revealed that PLS algorithm was superior to PCR depending on the lowest root mean square error of prediction (RMSEP) and correlation coefficient values (r). PCR and PLS is ideal for data analysis and enhancing model performance and robustness by focusing on the most relevant spectral regions. Once the model is built, it takes no time to predict multiple samples without requiring reconstruction, in addition, the proposed models minimize the costs of solvents and equipment compared to HPLC, making them a valuable option for quality control laboratories.
Apixaban (APX) is a potent oral anticoagulant agent reversible, direct, and highly selective active site inhibitor of factor Xa. It prevents thrombin generation and thrombus development by inhibiting free and clot-bound factor Xa and prothrombinase activity [1–3]. APX’s chemical name is a 1-(4-methoxyphenyl)-7-oxo-6-[4-(2-oxopiperidin-1-yl) phenyl]-4,5,6,7-tetrahydro-1H-pyrazolo[3,4-c] pyridine-3-carboxamide [4]. Clopidogrel bisulfate (CLB) is an antiplatelet prodrug, works as a platelet aggregation inhibitor by inhibiting adenosine diphosphate binding to its receptor, and the subsequent ADP-mediated activation of the glycoprotein GPIIb/IIIa complex [4,5]. It is synthesized as clopidogrel hydrogen sulfate salt. Chemically, it is methyl (+)-(S)-α-(2-chlorophenyl)-6,7-dihydrothieno[3,2-c]pyridine-5(4H)-acetate sulfate (1 : 1) [4]. The chemical structure of APX and CLB is shown in Figure. Combined use of anticoagulant and antiplatelet medications is common among comorbid cardiovascular patients, including atrial fibrillation (AFib) and recent acute coronary syndrome (ACS) or percutaneous coronary intervention (PCI) [4,5]. They are used as prophylaxis and treatment of thromboembolic events. In addition, the formulation of fixed-dose combination (FDC) may enhance their pharmacological effect [4,5].
The combination of drugs is crucial in the treatment process, as they reduce costs and increase the effectiveness and safety of treatment. Proper analysis of mixtures is a major challenge in the pharmaceutical industry for compounded drugs, and it can also be recalled. Currently, there are numerous analytical multicomponent methods that can simultaneously determine two drugs, such as gas chromatography/mass spectrometry (GC-MS), high performance liquid chromatography (HPLC), spectrophotometry and HPTLC. Among them, the UV-Vis spectrophotometer analysis method is more attractive than other methods for researchers in this field due to its fast analysis, reasonable cost, and ease of implementation. Furthermore, numerous mathematical equations and models have been developed to analyze UV-Vis spectrophotometer data, including least squares models, principal component analysis, and others [6,7].
Partial least square (PLS) calibration is one of the inverse calibrations, and is calculated using least squares algorithms. PLS is intended to establish a linear correlation between two matrices, the spectral data X and the reference or actual values of Y. In PLS, the matrices X and Y are modeled in order to find out the variables in X matrix capable of describing the Y matrix. PLS is the calibration technique widely used in analysis of multicomponent in pharmaceuticals [6–9].
HPLC and HPTLC are both reliable methods to quantify components in a mixture. These methods take a significant amount of time and have a laborious process. Consequently, spectrophotometric techniques are preferred due to their low operational cost and quick procedure [10,11]. Among the various multivariate approaches, the combination of UV-Vis spectrophotometry with partial least squares regression (PLS) offers significant advantages in the simultaneous quantification of overlapping spectra compounds such as APX and CLB. UV-Vis is known for its speed and low operational cost, while PLS enhances its predictive accuracy by modeling complex linear relationships in spectral data without requiring chemical separation. This makes it particularly effective for analyzing compounds with highly similar absorption profiles in combined pharmaceutical formulations [6–9].
Combination drug products containing APX, an oral anticoagulant, and CLB, an antiplatelet agent, are widely used in the management of thromboembolic disorders. Accurate and reliable analytical methods are essential for quality control of such multicomponent formulations.
The literature review on APX primarily focuses on UV spectrophotometry [12,13], HPLC [14–17], LC-MS [18], and HPTLC [19,20] as analytical techniques for bulk and pharmaceutical formulations. A review of the literature on CLB found methods such as UV spectrophotometry [21–25], HPLC [26–30], and HPTLC [26,31] for quantitative measurement in bulk and pharmaceutical dosage form. Both drugs simultaneously estimated using HPLC method [4,5]. Conventional chromatographic techniques such as HPLC provide high selectivity but are time?consuming, solvent?intensive, and less economical for routine analysis.
UV spectrophotometry is an attractive alternative due to its simplicity, rapidity, and low operational cost [10,11]. However, the severe overlap of absorption spectra of APX and CLB limits the applicability of classical univariate spectrophotometric methods. Chemometric techniques, including principal component analysis (PCA) and partial least squares (PLS) regression, enable the extraction of quantitative information from highly overlapping spectral data. The present work aims to develop and validate chemometric?assisted UV spectrophotometric methods for the simultaneous determination of APX and CLB using PCA and PLS model in the combined pharmaceutical formulations. Two prediction analytical methods of principal component analysis (PCA) and partial least square (PLS) were developed to accurately quantify above mentioned drugs in the solutions.
MATERIALS AND METHODS
Material and solvents
APX and CLB with certified purities of 100.37 ± 1.727 and 99.91 ± 0.855 respectively, were generously provided by Alembic Pharmaceutical Pvt. Ltd., Vadodara, Gujarat, India, and Sunij Pharma Pvt. Ltd., Ahmedabad, Gujarat, India. HPLC grade of methanol were purchased from Merck Ltd., Mumbai, India.
Apparatus and software
Spectrophotometer UV-Vis (Shimadzu, Japan) type UV 1800 equipped with quartz cuvette 1 cm (Hellma, USA) was used for UV spectra acquisition. The UV spectral data were exported to Excel (Microsoft Inc., USA) and manipulated using XLSTAT statistical software for Excel. All measurements were performed using 1cm quartz cells over the wavelength range of 200-400 nm with 3nm interval.
Stock standard solutions
For preparing a standard solution, an accurate amount of 10 mg of APX and 300 mg of CLB was weighed. After being transferred to a 10 ml volumetric flask 5 ml of methanol was added and sonicated, and the volume was increased to 10 ml using methanol. 1 ml of the previous solution was transferred to a 10 ml volumetric flask and the volume was again increased to the mark with methanol. 2.5 ml of the previous solution was diluted to 10 ml with methanol to get a working solution containing 2.5 μg/mL of APX and 75 μg/mL of CLB.
Designing the experiments to validate the PLS and PCA models
A five-level two-factor experiments design was employed to evaluate the accuracy of the models. A total of 25 samples were prepared by mixing the stock solutions in various proportions. The absorbance spectra of the samples were recorded in the range from 200 to 400 nm, using spectral interval of 0.5 nm (Fig. 1). The region from 200 to 222 nm and 282 to 400nm was excluded from the analysis due to spectral noise.
Calibration set and model construction
Table 1 presents twenty-five binary samples of APX and CLB, used as the calibration set for creating the Partial Least Squares (PLS) regression and Principal Component Analysis (PCA) models. The UV-Vis spectral data were recorded in the 222-282nm range with a spectral interval of 0.5 nm.
The data was divided into calibration and test sets with an approximate 75:25 ratio. The leave-out-one cross-validation method was employed to validate the PLS and PCA models for simultaneous prediction of two drugs. This method is a precise and randomized approach for assessing model performance, partially when the sample is small. Leave-out-one cross-validation is a special case of k-fold cross-validation where the number of folds equals the number of samples.
Partial least square regression model (PLS)
Partial least squares regression (PLS) is a chemometric modelling approach widely used for simultaneous quantification of drugs with overlapping spectral features. Unlike principal component regression (PCR), PLS maximizes the covariance between original data (spectral data and concentration values), allowing better prediction performance in presence of collinearity and noise [6–9].
In general, the model of PLS is defined by Equations (11) and (12):
|
X= |
APT + C …. (11) |
|
Y= |
BQT + E …. (12) |
where X, Y, A, and B are the, absorbance data, concentration, X-score, and Y-score matrices, respectively. T is the score matrix (latent variables) representing the projections of the original data. E and C are residual matrices (Y-residual, X-residual), and the variables P and Q are the loading matrices (X-loading, Y-loading), respectively.
The X-scores matrix is a predictor of X and is denoted as follows:
|
A= |
XW …. (13) |
In Eq. (13), This equation calculates the X-score matrix (A), which represents the latent variables or factors extracted from the original predictor data (X). It is derived by projecting the (X) data onto the initial X-weight matrix (W). These scores capture the maximum variance relevant for predicting Y. W can be calculated by Eq. (14):
|
W = |
BC BTB …. (14) |
In the above equation, B and C are the Y-scores (B) and the X-residuals (C), linking the (X) and (Y) information to ensure the weights maximize the covariance between the two matrices. The residuals indicate the differences between the real values and the predicted values. In addition, the score matrices are linear equations of response and projector (concentration and absorbance in this case).
C=Xresij = Xij – APT …... (15)
E=Yresik = Yik – AQ …... (16)
B = Y x Q …... (17)
The loading matrices are linear coefficients that relate original variables (responses and predictors) to their corresponding score matrices.
PT= P’= ATXX
ATA …… (18)
QT = Q’= ATY …… (19)
At each iteration, PLS constructs a set of loading vectors that incorporate concentration data and spectral features. PLS can be divided into two algorithms: PLS-1 and PLS-2. PLS-1 algorithm focuses on modeling each desired component, using specific set of loading and score vectors for each component. PLS-1 typically yields more accurate predictions than the PLS-2 and PCR, especially when dealing with highly collinear spectral data. PLS models have gained widely application in the pharmaceutical and chemical industries for the quantitative analysis of multicomponent mixtures. Their ability to handle large datasets with highly correlated variables make them a robust and reliable choice for spectroscopic modeling23.
Principal component analysis (PCA)
Principal component analysis is an unsupervised recognition technique widely used for noise elimination and dimension reduction. This model converts a set of correlated variables into uncorrelated variables known as principal components (PCs). The first PC has the maximum correlated variables within dataset, and increasing the number of PCs reduces the number of correlated variables 26. In general, the PCA model is expressed by Eq. (20):
X = TP + E …… (20)
where X, T, P, and E are observed data, scores, loading vectors, and residual matrices, respectively. However, in cases where component variables are correlated, classical PCA may not adequately interpret the underlying data variability. To address this, the Varimax rotation (VR) method can be applied. VR enhances the interpretability of PCs, by increasing association of each variable with a specific uncorrelated factor. VR can be calculated by Eq. (21):
RVarimax=argmaxR1Mj=1Ai=1MARij4- j=1A1Mi=1MARij22…….. (21)

where A and R are rotation matrix and the unrotated matrices, respectively. After applying Varimax rotation, the PCA model reorients the factors to achieve a simpler and more interpretable structure in which each factor is characterized by a small number of large loadings [6,32,33].
RESULTS AND DISCUSSION
Chemometrics assisted methods
When there is no need for separation processes prior to determination, chemometrics technologies are typically used for multivariate spectral analysis of pharmaceutical mixes consisting of two or more medicines with significantly spectra that overlap [6,9,32,33]. Three multivariate chemometric approaches, namely; PLS and PCR were carried out for the simultaneous quantification of APX and CLB in this work. By predicting the unidentified concentrations of the three mentioned components in their ternary mixtures utilizing the data matrices for absorbance and concentration, these strategies enabled calibration. The UV-Vis spectra of the drug mixture were recorded, and the degree of spectral overlap was examined by individually scanning the UV absorbance spectra of APX and CLB over the range of 200 nm to 400 nm (Figure. 1). Twenty-five combinations' UV spectra were scanned and saved between 222.0 and 282.0 nm, as indicated in Figure 2, where the suggested models were validated using twelve of them and thirteen combinations of them were used to calibrate them, as stated in Table 2 and Table 3. Since they are less beneficial, wavelengths longer than 282.0 nm were left out. Wavelengths below 222.0 nm were not included because of significant noise. The chemometrics literature has focused a lot of attention on factor analysis-based regression techniques, such as principal component regression (PCR) and partial least squares regression (PLS) among the several regression methods available for multivariate calibration (20). Owing to the mentioned medications' overlapping spectrum Figure 2. This binary mixture has been analyzed using the earlier chemometric techniques. In order to avoid over-fitting, the number of components should take into consideration as much as possible of the experimental data. A lot of criteria have been devised in order to determine the ideal number. One sample at a time, cross-validation techniques were used. In order to avoid over-fitting, the number of components should take into consideration as much as possible of the experimental data. In each calibration sample, the anticipated and known amounts of the chemicals were compared.
An external validation set was employed to evaluate the suggested models' capacity for prediction. The Validation set analysis by PLS method for APX and CLB shown in Table 4 and 5. The predictive performance of the developed PLS model was comprehensively evaluated using statistical parameters including RMSEC, RMSEP, PRESS, coefficient of determination (R²), Durbin–Watson statistics, and percentage relative error of prediction (%REP) shown in Table 6. The validation samples' % recoveries are displayed in Table 6. The recommended techniques were legitimate and appropriate for the examination of the listed medications in laboratory prepared tablet form, as demonstrated in Table 7. The observed spectral overlap made a significant deviation in quantifying the amount of drug in the mixture. Therefore, PLS, and PCA were employed for simultaneous determination of both analytes in the APX and CLB in binary mixture.
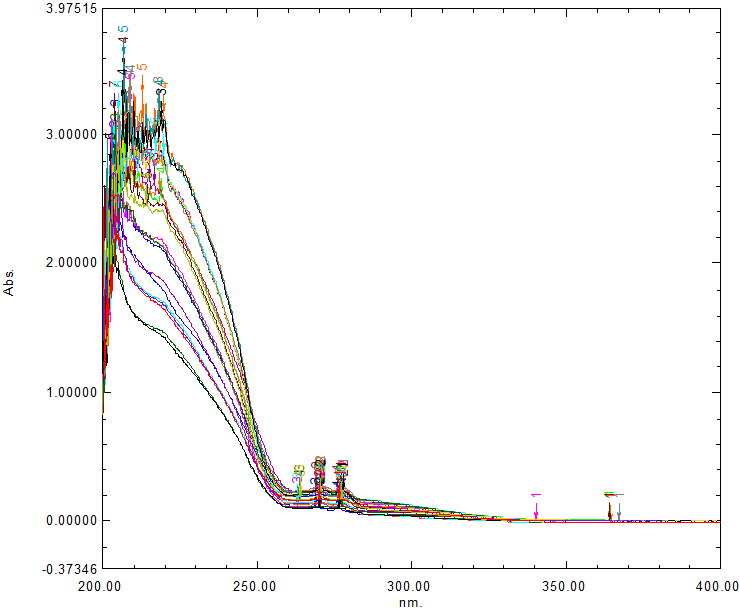
Figure 1: Overlain UV Spectra of 25 set of APX and CLB
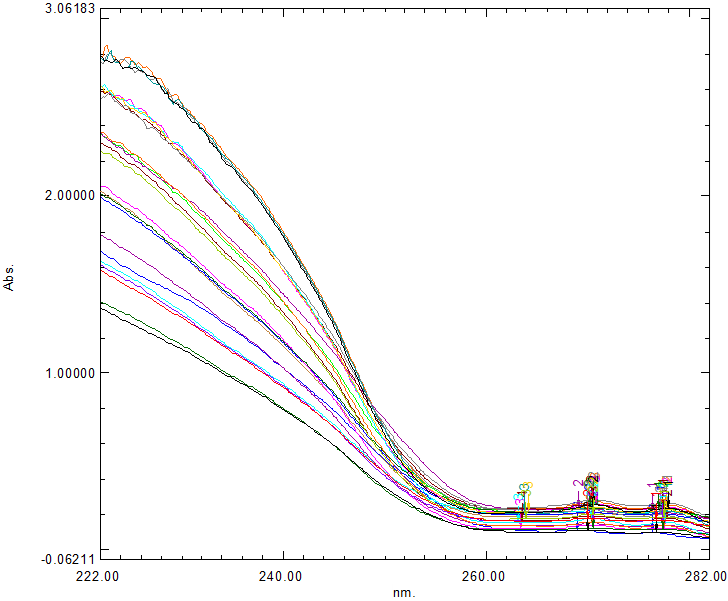
Figure 2: Overlain UV Spectra of 25 set of APX and CLB for 222 nm – 282 nm region
Validation of the PLS and PCA model
Training of the calibration set was performed using the PLS-1 and PCA models. Then, a set of unobserved samples was applied to the model. The predicted concentrations for both the calibration and validation sets are presented in Tables 2 to table 5, respectively. As illustrated in Figure 3, a comparison of the predicted values versus the experimental results yields a regression line with a slope close to 1. This indicated strong predictive performance of the model for the simultaneous quantification of APX and CLB in a two-component solution.
Linearity and range
In the science of chemical detection, the linear range refers to an analytical range over which the analytical results are obtained without requiring sample dilution. According to Beer’s law, the linear ranges for APX and CLB were determined to be 1.5 – 3.5 μg/ml and 45 - 105 μg/ml, respectively. These results demonstrate the high linearity of proposed method across the specified ranges.
Accuracy
Accuracy is defined as the closeness of the measured values to actual value and is typically determined using the recovery value. The accuracy was measured by calculating the recovery rate of standard solutions and drug mixtures with two replicates on one day and one replicate on the next day. The results shown in a Table 7 that the percentages of recovery for the Q-analysis method were 100.27 % - 100.71 % for APX and 99.91 % - 100.20 % for CLB. These values indicated method provided acceptable accuracy within the analytical standards.
PCA Analysis
Principal Component Analysis (PCA) was performed on the UV spectral dataset of APX and CLB to evaluate the intrinsic data structure and to identify the number of significant latent variables required to describe the spectral variance. The eigenvalues corresponding to factors F1–F24 are presented in the eigenvalue table 8.
The results demonstrated that Factor F1 exhibited the highest eigenvalue, accounting for the maximum proportion of variance in the dataset, followed by Factor F2. Together, the first two factors explained the major share of total variance, indicating that most of the relevant spectral information of APX and CLB is captured within these components. A pronounced decrease in eigenvalues was observed beyond F2, reflecting a sharp drop in explained variance.
Factors F3 onward showed progressively lower eigenvalues, with several factors exhibiting eigenvalues less than unity. According to the Kaiser criterion, such factors contribute negligibly to the overall variance and are generally associated with noise or redundant information rather than meaningful chemical variation.
PLS Calibration Model
Based on the PCA findings, Partial Least Squares (PLS) regression was employed for quantitative modeling. The calibration results for APX and CLB showed a close agreement between actual and predicted concentrations across the studied ranges.
For APX, the predicted concentrations closely matched the actual values, with low residuals and standardized residuals uniformly distributed around zero. The mean values at each concentration level showed minimal standard deviation, and the percentage relative standard deviation (%RSD) ranged from 0.629 to 1.645%, indicating excellent precision of the calibration model (Table 2).
Similarly, for CLB, the PLS calibration model demonstrated strong predictive capability. The residual and standardized residual values were small and randomly distributed, confirming the absence of systematic error. The %RSD values for CLB ranged from 0.257 to 1.086%, reflecting high repeatability and robustness of the model across all concentration levels (Table 3).
The low residual errors and narrow dispersion of predicted values confirm the suitability of the PLS model for simultaneous determination of APX and CLB.
3.3 PLS Validation
The predictive performance of the developed PLS models was further evaluated using an independent validation dataset. For APX, the validation results showed excellent agreement between actual and predicted concentrations, with very low residuals and %RSD values not exceeding 1.411%, confirming the accuracy and precision of the model (Table 4).
For CLB, the validation set also demonstrated satisfactory predictive performance, with %RSD values ranging from 0.088 to 0.934%. The low standard deviation and absence of significant bias in predicted concentrations indicate good generalization ability of the model (Table 5).
Overall, the validation results confirm that the developed PLS models are reliable and suitable for routine quantitative analysis of APX and CLB in combined formulations.
3.4 Overall Interpretation
The PCA eigenvalue analysis confirmed that the spectral variance of APX and CLB is primarily governed by the first few factors, supporting effective dimensionality reduction. The subsequent PLS calibration and validation results demonstrated high accuracy, precision, and robustness, validating the combined PCA–PLS chemometric approach for the simultaneous determination of APX and CLB.
Residual analysis
The residual plots play a crucial role in model validation by illustrating the discrepancies between model results and observation data. Residual error analysis can be used to draw residual concentration plots of drugs separately. Figure 2 depicts the residual plot for PLS model for two drugs (APX and CLB). The most residuals of APX observations were within the range of -0.05 to 0.05 (Figure. 3) in the PLS model.
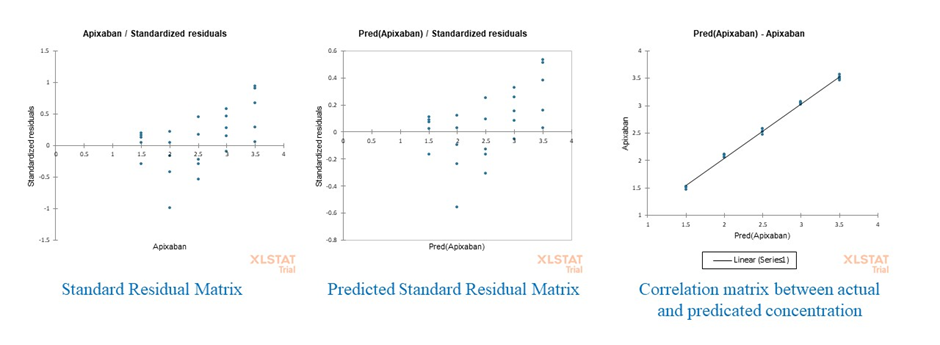
Figure 3: Graphical evaluation of PLS model performance for APX, including (a) standard residual matrix, (b) predicted standard residual matrix, and (c) correlation plot between actual and predicted concentrations.
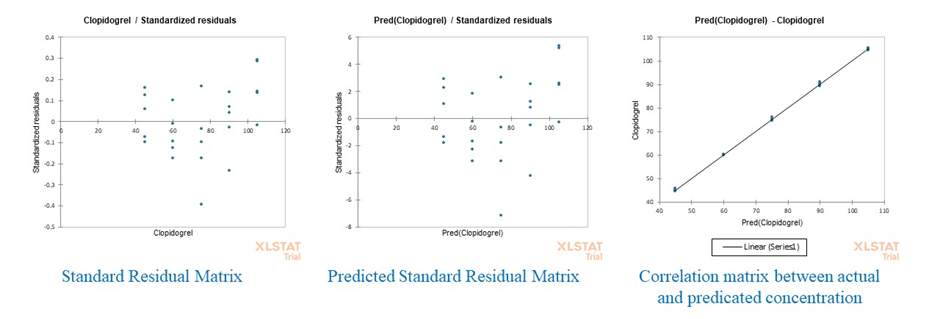
Figure 4: Graphical evaluation of PLS model performance for CLB, including (a) standard residual matrix, (b) predicted standard residual matrix, and (c) correlation plot between actual and predicted concentrations.
In contrast, the most residuals of CLB measurements were within -0.3 to 0.3 (Fig. 4) for PLS model. These results indicated that both models showed homogeneous residual distribution around the zero-error line, implying no systemic bias and confirming the adequacy and reliability of PLS and PCA for multivariate calibration in this study. The noteworthy finding in the results analysis was the absence of any systematic pattern in the distribution residuals. The random scatter of residuals did not contradicts the linear assumption. The results of the residual error for both models were satisfactory and confirmed the suitability and robustness of the models for the simultaneous quantification of APX and CLB in the two-component solutions prepared in pure ethanol as solvent.
Normality
One critical parameter in regression validation model that needs investigating is the normality of the residuals, as deviation from normality. This parameter may indicate model inadequacy or bias. The residuals of both models show good normality, with no evidence of skewness, furthermore affirming the statistical validity of the models.
Statistical analysis
The multivariate analytical figures of merit (FOM) parameters and a set of important statistical parameters used to validate the model, including the correlation coefficient (), root mean square error of prediction (RMSEP), root mean square error of calibration (RMSEC), and relative prediction error (REP). RMSEP, RMSEC, and prediction residual error sum of squares (PRESS) of the models. These parameters can be calculated as per Eq. 26 to 29.
The predictive performance of the developed PLS models was evaluated using RMSEC and RMSEP. For Apixaban, RMSEC and RMSEP values of 0.252 and 0.090, respectively, were obtained, indicating excellent calibration and prediction accuracy. For Clopidogrel, RMSEC and RMSEP values were found to be 2.906 and 1.065, respectively. The lower RMSEP values compared to RMSEC confirm the robustness and good predictive capability of the proposed chemometric models.
The overall prediction error was further assessed using the prediction residual error sum of squares (PRESS). For APX, PRESS values of 1.586 and 0.0649 were obtained for the calibration and prediction sets, respectively. In the case of CLB, PRESS values were found to be 211.115 for calibration and 9.072 for the prediction set. The low PRESS values, particularly for the prediction datasets, indicate good predictive ability and confirm the robustness of the proposed chemometric models.
Application to pharmaceutical dosage form
The proposed multivariate chemometric models were used for the determination of APX and CLB in their laboratory prepared mixture. Samples were scanned and the data were processed as specified by each model. The recovery and standard deviation values are shown in Table 5. The models were successfully applied for predicting the concentration of the studied compounds. Furthermore, the methods determined the, APX and CLB, which were found to be 100.40 % and 100.25 %, respectively.
CONCLUSION
In the present study, chemometric-assisted UV spectrophotometric methods were successfully developed and validated for the simultaneous determination of APX and CLB in binary mixtures. Multivariate calibration techniques, namely PCA and PLS, were employed to overcome the strong spectral overlap between the two drugs and to enhance analytical performance compared to conventional univariate approaches. PCA was applied as an exploratory tool to evaluate the intrinsic structure of the spectral dataset. Eigenvalue analysis revealed that the majority of spectral variance was captured by the first few principal components, while higher-order factors contributed negligibly, confirming effective dimensionality reduction and strong collinearity among spectral variables. These findings justified the subsequent application of supervised multivariate calibration. The PLS-1 model demonstrated excellent quantitative performance for both drugs. For APX, the model showed high linearity (R² = 0.9937) with low prediction errors and a percentage relative error of prediction (%REP) of 3.60% over the concentration range of 1.5–3.5 µg/mL. Similarly, CLB exhibited outstanding predictive accuracy with R² = 0.9995, and a low %REP of 1.42% within the range of 45–105 µg/mL. The low PRESS values obtained for both analytes further confirmed the robustness and reliability of the developed models. Residual analysis revealed a random and homogeneous distribution around the zero-error line, with no evidence of systematic bias, confirming the adequacy of the linear modeling approach. Although the Durbin–Watson statistics indicated mild autocorrelation effects—commonly observed in concentration-ordered calibration datasets—the overall predictive performance remained unaffected. Overall, the proposed PCA–PLS chemometric framework provides a simple, rapid, accurate, and sensitive analytical approach for the simultaneous quantification of APX and CLB without prior separation. The method is well suited for routine quality control analysis of combined pharmaceutical formulations. Future work will focus on extending the validated PLS model to biological matrices and dissolution studies, thereby broadening its applicability in pharmaceutical and clinical analysis.
REFERENCES

Rashmi Shukla, Dr. Ankit Chaudhary, Pinak Patel, Krunal Detholia, Chemometric-Assisted UV Spectrophotometric Method for Simultaneous Estimation of Apixaban and Clopidogrel Bisulphate: Development, Validation, and Application in Synthetic Mixture, Int. J. of Pharm. Sci., 2026, Vol 4, Issue 3, 3943-3956. https://doi.org/10.5281/zenodo.19338869
 10.5281/zenodo.19338869