

We use cookies to ensure our website works properly and to personalise your experience. Cookies policy
Department of Pharmaceutics, T. John College of Pharmacy, Bengaluru, Karnataka, India.
The present study aimed to design and characterize Atenolol loaded Nanostructured Lipid Carriers (NLCs) to enhance permeation and bioavailability. Atenolol, a BCS Class III drug with high solubility and low permeability, was incorporated into Nanostructured lipid carriers using the Solvent evaporation method. A Central Composite Design (CCD) was employed to optimize the formulation variables, including solid lipid and surfactant concentrations. The optimized formulation (F14) was evaluated for entrapment efficiency, particle size, zeta potential, in-vitro drug release, and morphology. The optimized NLCs formulation exhibited an entrapment efficiency of 83.93%, a drug release of 74.7% at 8 hours, and uniform vesicle morphology under SEM. The optimized NLCs were successfully incorporated into controlled release capsules, evaluation parameters were within pharmacopeial limits. The controlled release profile of the optimized capsules suggests the potential and achieve better blood pressure control. Overall, the study demonstrates that Atenolol-loaded NLCs are a promising strategy to improve bioavailability, reducing first-pass metabolism, controlled drug release, and provide an effective oral dosage form for hypertension management.
Oral drug delivery is the most widely accepted and preferred route of drug administration for both conventional and advanced drug delivery systems because of its convenience, non-invasive nature, and high patient compliance. It is commonly employed for systemic drug delivery owing to its ease of administration, cost-effectiveness, and suitability for self-medication1. It is the most common method used for systemic drug delivery and accounts for the majority of pharmaceutical products available in the market. Nearly 90% of pharmaceutical formulations intended for human use are administered orally, and approximately 84% of the most prescribed medicines are available as oral dosage forms. The global market for oral pharmaceuticals continues to expand steadily due to their widespread acceptance and therapeutic advantages2.
Drugs administered orally are absorbed primarily through the gastrointestinal tract, particularly the small intestine, before entering the systemic circulation to produce the desired therapeutic effect. This route is considered the most convenient because it allows self-administration, improves patient adherence to therapy, and eliminates the need for trained healthcare professionals. Owing to these advantages, oral administration remains the preferred choice for the treatment of both acute and chronic diseases3. Among oral dosage forms, tablets and capsules are the most frequently prescribed because they are easy to manufacture, stable during storage, and well accepted by both patients and healthcare professionals. Advances in pharmaceutical technology have enabled the development of oral formulations ranging from immediate-release to controlled-release and site-specific drug delivery systems, thereby improving therapeutic outcomes1.
The oral route provides a large absorptive surface area, making it suitable for delivering a wide range of therapeutic agents. However, these dosage forms often produce fluctuations in plasma drug concentrations due to rapid drug release and elimination. Such variations may reduce therapeutic efficacy or increase the risk of adverse effects when drug levels exceed the therapeutic window. To overcome these limitations, sustained-release drug delivery systems have been developed. These systems are designed to control the rate of drug release over an extended period, thereby maintaining drug concentrations within the therapeutic range for a longer duration. As a result, sustained-release formulations improve therapeutic efficacy, reduce dosing frequency, minimize side effects, and enhance patient compliance4.
The development of oral drug delivery systems is influenced by several factors related to the physicochemical properties of drug molecules, including their aqueous solubility and membrane permeability. In addition, physiological conditions within the gastrointestinal (GI) tract, such as variations in pH, the presence of metabolic enzymes, and efflux transport mechanisms, can significantly affect drug absorption and bioavailability. Poor chemical and biological stability of drugs, along with gastrointestinal irritation caused by certain medications, may further reduce therapeutic effectiveness. Over the years, extensive research has focused on understanding the processes involved in drug dissolution, interactions with gastrointestinal fluids, intestinal transport, membrane permeability, and the biological barriers that influence oral drug absorption. A thorough understanding of these pharmacokinetic and physicochemical factors is essential for the rational design and successful development of efficient oral drug delivery systems with improved therapeutic performance2.
The oral route is the most widely preferred method of drug administration because of its convenience, ease of use, high patient acceptance, and cost-effectiveness. It supports the development of various solid dosage forms and enables controlled or sustained drug release, thereby improving therapeutic outcomes and patient adherence to treatment. Furthermore, the gastrointestinal (GI) tract provides a large absorptive surface area of approximately 300 m², which facilitates efficient drug dissolution and absorption.
Drug absorption through the oral route is enhanced by the presence of specialized intestinal cells, including enterocytes and micro fold (M) cells located in Peyer's patches. Compared with other routes of administration, oral drug delivery is more convenient and generally well accepted by patients. For successful absorption, a drug must first dissolve in the gastrointestinal fluids before crossing the intestinal membrane. Drug transport across the intestinal epithelium mainly occurs through four mechanisms: Trans cellular transport, Para cellular transport, carrier-mediated transport, and facilitated diffusion5.
Drug transport across the intestinal epithelium is a complex, multistep process influenced by both the physicochemical properties of the drug and the physiological characteristics of the gastrointestinal tract. The movement of drugs across the intestinal barrier generally occurs through three major pathways. The first is Trans cellular passive diffusion, in which lipophilic drug molecules diffuse across the lipid bilayer of epithelial cell membranes. The second is receptor-mediated transcytosis, where specific ligands bound to the cell surface, such as intrinsic factor–vitamin B₁₂ (cobalamin) complexes, are transported across the epithelial cells. The third is the Para cellular pathway, a passive diffusion mechanism that allows small hydrophilic molecules, such as mannitol, to pass through the tight junctions between adjacent epithelial cells.
The extent of drug absorption through the intestinal membrane depends on several physicochemical factors, including particle size, molecular charge, lipophilicity (hydrophobicity), and chemical composition. These properties play a crucial role in determining the efficiency of drug permeation and its subsequent oral bioavailability6.
Nanostructured lipid carriers (NLCs) are the second generation of lipid nanoparticles. They are built from a blend of a solid lipid and a liquid lipid, which yields an imperfect, less ordered lipid matrix than that of solid lipid nanoparticles (SLNs). The disordered matrix allows higher drug loading and reduces drug expulsion during storage7,8. NLCs are made from physiological, generally recognized-as-safe lipids, can be produced by scalable methods, and have been used to improve the oral delivery of several drugs9,10,11,12.
NLCs can be prepared by high-pressure homogenization, ultrasonication, microemulsion, solvent injection, emulsification–solvent diffusion and emulsification–solvent evaporation, among other methods13,14. Solvent evaporation avoids exposing the drug to high shear and heat for long periods and is simple to carry out in a laboratory.
Formulation variables in lipid nanoparticles interact with one another, so a systematic design-of-experiments (DoE) approach is more efficient than varying one factor at a time15,16. Response surface methodology with a central composite design allows a quadratic model of the responses to be fitted with a limited number of runs.
The present work aimed to formulate Atenolol-loaded NLCs by solvent evaporation, to use a two-factor CCD to study the effect of solid lipid and surfactant levels on entrapment efficiency and in vitro release, to characterize the optimized batch, and to develop it into a capsule dosage form.
MATERIALS AND METHODS.
Atenolol was obtained from Dhamtec Pharma and Consultants (Navi Mumbai, India). Glyceryl monostearate (solid lipid) and oleic acid (liquid lipid) were purchased from Fisher Scientific (Mumbai, India). Tween 80 (surfactant), ethanol, hydrochloric acid, potassium dihydrogen orthophosphate and sodium hydroxide were obtained from Karnataka Fine Chem (Bengaluru, India). Aerosil 200 (adsorbent) was from Fuji Chemicals (USA). All other chemicals were of pharmaceutical or laboratory-reagent grade.
Preparation of Atenolol-loaded NLCs
NLCs were prepared by the solvent evaporation method. Atenolol (50 mg), glyceryl monostearate and oleic acid (0.5 mL) were dissolved in 3 mL of ethanol to form the organic phase. This phase was added to an aqueous Tween 80 solution under continuous stirring at 70–80 °C until the organic solvent had evaporated. The resulting nanoemulsion was cooled below 5 °C to solidify the lipid and form the NLCs.
Experimental Design
Atenolol-loaded NLCs were prepared by varying the concentrations of Glyceryl monostearate and Tween 80 to determine optimal vesicular characteristics and drug permeation performance. Central Composite Design (CCD), a well-established statistical optimization approach, was used to assess the effect of selected formulation parameters on the critical quality attributes of the NLCs system. The independent variables chosen for optimization were Glyceryl monostearate concentration (X₁) and Tween 80 concentration (X₂), while entrapment efficiency (Y₁) and cumulative in vitro drug release (Y₂) served as dependent response variables as shown in Table 1.1.
The experimental design was developed using Design-Expert software (Version 12, Stat-Ease Inc., Minneapolis, MN, USA). A response surface methodology (RSM)-based central composite design (CCD) was employed to investigate the effects of two independent factors at different concentration levels, resulting in a total of 13 experimental runs. All formulations were prepared according to the experimental matrix generated by the software, and the run order was randomized to minimize systematic bias and ensure the validity of the statistical analysis17 as shown in Table 1.2. Analysis of variance (ANOVA) and other statistical analyses were conducted using Design-Expert software. Polynomial regression models were developed, and two-dimensional contour plots and three-dimensional response surface plots were generated to evaluate the effects of the independent variables and their interactions on the response variables and to facilitate formulation optimization.
Table 1.1: Variables in Central Composite Design
| Independent variable | Level | |
|---|---|---|
| Low | High | |
| A: Solid Lipid | 50 | 90 |
| B: Surfactants | 0.5 | 1.5 |
| Dependent Variables | ||
| R1: Entrapment Efficiency (%) | ||
| R2: In vitro Release (%) | ||
Table 1.2: Matrix of Central Composite Design of Atenolol Loaded NLCs
| Std | Runs | Factor 1 | Factor 2 |
|---|---|---|---|
| Glyceryl monostearate (mg) | Tween 80 (ml) | ||
| 11 | 1 | 70 | 1 |
| 7 | 2 | 70 | 0.292893 |
| 10 | 3 | 70 | 1 |
| 5 | 4 | 41.7157 | 1 |
| 12 | 5 | 70 | 1 |
| 13 | 6 | 70 | 1 |
| 2 | 7 | 90 | 0.5 |
| 1 | 8 | 50 | 0.5 |
| 4 | 9 | 90 | 1.5 |
| 8 | 10 | 70 | 1.70711 |
| 6 | 11 | 98.2843 | 1 |
| 9 | 12 | 70 | 1 |
| 3 | 13 | 50 | 1.5 |
Table 1.3: Formulation of Atenolol Loaded NLCs
| Formulation | Atenolol (mg) | Glyceryl monostearate (mg) | Oleic acid (ml) | Tween 80 (ml) | Ethanol (ml) |
|---|---|---|---|---|---|
| 1 | 50 | 50 | 0.5 | 0.5 | 3 |
| 2 | 50 | 90 | 0.5 | 0.5 | 3 |
| 3 | 50 | 50 | 0.5 | 1.5 | 3 |
| 4 | 50 | 90 | 0.5 | 1.5 | 3 |
| 5 | 50 | 41.7157 | 0.5 | 1 | 3 |
| 6 | 50 | 98.2843 | 0.5 | 1 | 3 |
| 7 | 50 | 70 | 0.5 | 0.292893 | 3 |
| 8 | 50 | 70 | 0.5 | 1.70711 | 3 |
| 9 | 50 | 70 | 0.5 | 1 | 3 |
| 10 | 50 | 70 | 0.5 | 1 | 3 |
| 11 | 50 | 70 | 0.5 | 1 | 3 |
| 12 | 50 | 70 | 0.5 | 1 | 3 |
| 13 | 50 | 70 | 0.5 | 1 | 3 |
Evaluation of Atenolol Loaded Nanostructured lipid carriers (NLCs)
Determination of Entrapment Efficiency
The Entrapment efficiency of Atenolol loaded NLCs were determined by centrifugation at 1500 rpm for2 hoursusing “Ultracentrifuge (Remi Instruments, Mumbai, India)”. Then, the samples supernatant was pipetted, appropriately diluted with methanol, and then analyzed using a “UV spectrophotometer” at 224 nm.All the experimental units were analyzed in triplicate (n=3)18.
Entrapment Efficiency (EE%)= (Total drug-Drug detected only in supernatant)/(Total drug)×100
Scanning Electron Microscopy (SEM)
The surface morphology, particle shape, and size of the Atenolol loaded NLCs were analysed using SEM. The samples were freeze-dried, mounted onto metal stubs with double-sided adhesive tape, and examined under the microscope. Images were captured for morphological assessment.
Differential Scanning Calorimetry (DSC)
DSC analysis (Perkin-Elmer4000series)wascarriedouttodeterminethephysicalstateof the drug within the formulation. Samples were sealed in aluminium pans and heated at a rate of 20°C/min under a nitrogen atmosphere. The instrument was calibrated for temperature using indium, and enthalpy calibration was performed with sealed indium samples.An empty sealed pan was used as the reference.
Zeta Potential Measurement
The zeta potential of the NLCs was determined using a Malvern Zetasizer (Malvern Instruments, Worcestershire, UK) at 25 ± 1°C. Samples were diluted with Milli-Q water before measurement, and all determinations were carried out in triplicate19.
Particle Size and Zeta Potential Analysis
Vesicle diameter and surface charge (zeta potential) of the prepared NLCs were measured by quasi-elastic light scattering using a zeta sizer instrument. Samples were suitably diluted with Milli-Q water and analyzed in disposable cuvettes under controlled temperature conditions. Zeta potential was measured using a dedicated electrophoretic cell.
In-vitro release Study
Permeation studies on the Atenolol NLCs formulations were conducted using a USP Franz diffusion cell with phosphate buffer (pH 7.4) as the acceptor medium, maintained at a constant temperature. Samples were withdrawn at predetermined intervals and measured spectrophotometrically at 224 nm. Withdrawn volumes were replaced with fresh buffer at each time point to maintain sink conditions, and all experiments were performed in triplicate.
Release Kinetics Study
The results of in vitro release data obtained from diffusion studies were fitted into various kinetic models as follows:
Capsule preparation and evaluation
The optimized NLC dispersion was added dropwise onto Aerosil 200 and mixed with a glass rod to give a uniform adsorbed mass, which was filled into hard gelatin capsules. Capsules were evaluated for weight variation, drug content (as per USP) and in vitro release using USP apparatus I (basket, 50 rpm, 900 mL phosphate buffer pH 7.4, 37 °C, 8 h; 1 mL samples withdrawn at 30 min and then hourly, with replacement; assay at 224 nm).
RESULTS AND DISCUSSION
Entrapment efficiency was determined across all thirteen formulations (F1–F13). The prepared Atenolol NLCs systems demonstrated encapsulation efficiencies in the range of 75.14 ± 0.06% to 85.48 ± 0.12%. In vitro release profiling revealed distinct differences in drug release behavior across formulations containing varying ratios of Solid lipid and Surfactant. Cumulative drug permeation across formulations F1 to F13 ranged from 63.96% to 85.13% over the 8-hour experimental period.
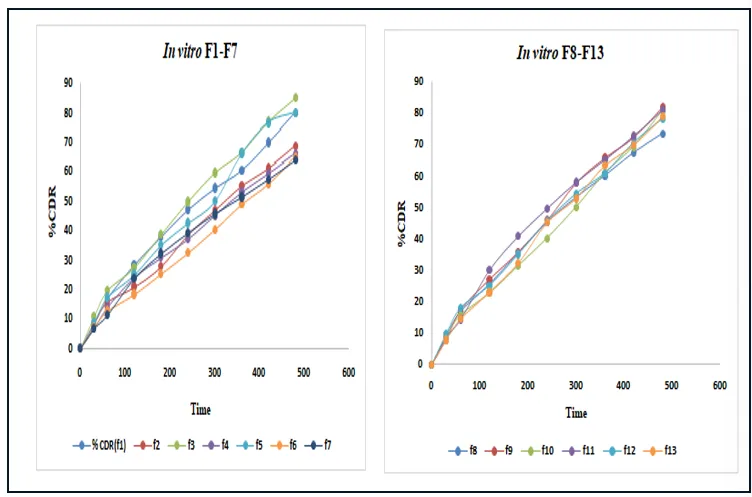
Figure 1.1: Percentage In vitro Drug Release of Formulation (F1 -F13)
Correlation coefficients (r² values) and kinetic parameters derived from fitting the release data of F1–F13 indicated that the Higuchi model best described the drug release profiles, reflecting sustained release behavior. Application of the Korsmeyer–Peppas model demonstrated non-Fickian (anomalous) transport, as indicated by n values ranging from 0.6714 to 0.7236. The Korsmeyer–Peppas model was further evaluated to determine the nature of drug transport, while the release profiles were interpreted in terms of diffusion, lipid matrix degradation or erosion, and matrix-related structural changes. These analyses helped characterize the release behavior of Atenolol from the NLC formulations and assess their potential for sustained oral drug delivery.
Response surface methodology (RSM) was employed to optimize the formulation variables and establish quantitative relationships between the independent variables, namely solid lipid and surfactant concentrations, and the selected responses of the Atenolol-loaded NLCs. A central composite design (CCD) was generated using Design-Expert software, enabling the systematic evaluation of the effects of the formulation variables and their interactions with a limited number of experimental runs. Regression analysis was performed to identify the most appropriate mathematical model, and analysis of variance (ANOVA) was used to assess model adequacy and the statistical significance of the individual formulation variables and their interaction effects.
A two-factor CCD-based response surface design was used to investigate the combined effects of solid lipid and surfactant concentrations on the selected formulation responses, such as entrapment efficiency and in vitro drug release. This approach facilitated the evaluation of the individual and interactive contributions of the independent variables to the physicochemical characteristics and drug release performance of the NLC formulations.
The contour plot for entrapment efficiency showed a gradual increase in efficiency with increasing solid lipid (A) concentration and decreasing surfactant (B) concentration. The isoresponse curves indicated the influence of both factors on drug encapsulation. The corresponding 3D response surface demonstrated higher entrapment efficiency at higher solid lipid concentrations, with the maximum response observed in the orange-red region. Lower efficiency was observed at lower solid lipid concentrations, particularly in the blue-green region. These results suggest that solid lipid concentration had a more pronounced influence on entrapment efficiency than surfactant concentration within the investigated ranges as shown in Fig 1.2.
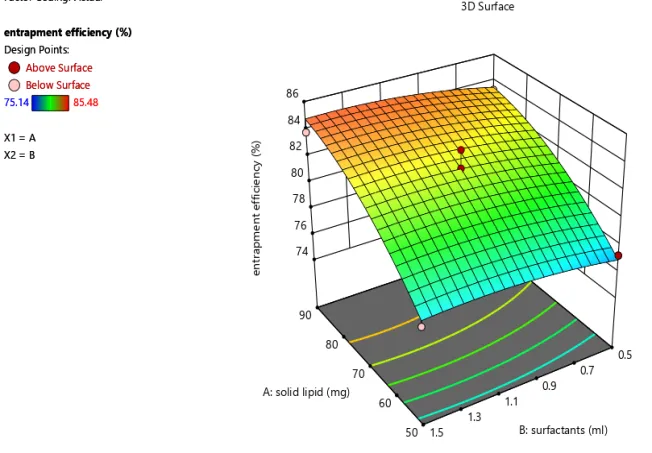
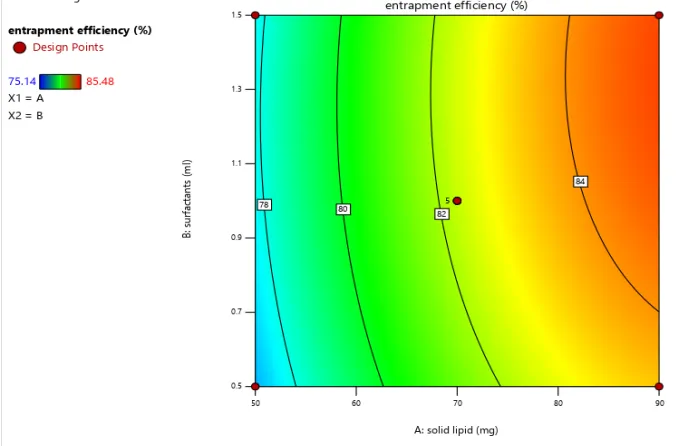
Figure 1.2: 3D Contour Diagrams Illustrating Relationship Among the Various Factors on Drug Entrapment Efficiency
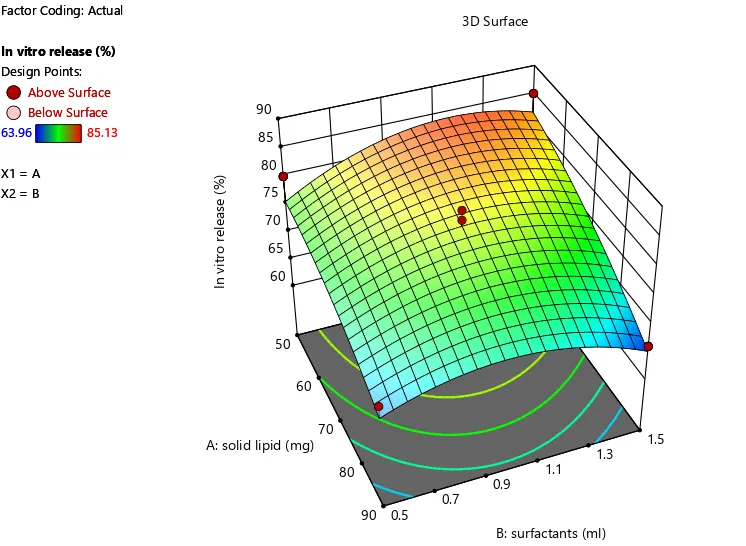
The contour plot for in-vitro drug release showed a gradual decrease in drug release with increasing solid lipid (A) concentration, while surfactant (B) concentration also influenced the release pattern. The isoresponse curves indicated a nonlinear relationship between the two factors. The corresponding 3D response surface demonstrated higher drug release in the orange-red region, while lower release was observed in the blue region. These results suggest that lower solid lipid concentrations and suitable surfactant concentrations favored higher drug release, whereas higher solid lipid concentrations may have slowed drug release due to increased lipid matrix content and prolonged drug diffusion as shown in Fig 1.3. .
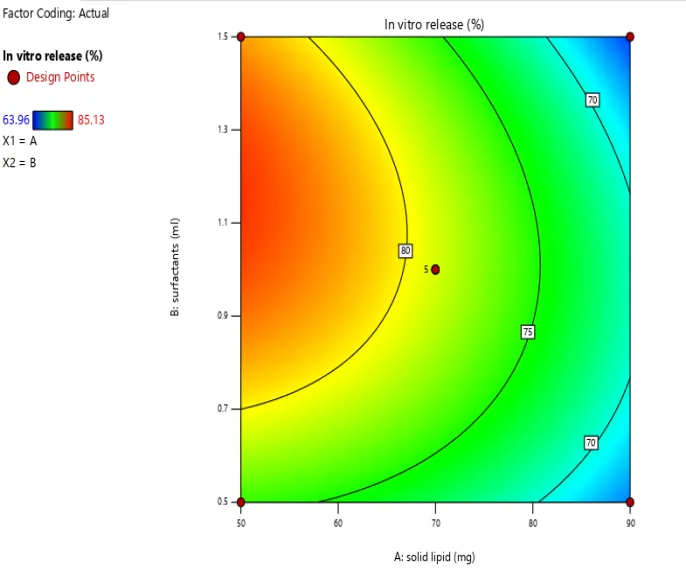
Figure 1.3: 3D Contour Diagrams Illustrating Relationship Among the Various Factors on In vitro Drug Release
Selection of the optimized formulation was carried out using graphical optimization and desirability criteria. Among the prepared formulations, F14 was selected as the optimized Atenolol-loaded nanostructured lipid carrier (NLC). The optimized formulation contained 50 mg of Atenolol, 90 mg of glyceryl monostearate, 1.5 ml of Tween 80, 0.795 ml of oleic acid, and 3 ml of ethanol. It showed an entrapment efficiency of 83.93 ± 0.15%, drug content of 85.95 ± 0.70%, and an in-vitro drug release of 74.7 ± 0.27% at 8 hours. The particle size was approximately 195 nm, and the zeta potential was +38 mV, indicating good physical stability.
Table 1.4: Optimized Formulation of Atenolol Loaded NLCs (F14)
| Sl. No | F14 | |
|---|---|---|
| Ingredients | Quantity | |
| 1 | Atenolol | 50mg |
| 2 | Glyceryl monostearate | 90mg |
| 3 | Tween 80 | 1.5ml |
| 4 | Oleic acid | 0.795ml |
| 5 | Ethanol | 3ml |
| 6 | Aerosil 200 | QS |
In vitro diffusion evaluation of the optimized NLCs (F14) was conducted using a Franz diffusion cell with phosphate buffer (pH 7.4) as the receptor fluid. The diffusion study revealed a sustained drug permeation profile, with cumulative drug release reaching 74.7±0.276 at the conclusion of the 8-hour experiment as shown in Table 1.5.
Table 1.5: In vitro Release of Optimized Atenolol Loaded NLCs
| Sl. No | Time (min) | Optimized Formulation (%) |
|---|---|---|
| 1 | 30 | 7.457±0.082 |
| 2 | 60 | 16.193±0.222 |
| 3 | 120 | 25.328±0.175 |
| 4 | 180 | 33.421±0.182 |
| 5 | 240 | 42.833±0.311 |
| 6 | 300 | 53.913±0.089 |
| 7 | 360 | 61.416±0.059 |
| 8 | 420 | 67.535±0.123 |
| 9 | 480 | 74.7±0.276 |
[Figure - see the formatted PDF]
Figure 1.4: In vitro Release Study of Optimized Atenolol Loaded NLCs
Kinetic analysis of the optimized Atenolol loaded NLCs yielded a Korsmeyer–Peppas r² value of 0.993 and an n value of 0.7107, confirming non-Fickian (anomalous) drug release as the governing transport mechanism as shown in Table 1.6.
Table 1.6: Kinetics Study for Optimized Atenolol Loaded NLCs (F14)
| Kinetics | r2 | |
|---|---|---|
| Zero Order | 0.9989 | |
| First Order | 0.6879 | |
| Higuchi | 0.9854 | |
| Korsmeyer- Peppas | r2 | 0.993 |
| n | 0.7107 | |
The SEM micrographs of the Atenolol-loaded nanostructured lipid carriers (NLCs) revealed spherical nanoparticles with smooth surface morphology and minimal aggregation, as illustrated in Fig 1.5.
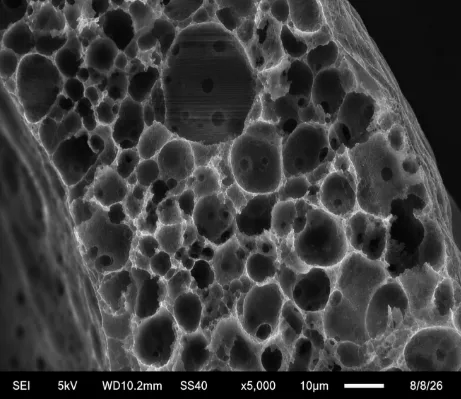
Figure 1.5: SEM Image of Atenolol Nanostructured Lipid Carriers
Zeta potential measurement of the optimized NLCs preparation yielded a value of +38 mV, indicating sufficient electrostatic repulsion between vesicles and satisfactory colloidal stability as illustrated in Fig 1.6.
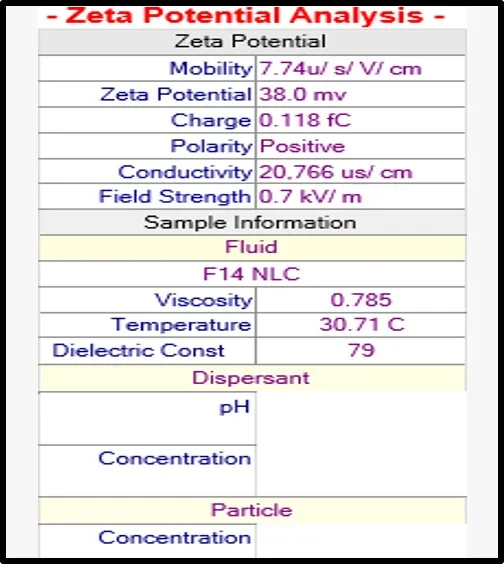
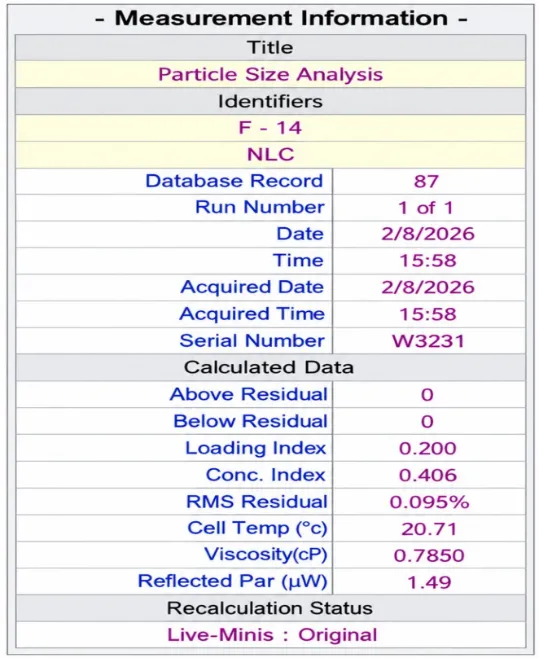
Figure 1.6: Zeta Potential Analysis Fig. 1.7: Particle Size Analysis
Particle size analysis of the optimized Atenolol-loaded nanostructured lipid carrier (NLC) formulation (F14) revealed a predominant particle size of approximately 289 nm, as indicated by the particle size distribution data. The analysis confirmed the formation of nanosized lipid carriers, with most particles falling within the nanometer range as illustrated in Fig 1.7.
CONCLUSION
The present investigation successfully achieved the development and optimization of Atenolol-loaded nanostructured lipid carriers (NLCs) for oral administration using the solvent evaporation technique and Central Composite Design (CCD). The prepared formulations were evaluated for entrapment efficiency, particle size, zeta potential, and in-vitro drug release. The contour plots and 3D response surface plots demonstrated the influence of solid lipid and surfactant concentrations on entrapment efficiency and drug release.
Among the prepared formulations, the optimized formulation (F14) exhibited an entrapment efficiency of 83.93 ± 0.15%, a particle size of 195 nm, and a zeta potential of +38.0 mV. The formulation demonstrated a cumulative drug release of 74.53 ± 0.41% at the end of 8 hours, indicating a controlled drug-release profile. The positive zeta potential suggested the potential for electrostatic repulsion between particles, which may help reduce aggregation.
The optimized NLC formulation was further converted into a capsule dosage form by mixing the NLC powder with Aerosil 200 as an adsorbent before capsule filling. The in-vitro drug-release kinetics followed the zero-order model and indicated a non-Fickian release mechanism, suggesting that drug release involved more than one mechanism.
In conclusion, the developed Atenolol-loaded NLC formulation demonstrated satisfactory physicochemical characteristics and controlled drug release. This formulation offers potential for oral drug delivery by improving drug absorption and potentially enhancing bioavailability. However, further pharmacokinetic and in-vivo studies would be required to confirm improvements in bioavailability and therapeutic efficacy.
FINANCIAL ASSISTANCE
Nil
CONFLICT OF INTEREST
The authors declare no conflict of interest
ACKNOWLEDGMENTS:
The author expresses sincere gratitude to Dr. J. Adlin Jino Nesalin, Professor, Department of Pharmaceutics, T. John College of Pharmacy, Bengaluru, for her invaluable guidance and support throughout the study. Appreciation is also extended to T. John College of Pharmacy for providing the necessary facilities to conduct this research.
REFERENCES

J. Adlin Jino Nesalin, Manjushree P. R., Ganesh N. S., Design and Characterization of Atenolol Nanostructured Lipid Carriers for Oral Administration, Int. J. of Pharm. Sci., 2026, Vol 4, Issue 11, 2570-2580. https://doi.org/10.5281/zenodo.24300928
 10.5281/zenodo.24300928